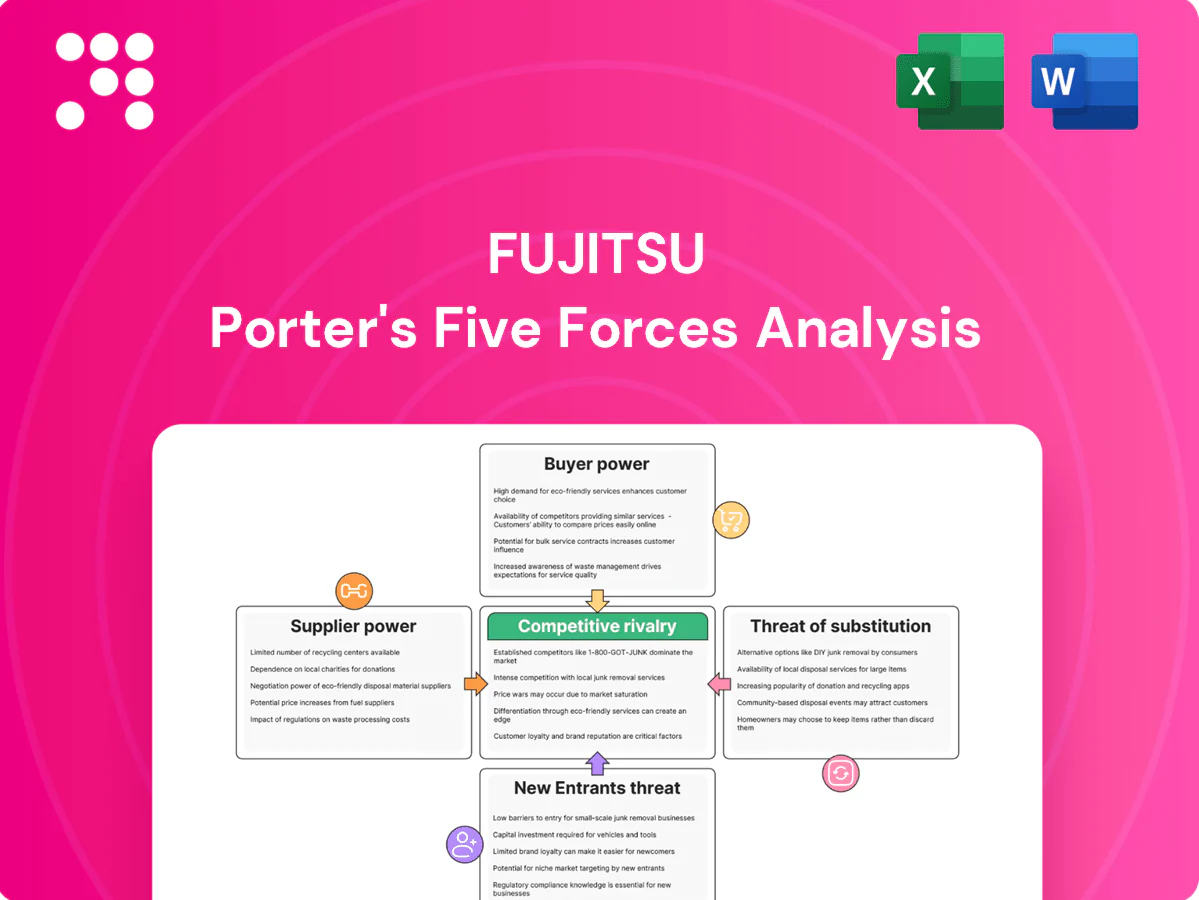
Fujitsu Porter's Five Forces Analysis

Don't Miss the Bigger Picture
Fujitsu faces intense rivalries across IT services, hardware, and cloud segments, with buyer price sensitivity and modular tech driving competition; supplier influence is moderate but innovation pace heightens substitute threats. This brief snapshot only scratches the surface. Unlock the full Porter's Five Forces Analysis to explore Fujitsu’s competitive dynamics and strategic advantages in detail.
Suppliers Bargaining Power

Dependence on advanced chips
AI/compute products depend on a few leading semiconductor suppliers (notably NVIDIA, Intel, AMD), with NVIDIA holding roughly 80% of datacenter GPU share in 2023, concentrating supplier power. Lead-time volatility and allocation risks—GPU lead times spiked to 20+ weeks in 2021–22—can pressure costs and delivery. Fujitsu mitigates this via multi-sourcing and roadmaps that balance architectures; long-term partnerships and volume commitments partially offset supplier leverage.
Software and IP licensors
Operating systems, databases and middleware often carry non-negotiable enterprise terms that cement vendor leverage; audit clauses and price uplifts materially raise switching costs and supplier influence. Red Hat's 2024 survey found 95% of enterprises use open source, giving Fujitsu a leeway to reduce licencing exposure. Fujitsu leans on open-source, proprietary IP, managed-service bundles and co-selling with hyperscalers (AWS ~32%, Azure ~23%, GCP ~12% in 2024) and ISVs to rebalance economics.

Specialized components and telecom parts
Telecom equipment and microelectronics require niche optics, RF modules and substrates supplied by a small set of qualified vendors, and qualification cycles of 12–24 months plus regulatory compliance increase supplier stickiness. Framework agreements and dual-qualification are used to cut single-point-of-failure risk and stabilize pricing. Local sourcing for public-sector projects mitigates geopolitical and logistics risk.

Talent and subcontractors as suppliers
Skilled AI, cloud and cybersecurity talent functions as a critical supplier for Fujitsu; tight markets pushed some specialist rates up about 20% in 2024, straining margins on multi-year delivery programs as utilization swings and attrition rise. Fujitsu, with ~130,000 employees (2024), offsets cost pressure via upskilling, expanded near/offshore delivery and preferred vendor networks to smooth capacity during peaks.
- Talent premiums: ~20% (2024)
- Headcount: ~130,000 (2024)
- Mitigations: upskilling, near/offshore, preferred vendors
Cloud infrastructure partners
Fujitsu faces inverted supplier power when enterprise customers demand specific hyperscalers: AWS (≈32% global IaaS/PaaS 2024), Azure (≈23%), GCP (≈11%), shifting leverage to customers. Marketplace fees (commonly 5–20%) and reserved-instance/Savings Plan discounts (up to ~66–72%) materially affect service margins. Co-invested solutions and joint GTM deals improve contract terms and win rates, while hybrid/multi-cloud designs reduce lock-in and preserve negotiation room.
- Hyperscaler share: AWS 32%, Azure 23%, GCP 11% (2024)
- Marketplace fees: 5–20%
- Reserved discounts: up to ~66–72%
- Hybrid/multi-cloud = less lock-in
GPU concentration (≈80%) and hyperscaler leverage heighten supply and talent cost risks
Supplier power is concentrated in datacenter GPUs (NVIDIA ≈80% share 2023) and niche telecom components, raising price and allocation risk; hyperscalers and enterprise software vendors also exert leverage via platform terms. Fujitsu mitigates through multi-sourcing, long-term partnerships, open-source adoption and nearshore delivery to manage talent cost pressure (~20% premium 2024).
| Item | Metric |
|---|---|
| NVIDIA GPU share | ≈80% (2023) |
| Hyperscalers | AWS 32% / Azure 23% / GCP 11% (2024) |
| Talent premium | ≈20% (2024) |
| Fujitsu headcount | ≈130,000 (2024) |
What is included in the product
 Detailed Word Document
Uncovers the five competitive forces shaping Fujitsu’s industry — rivalry, supplier and buyer power, threat of new entrants and substitutes — highlighting key drivers of competition, pricing pressure, entry barriers, and disruptive threats to its market position.

 Customizable Excel Spreadsheet
A concise one-sheet Fujitsu Porter’s Five Forces summary that instantly clarifies competitive pressure and strategic risks for faster decision-making. Customize force levels, swap in your data, and export clean visuals for decks or reports.
Customers Bargaining Power

Large enterprise and government procurement
Large enterprise and government buyers use RFPs, framework contracts and benchmarking to compress prices, while multi-year, high-ticket deals let them demand strict SLAs and penalties; despite this, referenceability and compliance needs limit pure price pressure, and value-add services like sovereign cloud and mission-critical support shrink buyer leverage—global public cloud spending exceeded $600 billion in 2024, underscoring demand for premium, compliant offerings.
Abundant alternatives
Customers can choose global IT services firms, OEMs and cloud providers — AWS ~33%, Azure ~23%, GCP ~10% in 2024 — expanding alternatives. Comparable offerings increase price transparency and switching options. Differentiation through industry solutions and deep integration curbs churn. Proven delivery track records and security certifications frequently become tie-breakers over price.

Switching costs vary by stack
Commodity PCs and servers have low switching costs, empowering buyers in a market where cloud and IT spending exceeded $500B in 2024; price and supplier churn remain high. Managed services, applications and bespoke integrations create materially higher exit costs and stickiness. Standardized APIs and cloud-native patterns are steadily lowering lock-in. Fujitsu counters with lifecycle-value contracts and services to defend against rebids.

Outcome-based and consumption pricing
Buyers increasingly demand pay-as-you-go and outcome-based pricing, driving FinOps alignment and shifting risk to vendors while squeezing utilization; Fujitsu (≈3.9 trillion JPY revenue FY2023) faces margin pressure as customers insist on measurable outcomes and utilization management.
- Pay-as-you-go pressure
- FinOps alignment required
- Risk shifts to vendor
- Bundled KPIs justify premium
- Flexible contracts protect margins
Security and sovereignty expectations
Regulated buyers demand certifications, strict data residency and full auditability; only a handful of suppliers can deliver end-to-end compliance at scale, concentrating supply (top cloud providers hold roughly 70% of IaaS/PaaS market in 2024). That scarcity reduces buyer bargaining power, enabling premium pricing and multi-year contracts, but any breach or compliance gap would rapidly reverse leverage to buyers.
- Certifications: required for procurement
- Data residency: onshore mandates drive vendor choice
- Auditability: enables multi-year retention
- Market concentration: ~70% top-cloud share (2024)
Top clouds ~70% IaaS/PaaS; 33%/23%/10% splits
Buyers use RFPs, benchmarking and multi-year SLAs to compress price, but compliance, referenceability and sovereign-cloud needs limit pure price leverage. Choice of AWS ~33%, Azure ~23%, GCP ~10% (2024) widens alternatives while top clouds hold ~70% IaaS/PaaS, keeping premium providers advantaged. Pay-as-you-go and outcome pricing shift risk and squeeze margins (Fujitsu ≈3.9T JPY FY2023).
| Metric | 2024/ FY2023 |
|---|---|
| Global public cloud spend | >$600B (2024) |
| AWS/Azure/GCP share | 33% / 23% / 10% (2024) |
| Top-cloud IaaS/PaaS concentration | ~70% (2024) |
| Fujitsu revenue | ≈3.9T JPY (FY2023) |
Preview the Actual Deliverable
Fujitsu Porter's Five Forces Analysis
This Fujitsu Porter's Five Forces analysis preview is the exact, fully formatted document you’ll receive immediately after purchase. It contains the complete strategic assessment—no mockups, no placeholders, and no missing sections. Once you buy, you’ll get instant access to this same file, ready for download and use in reports or presentations. The content is final and production-ready for your needs.

Don't Miss the Bigger Picture
Fujitsu faces intense rivalries across IT services, hardware, and cloud segments, with buyer price sensitivity and modular tech driving competition; supplier influence is moderate but innovation pace heightens substitute threats. This brief snapshot only scratches the surface. Unlock the full Porter's Five Forces Analysis to explore Fujitsu’s competitive dynamics and strategic advantages in detail.
Suppliers Bargaining Power
Dependence on advanced chips
AI/compute products depend on a few leading semiconductor suppliers (notably NVIDIA, Intel, AMD), with NVIDIA holding roughly 80% of datacenter GPU share in 2023, concentrating supplier power. Lead-time volatility and allocation risks—GPU lead times spiked to 20+ weeks in 2021–22—can pressure costs and delivery. Fujitsu mitigates this via multi-sourcing and roadmaps that balance architectures; long-term partnerships and volume commitments partially offset supplier leverage.
Software and IP licensors
Operating systems, databases and middleware often carry non-negotiable enterprise terms that cement vendor leverage; audit clauses and price uplifts materially raise switching costs and supplier influence. Red Hat's 2024 survey found 95% of enterprises use open source, giving Fujitsu a leeway to reduce licencing exposure. Fujitsu leans on open-source, proprietary IP, managed-service bundles and co-selling with hyperscalers (AWS ~32%, Azure ~23%, GCP ~12% in 2024) and ISVs to rebalance economics.
Specialized components and telecom parts
Telecom equipment and microelectronics require niche optics, RF modules and substrates supplied by a small set of qualified vendors, and qualification cycles of 12–24 months plus regulatory compliance increase supplier stickiness. Framework agreements and dual-qualification are used to cut single-point-of-failure risk and stabilize pricing. Local sourcing for public-sector projects mitigates geopolitical and logistics risk.
Talent and subcontractors as suppliers
Skilled AI, cloud and cybersecurity talent functions as a critical supplier for Fujitsu; tight markets pushed some specialist rates up about 20% in 2024, straining margins on multi-year delivery programs as utilization swings and attrition rise. Fujitsu, with ~130,000 employees (2024), offsets cost pressure via upskilling, expanded near/offshore delivery and preferred vendor networks to smooth capacity during peaks.
- Talent premiums: ~20% (2024)
- Headcount: ~130,000 (2024)
- Mitigations: upskilling, near/offshore, preferred vendors
Cloud infrastructure partners
Fujitsu faces inverted supplier power when enterprise customers demand specific hyperscalers: AWS (≈32% global IaaS/PaaS 2024), Azure (≈23%), GCP (≈11%), shifting leverage to customers. Marketplace fees (commonly 5–20%) and reserved-instance/Savings Plan discounts (up to ~66–72%) materially affect service margins. Co-invested solutions and joint GTM deals improve contract terms and win rates, while hybrid/multi-cloud designs reduce lock-in and preserve negotiation room.
- Hyperscaler share: AWS 32%, Azure 23%, GCP 11% (2024)
- Marketplace fees: 5–20%
- Reserved discounts: up to ~66–72%
- Hybrid/multi-cloud = less lock-in
GPU concentration (≈80%) and hyperscaler leverage heighten supply and talent cost risks
Supplier power is concentrated in datacenter GPUs (NVIDIA ≈80% share 2023) and niche telecom components, raising price and allocation risk; hyperscalers and enterprise software vendors also exert leverage via platform terms. Fujitsu mitigates through multi-sourcing, long-term partnerships, open-source adoption and nearshore delivery to manage talent cost pressure (~20% premium 2024).
| Item | Metric |
|---|---|
| NVIDIA GPU share | ≈80% (2023) |
| Hyperscalers | AWS 32% / Azure 23% / GCP 11% (2024) |
| Talent premium | ≈20% (2024) |
| Fujitsu headcount | ≈130,000 (2024) |
What is included in the product
Detailed Word Document
Uncovers the five competitive forces shaping Fujitsu’s industry — rivalry, supplier and buyer power, threat of new entrants and substitutes — highlighting key drivers of competition, pricing pressure, entry barriers, and disruptive threats to its market position.
Customizable Excel Spreadsheet
A concise one-sheet Fujitsu Porter’s Five Forces summary that instantly clarifies competitive pressure and strategic risks for faster decision-making. Customize force levels, swap in your data, and export clean visuals for decks or reports.
Customers Bargaining Power
Large enterprise and government procurement
Large enterprise and government buyers use RFPs, framework contracts and benchmarking to compress prices, while multi-year, high-ticket deals let them demand strict SLAs and penalties; despite this, referenceability and compliance needs limit pure price pressure, and value-add services like sovereign cloud and mission-critical support shrink buyer leverage—global public cloud spending exceeded $600 billion in 2024, underscoring demand for premium, compliant offerings.
Abundant alternatives
Customers can choose global IT services firms, OEMs and cloud providers — AWS ~33%, Azure ~23%, GCP ~10% in 2024 — expanding alternatives. Comparable offerings increase price transparency and switching options. Differentiation through industry solutions and deep integration curbs churn. Proven delivery track records and security certifications frequently become tie-breakers over price.
Switching costs vary by stack
Commodity PCs and servers have low switching costs, empowering buyers in a market where cloud and IT spending exceeded $500B in 2024; price and supplier churn remain high. Managed services, applications and bespoke integrations create materially higher exit costs and stickiness. Standardized APIs and cloud-native patterns are steadily lowering lock-in. Fujitsu counters with lifecycle-value contracts and services to defend against rebids.
Outcome-based and consumption pricing
Buyers increasingly demand pay-as-you-go and outcome-based pricing, driving FinOps alignment and shifting risk to vendors while squeezing utilization; Fujitsu (≈3.9 trillion JPY revenue FY2023) faces margin pressure as customers insist on measurable outcomes and utilization management.
- Pay-as-you-go pressure
- FinOps alignment required
- Risk shifts to vendor
- Bundled KPIs justify premium
- Flexible contracts protect margins
Security and sovereignty expectations
Regulated buyers demand certifications, strict data residency and full auditability; only a handful of suppliers can deliver end-to-end compliance at scale, concentrating supply (top cloud providers hold roughly 70% of IaaS/PaaS market in 2024). That scarcity reduces buyer bargaining power, enabling premium pricing and multi-year contracts, but any breach or compliance gap would rapidly reverse leverage to buyers.
- Certifications: required for procurement
- Data residency: onshore mandates drive vendor choice
- Auditability: enables multi-year retention
- Market concentration: ~70% top-cloud share (2024)
Top clouds ~70% IaaS/PaaS; 33%/23%/10% splits
Buyers use RFPs, benchmarking and multi-year SLAs to compress price, but compliance, referenceability and sovereign-cloud needs limit pure price leverage. Choice of AWS ~33%, Azure ~23%, GCP ~10% (2024) widens alternatives while top clouds hold ~70% IaaS/PaaS, keeping premium providers advantaged. Pay-as-you-go and outcome pricing shift risk and squeeze margins (Fujitsu ≈3.9T JPY FY2023).
| Metric | 2024/ FY2023 |
|---|---|
| Global public cloud spend | >$600B (2024) |
| AWS/Azure/GCP share | 33% / 23% / 10% (2024) |
| Top-cloud IaaS/PaaS concentration | ~70% (2024) |
| Fujitsu revenue | ≈3.9T JPY (FY2023) |
Preview the Actual Deliverable
Fujitsu Porter's Five Forces Analysis
This Fujitsu Porter's Five Forces analysis preview is the exact, fully formatted document you’ll receive immediately after purchase. It contains the complete strategic assessment—no mockups, no placeholders, and no missing sections. Once you buy, you’ll get instant access to this same file, ready for download and use in reports or presentations. The content is final and production-ready for your needs.
Description
Don't Miss the Bigger Picture
Fujitsu faces intense rivalries across IT services, hardware, and cloud segments, with buyer price sensitivity and modular tech driving competition; supplier influence is moderate but innovation pace heightens substitute threats. This brief snapshot only scratches the surface. Unlock the full Porter's Five Forces Analysis to explore Fujitsu’s competitive dynamics and strategic advantages in detail.
Suppliers Bargaining Power
Dependence on advanced chips
AI/compute products depend on a few leading semiconductor suppliers (notably NVIDIA, Intel, AMD), with NVIDIA holding roughly 80% of datacenter GPU share in 2023, concentrating supplier power. Lead-time volatility and allocation risks—GPU lead times spiked to 20+ weeks in 2021–22—can pressure costs and delivery. Fujitsu mitigates this via multi-sourcing and roadmaps that balance architectures; long-term partnerships and volume commitments partially offset supplier leverage.
Software and IP licensors
Operating systems, databases and middleware often carry non-negotiable enterprise terms that cement vendor leverage; audit clauses and price uplifts materially raise switching costs and supplier influence. Red Hat's 2024 survey found 95% of enterprises use open source, giving Fujitsu a leeway to reduce licencing exposure. Fujitsu leans on open-source, proprietary IP, managed-service bundles and co-selling with hyperscalers (AWS ~32%, Azure ~23%, GCP ~12% in 2024) and ISVs to rebalance economics.
Specialized components and telecom parts
Telecom equipment and microelectronics require niche optics, RF modules and substrates supplied by a small set of qualified vendors, and qualification cycles of 12–24 months plus regulatory compliance increase supplier stickiness. Framework agreements and dual-qualification are used to cut single-point-of-failure risk and stabilize pricing. Local sourcing for public-sector projects mitigates geopolitical and logistics risk.
Talent and subcontractors as suppliers
Skilled AI, cloud and cybersecurity talent functions as a critical supplier for Fujitsu; tight markets pushed some specialist rates up about 20% in 2024, straining margins on multi-year delivery programs as utilization swings and attrition rise. Fujitsu, with ~130,000 employees (2024), offsets cost pressure via upskilling, expanded near/offshore delivery and preferred vendor networks to smooth capacity during peaks.
- Talent premiums: ~20% (2024)
- Headcount: ~130,000 (2024)
- Mitigations: upskilling, near/offshore, preferred vendors
Cloud infrastructure partners
Fujitsu faces inverted supplier power when enterprise customers demand specific hyperscalers: AWS (≈32% global IaaS/PaaS 2024), Azure (≈23%), GCP (≈11%), shifting leverage to customers. Marketplace fees (commonly 5–20%) and reserved-instance/Savings Plan discounts (up to ~66–72%) materially affect service margins. Co-invested solutions and joint GTM deals improve contract terms and win rates, while hybrid/multi-cloud designs reduce lock-in and preserve negotiation room.
- Hyperscaler share: AWS 32%, Azure 23%, GCP 11% (2024)
- Marketplace fees: 5–20%
- Reserved discounts: up to ~66–72%
- Hybrid/multi-cloud = less lock-in
GPU concentration (≈80%) and hyperscaler leverage heighten supply and talent cost risks
Supplier power is concentrated in datacenter GPUs (NVIDIA ≈80% share 2023) and niche telecom components, raising price and allocation risk; hyperscalers and enterprise software vendors also exert leverage via platform terms. Fujitsu mitigates through multi-sourcing, long-term partnerships, open-source adoption and nearshore delivery to manage talent cost pressure (~20% premium 2024).
| Item | Metric |
|---|---|
| NVIDIA GPU share | ≈80% (2023) |
| Hyperscalers | AWS 32% / Azure 23% / GCP 11% (2024) |
| Talent premium | ≈20% (2024) |
| Fujitsu headcount | ≈130,000 (2024) |
What is included in the product
Detailed Word Document
Uncovers the five competitive forces shaping Fujitsu’s industry — rivalry, supplier and buyer power, threat of new entrants and substitutes — highlighting key drivers of competition, pricing pressure, entry barriers, and disruptive threats to its market position.
Customizable Excel Spreadsheet
A concise one-sheet Fujitsu Porter’s Five Forces summary that instantly clarifies competitive pressure and strategic risks for faster decision-making. Customize force levels, swap in your data, and export clean visuals for decks or reports.
Customers Bargaining Power
Large enterprise and government procurement
Large enterprise and government buyers use RFPs, framework contracts and benchmarking to compress prices, while multi-year, high-ticket deals let them demand strict SLAs and penalties; despite this, referenceability and compliance needs limit pure price pressure, and value-add services like sovereign cloud and mission-critical support shrink buyer leverage—global public cloud spending exceeded $600 billion in 2024, underscoring demand for premium, compliant offerings.
Abundant alternatives
Customers can choose global IT services firms, OEMs and cloud providers — AWS ~33%, Azure ~23%, GCP ~10% in 2024 — expanding alternatives. Comparable offerings increase price transparency and switching options. Differentiation through industry solutions and deep integration curbs churn. Proven delivery track records and security certifications frequently become tie-breakers over price.
Switching costs vary by stack
Commodity PCs and servers have low switching costs, empowering buyers in a market where cloud and IT spending exceeded $500B in 2024; price and supplier churn remain high. Managed services, applications and bespoke integrations create materially higher exit costs and stickiness. Standardized APIs and cloud-native patterns are steadily lowering lock-in. Fujitsu counters with lifecycle-value contracts and services to defend against rebids.
Outcome-based and consumption pricing
Buyers increasingly demand pay-as-you-go and outcome-based pricing, driving FinOps alignment and shifting risk to vendors while squeezing utilization; Fujitsu (≈3.9 trillion JPY revenue FY2023) faces margin pressure as customers insist on measurable outcomes and utilization management.
- Pay-as-you-go pressure
- FinOps alignment required
- Risk shifts to vendor
- Bundled KPIs justify premium
- Flexible contracts protect margins
Security and sovereignty expectations
Regulated buyers demand certifications, strict data residency and full auditability; only a handful of suppliers can deliver end-to-end compliance at scale, concentrating supply (top cloud providers hold roughly 70% of IaaS/PaaS market in 2024). That scarcity reduces buyer bargaining power, enabling premium pricing and multi-year contracts, but any breach or compliance gap would rapidly reverse leverage to buyers.
- Certifications: required for procurement
- Data residency: onshore mandates drive vendor choice
- Auditability: enables multi-year retention
- Market concentration: ~70% top-cloud share (2024)
Top clouds ~70% IaaS/PaaS; 33%/23%/10% splits
Buyers use RFPs, benchmarking and multi-year SLAs to compress price, but compliance, referenceability and sovereign-cloud needs limit pure price leverage. Choice of AWS ~33%, Azure ~23%, GCP ~10% (2024) widens alternatives while top clouds hold ~70% IaaS/PaaS, keeping premium providers advantaged. Pay-as-you-go and outcome pricing shift risk and squeeze margins (Fujitsu ≈3.9T JPY FY2023).
| Metric | 2024/ FY2023 |
|---|---|
| Global public cloud spend | >$600B (2024) |
| AWS/Azure/GCP share | 33% / 23% / 10% (2024) |
| Top-cloud IaaS/PaaS concentration | ~70% (2024) |
| Fujitsu revenue | ≈3.9T JPY (FY2023) |
Preview the Actual Deliverable
Fujitsu Porter's Five Forces Analysis
This Fujitsu Porter's Five Forces analysis preview is the exact, fully formatted document you’ll receive immediately after purchase. It contains the complete strategic assessment—no mockups, no placeholders, and no missing sections. Once you buy, you’ll get instant access to this same file, ready for download and use in reports or presentations. The content is final and production-ready for your needs.











