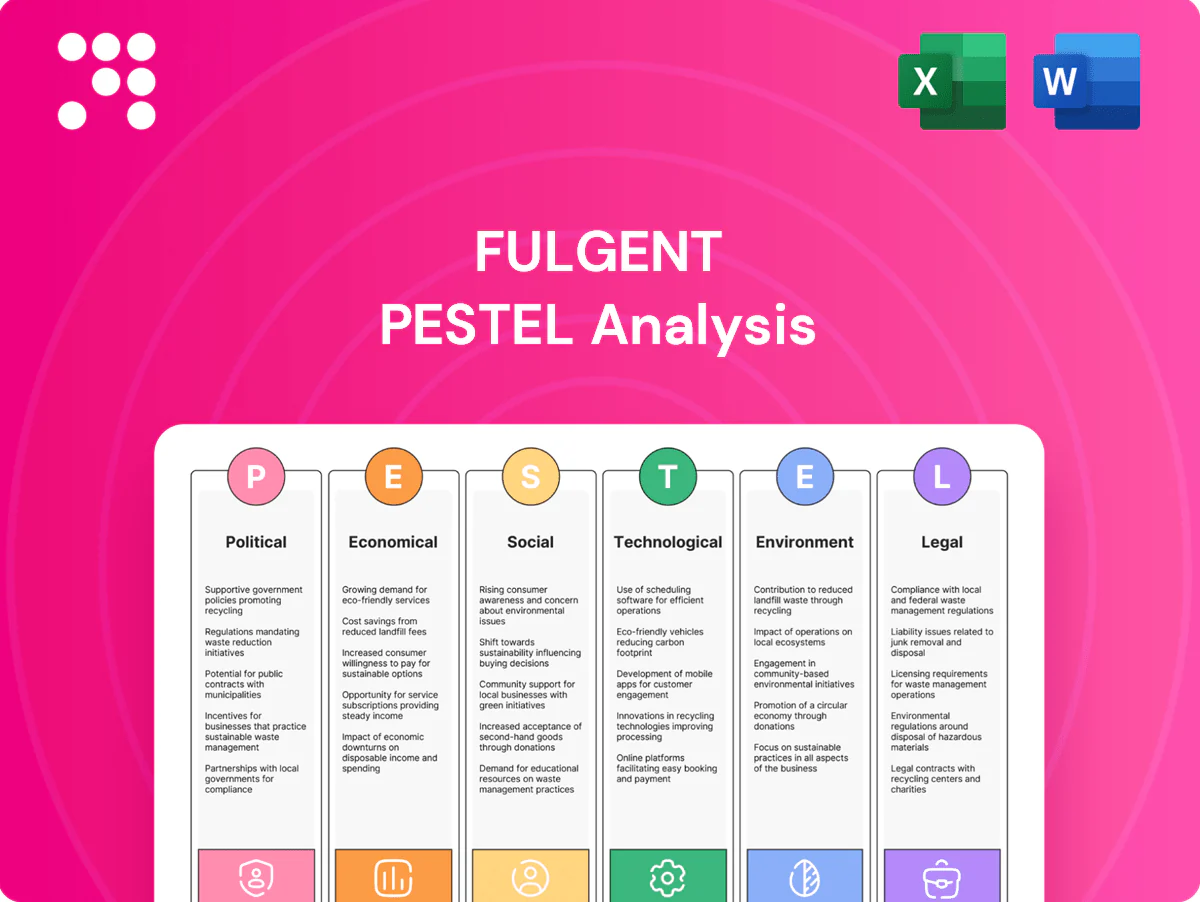
Fulgent PESTLE Analysis

Your Competitive Advantage Starts with This Report
Discover how political shifts, healthcare economics, and rapid biotech innovation are shaping Fulgent’s strategic outlook in our concise PESTLE snapshot. This analysis highlights regulatory risks, market drivers, and technological opportunities for investors and strategists. Purchase the full PESTLE to get actionable, ready-to-use insights and download instantly.
Political factors

Healthcare policy and reimbursement agendas
National health priorities and budget allocations shape coverage for genetic testing across rare disease, oncology, and reproductive care; Medicare (~65M enrollees) and Medicaid (~85M) coverage decisions materially affect demand. Shifts in Medicare/Medicaid policy or single‑payer debates can expand or restrict access, altering a US genetic testing market (~$10B in 2023). Election cycles and 2024 committee leadership changes have already redirected funding streams and guideline adoption; Fulgent must track policy signals to align test menus and pricing.
Regulatory posture on laboratory-developed tests
FDA has historically exercised enforcement discretion for laboratory-developed tests since 1976, so shifts toward FDA oversight versus CLIA-only models directly affect approval timelines, validation costs, and market speed for companies like Fulgent. Tightening oversight, debated through 2024 policy proposals, would raise barriers to entry but favor large menu holders with established quality systems. Clear transitional or grandfathering provisions and policy certainty reduce compliance risk and support strategic planning.

Public funding for genomics and cancer initiatives
Government grants and national precision medicine programs—All of Us with over 600,000 participants (2024) and NIH funding near $48B in FY2024—catalyze test utilization and data partnerships. Oncology Moonshot and rare-disease initiatives, backed by targeted federal funding streams, expand addressable populations for Fulgent. Procurement preferences increasingly favor domestic capabilities in critical health tech. Fulgent can leverage consortia to accelerate evidence generation.

Trade relations and supply security
Trade tensions and export controls—notably US restrictions on advanced semiconductors and related equipment through 2022–2024—raise costs and limit availability of sequencers, reagents and chips for Fulgent, driving longer lead times and higher procurement spend. Political incentives for onshoring biomanufacturing in the US and EU create shifting supplier landscapes and potential capex-backed supply agreements. Customs delays and sanctions force higher inventory and dual-sourcing; strategic stockpiles are being adopted to hedge political shocks.
- Tariffs/export controls: tightened 2022–2024 impacting equipment access
- Onshoring: policy-driven supplier reshaping, increased domestic CAPEX
- Operational impacts: higher inventory, dual-sourcing needs
- Mitigation: strategic stockpiles to buffer supply shocks
Pandemic preparedness and public health contracts
Pandemic policy frameworks directly drive demand for infectious-disease testing capacity, with federal and state contracts producing step-change revenue during surges but often declining post-surge. Readiness rules increasingly require labs to maintain surge staffing and capital buffers to meet rapid-response windows (often 24–48 hours for priority pathogens). Flexible, multiplex platforms preserve eligibility for fast deployment under emergency contracting.
- Federal/state contracts: high revenue in surge, volatile afterward
- Readiness: surge staffing and capital reserves required
- Turnaround expectations: 24–48 hour windows
- Flexible platforms: maintain eligibility for rapid deployment
Medicare/Medicaid shifts, FDA LDT oversight and federal funding reshape diagnostics costs
Medicare (~65M) and Medicaid (~85M) reimbursement changes, FDA LDT oversight debates through 2024, and federal funding (NIH ~$48B FY2024; All of Us 600k+ participants) materially shape demand, approval costs, and partnerships for Fulgent; trade controls (2022–24) and onshoring raise equipment costs and inventory needs.
| Factor | 2024/25 Data |
|---|---|
| Medicare enrollees | ~65M |
| NIH budget FY2024 | ~$48B |
What is included in the product
 Detailed Word Document
Provides a concise PESTLE evaluation of Fulgent, examining Political, Economic, Social, Technological, Environmental, and Legal forces with data-backed trends and sector-specific examples; designed to help executives, investors, and strategists identify risks, opportunities, and forward-looking scenarios.

 Customizable Excel Spreadsheet
Provides a concise, visually segmented PESTLE summary of Fulgent that’s easily editable for local context and drop‑ready for presentations, enabling quick team alignment and streamlined risk discussions during planning sessions.
Economic factors

Payer mix and reimbursement rates
Commercial vs government payer shares determine realized price per test, with Medicare and Medicaid reimbursements generally about 40% lower than commercial rates, materially compressing revenue when public payers dominate. Reimbursement coding changes and expanding prior authorization rules (notably for genetic panels in 2024–25) increase volatility in revenue predictability. Strong clinical utility data supports favorable coverage decisions, while margins hinge on denials management and contract negotiation strength.
Testing volume elasticity and macro cycles
Elective genomics volumes track employment and insurance: US unemployment 3.7% (June 2025, BLS) and employer-sponsored coverage ~49% (KFF 2023) influence discretionary and fertility testing demand, which falls in recessions while oncology remains relatively stable. US CPI inflation averaged ~3.4% in 2024 (BLS), pressuring labor, reagents and logistics costs. High operating leverage in labs amplifies margin swings on revenue upturns and downturns.

Post-pandemic normalization
Post-pandemic normalization exposes Fulgent to reversion risk after elevated COVID-era revenues, making redeployment of capacity from infectious disease testing into oncology and rare-disease panels essential to stabilize top-line performance; investor expectations now center on sustainable ex-COVID growth trajectories and margin recovery. Diversification across genomic services smooths revenue volatility and supports long-term valuation resilience.

Scale economics and automation
Scale economics lower unit costs as throughput and optimized batching rise; industry sequencing costs fell to about $200 per human genome by 2022 (Illumina milestone), enabling labs to spread fixed costs over higher volume. Automation cuts turn-around-time and labor intensity, improving gross margins; capital intensity demands disciplined utilization and platform mix management, while shared sequencing and informatics stacks drive economies of scope.
- Throughput-driven unit cost decline: $200/genome (2022)
- Automation: faster TAT, lower labor per test
- Capital intensity: requires utilization discipline
- Economies of scope: shared sequencing/informatics
Competitive intensity and consolidation
Large diagnostics firms, specialty labs, and hospital labs compete on menu breadth, turnaround, and payer access; Quest Diagnostics and LabCorp together hold roughly 50–60% of U.S. outpatient testing, intensifying competitive pressure. M&A bundles services and cross-selling channels, while price competition on commoditized panels raises the strategic value of proprietary assays and pushes labs toward partnerships to close distribution gaps.
- Market share: Quest/LabCorp ~50–60%
- M&A: bundles services, expands channels
- Pricing: commoditized panels under pressure
- Strategy: proprietary content + partnerships offset distribution
Medicare/Medicaid shifts, FDA LDT oversight and federal funding reshape diagnostics costs
Payer mix drives realized prices—Medicare/Medicaid ~40% below commercial rates—while reimbursement coding/prior auth (2024–25) increases revenue volatility. US unemployment 3.7% (Jun 2025) and employer coverage ~49% (KFF 2023) pressure elective genomics; CPI 3.4% (2024) raises labor/reagent costs. Sequencing cost ~ $200/genome (2022); Quest/LabCorp hold ~50–60% of outpatient testing.
| Metric | Value | Impact |
|---|---|---|
| Medicare discount | ~40% | Revenue compression |
| Unemployment | 3.7% (Jun 2025) | Elective demand |
| Employer coverage | ~49% (KFF 2023) | Insurance access |
| CPI | 3.4% (2024) | Cost pressure |
| Seq cost | $200/genome (2022) | Unit cost decline |
| Market share | 50–60% | Competitive pressure |
Preview Before You Purchase
Fulgent PESTLE Analysis
The preview shown here is the exact document you’ll receive after purchase—fully formatted and ready to use. The Fulgent PESTLE Analysis delivers concise coverage of political, economic, social, technological, legal, and environmental factors affecting Fulgent, with clear implications and strategic recommendations. No placeholders, ready to download.

Your Competitive Advantage Starts with This Report
Discover how political shifts, healthcare economics, and rapid biotech innovation are shaping Fulgent’s strategic outlook in our concise PESTLE snapshot. This analysis highlights regulatory risks, market drivers, and technological opportunities for investors and strategists. Purchase the full PESTLE to get actionable, ready-to-use insights and download instantly.
Political factors
Healthcare policy and reimbursement agendas
National health priorities and budget allocations shape coverage for genetic testing across rare disease, oncology, and reproductive care; Medicare (~65M enrollees) and Medicaid (~85M) coverage decisions materially affect demand. Shifts in Medicare/Medicaid policy or single‑payer debates can expand or restrict access, altering a US genetic testing market (~$10B in 2023). Election cycles and 2024 committee leadership changes have already redirected funding streams and guideline adoption; Fulgent must track policy signals to align test menus and pricing.
Regulatory posture on laboratory-developed tests
FDA has historically exercised enforcement discretion for laboratory-developed tests since 1976, so shifts toward FDA oversight versus CLIA-only models directly affect approval timelines, validation costs, and market speed for companies like Fulgent. Tightening oversight, debated through 2024 policy proposals, would raise barriers to entry but favor large menu holders with established quality systems. Clear transitional or grandfathering provisions and policy certainty reduce compliance risk and support strategic planning.
Public funding for genomics and cancer initiatives
Government grants and national precision medicine programs—All of Us with over 600,000 participants (2024) and NIH funding near $48B in FY2024—catalyze test utilization and data partnerships. Oncology Moonshot and rare-disease initiatives, backed by targeted federal funding streams, expand addressable populations for Fulgent. Procurement preferences increasingly favor domestic capabilities in critical health tech. Fulgent can leverage consortia to accelerate evidence generation.
Trade relations and supply security
Trade tensions and export controls—notably US restrictions on advanced semiconductors and related equipment through 2022–2024—raise costs and limit availability of sequencers, reagents and chips for Fulgent, driving longer lead times and higher procurement spend. Political incentives for onshoring biomanufacturing in the US and EU create shifting supplier landscapes and potential capex-backed supply agreements. Customs delays and sanctions force higher inventory and dual-sourcing; strategic stockpiles are being adopted to hedge political shocks.
- Tariffs/export controls: tightened 2022–2024 impacting equipment access
- Onshoring: policy-driven supplier reshaping, increased domestic CAPEX
- Operational impacts: higher inventory, dual-sourcing needs
- Mitigation: strategic stockpiles to buffer supply shocks
Pandemic preparedness and public health contracts
Pandemic policy frameworks directly drive demand for infectious-disease testing capacity, with federal and state contracts producing step-change revenue during surges but often declining post-surge. Readiness rules increasingly require labs to maintain surge staffing and capital buffers to meet rapid-response windows (often 24–48 hours for priority pathogens). Flexible, multiplex platforms preserve eligibility for fast deployment under emergency contracting.
- Federal/state contracts: high revenue in surge, volatile afterward
- Readiness: surge staffing and capital reserves required
- Turnaround expectations: 24–48 hour windows
- Flexible platforms: maintain eligibility for rapid deployment
Medicare/Medicaid shifts, FDA LDT oversight and federal funding reshape diagnostics costs
Medicare (~65M) and Medicaid (~85M) reimbursement changes, FDA LDT oversight debates through 2024, and federal funding (NIH ~$48B FY2024; All of Us 600k+ participants) materially shape demand, approval costs, and partnerships for Fulgent; trade controls (2022–24) and onshoring raise equipment costs and inventory needs.
| Factor | 2024/25 Data |
|---|---|
| Medicare enrollees | ~65M |
| NIH budget FY2024 | ~$48B |
What is included in the product
Detailed Word Document
Provides a concise PESTLE evaluation of Fulgent, examining Political, Economic, Social, Technological, Environmental, and Legal forces with data-backed trends and sector-specific examples; designed to help executives, investors, and strategists identify risks, opportunities, and forward-looking scenarios.
Customizable Excel Spreadsheet
Provides a concise, visually segmented PESTLE summary of Fulgent that’s easily editable for local context and drop‑ready for presentations, enabling quick team alignment and streamlined risk discussions during planning sessions.
Economic factors
Payer mix and reimbursement rates
Commercial vs government payer shares determine realized price per test, with Medicare and Medicaid reimbursements generally about 40% lower than commercial rates, materially compressing revenue when public payers dominate. Reimbursement coding changes and expanding prior authorization rules (notably for genetic panels in 2024–25) increase volatility in revenue predictability. Strong clinical utility data supports favorable coverage decisions, while margins hinge on denials management and contract negotiation strength.
Testing volume elasticity and macro cycles
Elective genomics volumes track employment and insurance: US unemployment 3.7% (June 2025, BLS) and employer-sponsored coverage ~49% (KFF 2023) influence discretionary and fertility testing demand, which falls in recessions while oncology remains relatively stable. US CPI inflation averaged ~3.4% in 2024 (BLS), pressuring labor, reagents and logistics costs. High operating leverage in labs amplifies margin swings on revenue upturns and downturns.
Post-pandemic normalization
Post-pandemic normalization exposes Fulgent to reversion risk after elevated COVID-era revenues, making redeployment of capacity from infectious disease testing into oncology and rare-disease panels essential to stabilize top-line performance; investor expectations now center on sustainable ex-COVID growth trajectories and margin recovery. Diversification across genomic services smooths revenue volatility and supports long-term valuation resilience.
Scale economics and automation
Scale economics lower unit costs as throughput and optimized batching rise; industry sequencing costs fell to about $200 per human genome by 2022 (Illumina milestone), enabling labs to spread fixed costs over higher volume. Automation cuts turn-around-time and labor intensity, improving gross margins; capital intensity demands disciplined utilization and platform mix management, while shared sequencing and informatics stacks drive economies of scope.
- Throughput-driven unit cost decline: $200/genome (2022)
- Automation: faster TAT, lower labor per test
- Capital intensity: requires utilization discipline
- Economies of scope: shared sequencing/informatics
Competitive intensity and consolidation
Large diagnostics firms, specialty labs, and hospital labs compete on menu breadth, turnaround, and payer access; Quest Diagnostics and LabCorp together hold roughly 50–60% of U.S. outpatient testing, intensifying competitive pressure. M&A bundles services and cross-selling channels, while price competition on commoditized panels raises the strategic value of proprietary assays and pushes labs toward partnerships to close distribution gaps.
- Market share: Quest/LabCorp ~50–60%
- M&A: bundles services, expands channels
- Pricing: commoditized panels under pressure
- Strategy: proprietary content + partnerships offset distribution
Medicare/Medicaid shifts, FDA LDT oversight and federal funding reshape diagnostics costs
Payer mix drives realized prices—Medicare/Medicaid ~40% below commercial rates—while reimbursement coding/prior auth (2024–25) increases revenue volatility. US unemployment 3.7% (Jun 2025) and employer coverage ~49% (KFF 2023) pressure elective genomics; CPI 3.4% (2024) raises labor/reagent costs. Sequencing cost ~ $200/genome (2022); Quest/LabCorp hold ~50–60% of outpatient testing.
| Metric | Value | Impact |
|---|---|---|
| Medicare discount | ~40% | Revenue compression |
| Unemployment | 3.7% (Jun 2025) | Elective demand |
| Employer coverage | ~49% (KFF 2023) | Insurance access |
| CPI | 3.4% (2024) | Cost pressure |
| Seq cost | $200/genome (2022) | Unit cost decline |
| Market share | 50–60% | Competitive pressure |
Preview Before You Purchase
Fulgent PESTLE Analysis
The preview shown here is the exact document you’ll receive after purchase—fully formatted and ready to use. The Fulgent PESTLE Analysis delivers concise coverage of political, economic, social, technological, legal, and environmental factors affecting Fulgent, with clear implications and strategic recommendations. No placeholders, ready to download.
Description
Your Competitive Advantage Starts with This Report
Discover how political shifts, healthcare economics, and rapid biotech innovation are shaping Fulgent’s strategic outlook in our concise PESTLE snapshot. This analysis highlights regulatory risks, market drivers, and technological opportunities for investors and strategists. Purchase the full PESTLE to get actionable, ready-to-use insights and download instantly.
Political factors
Healthcare policy and reimbursement agendas
National health priorities and budget allocations shape coverage for genetic testing across rare disease, oncology, and reproductive care; Medicare (~65M enrollees) and Medicaid (~85M) coverage decisions materially affect demand. Shifts in Medicare/Medicaid policy or single‑payer debates can expand or restrict access, altering a US genetic testing market (~$10B in 2023). Election cycles and 2024 committee leadership changes have already redirected funding streams and guideline adoption; Fulgent must track policy signals to align test menus and pricing.
Regulatory posture on laboratory-developed tests
FDA has historically exercised enforcement discretion for laboratory-developed tests since 1976, so shifts toward FDA oversight versus CLIA-only models directly affect approval timelines, validation costs, and market speed for companies like Fulgent. Tightening oversight, debated through 2024 policy proposals, would raise barriers to entry but favor large menu holders with established quality systems. Clear transitional or grandfathering provisions and policy certainty reduce compliance risk and support strategic planning.
Public funding for genomics and cancer initiatives
Government grants and national precision medicine programs—All of Us with over 600,000 participants (2024) and NIH funding near $48B in FY2024—catalyze test utilization and data partnerships. Oncology Moonshot and rare-disease initiatives, backed by targeted federal funding streams, expand addressable populations for Fulgent. Procurement preferences increasingly favor domestic capabilities in critical health tech. Fulgent can leverage consortia to accelerate evidence generation.
Trade relations and supply security
Trade tensions and export controls—notably US restrictions on advanced semiconductors and related equipment through 2022–2024—raise costs and limit availability of sequencers, reagents and chips for Fulgent, driving longer lead times and higher procurement spend. Political incentives for onshoring biomanufacturing in the US and EU create shifting supplier landscapes and potential capex-backed supply agreements. Customs delays and sanctions force higher inventory and dual-sourcing; strategic stockpiles are being adopted to hedge political shocks.
- Tariffs/export controls: tightened 2022–2024 impacting equipment access
- Onshoring: policy-driven supplier reshaping, increased domestic CAPEX
- Operational impacts: higher inventory, dual-sourcing needs
- Mitigation: strategic stockpiles to buffer supply shocks
Pandemic preparedness and public health contracts
Pandemic policy frameworks directly drive demand for infectious-disease testing capacity, with federal and state contracts producing step-change revenue during surges but often declining post-surge. Readiness rules increasingly require labs to maintain surge staffing and capital buffers to meet rapid-response windows (often 24–48 hours for priority pathogens). Flexible, multiplex platforms preserve eligibility for fast deployment under emergency contracting.
- Federal/state contracts: high revenue in surge, volatile afterward
- Readiness: surge staffing and capital reserves required
- Turnaround expectations: 24–48 hour windows
- Flexible platforms: maintain eligibility for rapid deployment
Medicare/Medicaid shifts, FDA LDT oversight and federal funding reshape diagnostics costs
Medicare (~65M) and Medicaid (~85M) reimbursement changes, FDA LDT oversight debates through 2024, and federal funding (NIH ~$48B FY2024; All of Us 600k+ participants) materially shape demand, approval costs, and partnerships for Fulgent; trade controls (2022–24) and onshoring raise equipment costs and inventory needs.
| Factor | 2024/25 Data |
|---|---|
| Medicare enrollees | ~65M |
| NIH budget FY2024 | ~$48B |
What is included in the product
Detailed Word Document
Provides a concise PESTLE evaluation of Fulgent, examining Political, Economic, Social, Technological, Environmental, and Legal forces with data-backed trends and sector-specific examples; designed to help executives, investors, and strategists identify risks, opportunities, and forward-looking scenarios.
Customizable Excel Spreadsheet
Provides a concise, visually segmented PESTLE summary of Fulgent that’s easily editable for local context and drop‑ready for presentations, enabling quick team alignment and streamlined risk discussions during planning sessions.
Economic factors
Payer mix and reimbursement rates
Commercial vs government payer shares determine realized price per test, with Medicare and Medicaid reimbursements generally about 40% lower than commercial rates, materially compressing revenue when public payers dominate. Reimbursement coding changes and expanding prior authorization rules (notably for genetic panels in 2024–25) increase volatility in revenue predictability. Strong clinical utility data supports favorable coverage decisions, while margins hinge on denials management and contract negotiation strength.
Testing volume elasticity and macro cycles
Elective genomics volumes track employment and insurance: US unemployment 3.7% (June 2025, BLS) and employer-sponsored coverage ~49% (KFF 2023) influence discretionary and fertility testing demand, which falls in recessions while oncology remains relatively stable. US CPI inflation averaged ~3.4% in 2024 (BLS), pressuring labor, reagents and logistics costs. High operating leverage in labs amplifies margin swings on revenue upturns and downturns.
Post-pandemic normalization
Post-pandemic normalization exposes Fulgent to reversion risk after elevated COVID-era revenues, making redeployment of capacity from infectious disease testing into oncology and rare-disease panels essential to stabilize top-line performance; investor expectations now center on sustainable ex-COVID growth trajectories and margin recovery. Diversification across genomic services smooths revenue volatility and supports long-term valuation resilience.
Scale economics and automation
Scale economics lower unit costs as throughput and optimized batching rise; industry sequencing costs fell to about $200 per human genome by 2022 (Illumina milestone), enabling labs to spread fixed costs over higher volume. Automation cuts turn-around-time and labor intensity, improving gross margins; capital intensity demands disciplined utilization and platform mix management, while shared sequencing and informatics stacks drive economies of scope.
- Throughput-driven unit cost decline: $200/genome (2022)
- Automation: faster TAT, lower labor per test
- Capital intensity: requires utilization discipline
- Economies of scope: shared sequencing/informatics
Competitive intensity and consolidation
Large diagnostics firms, specialty labs, and hospital labs compete on menu breadth, turnaround, and payer access; Quest Diagnostics and LabCorp together hold roughly 50–60% of U.S. outpatient testing, intensifying competitive pressure. M&A bundles services and cross-selling channels, while price competition on commoditized panels raises the strategic value of proprietary assays and pushes labs toward partnerships to close distribution gaps.
- Market share: Quest/LabCorp ~50–60%
- M&A: bundles services, expands channels
- Pricing: commoditized panels under pressure
- Strategy: proprietary content + partnerships offset distribution
Medicare/Medicaid shifts, FDA LDT oversight and federal funding reshape diagnostics costs
Payer mix drives realized prices—Medicare/Medicaid ~40% below commercial rates—while reimbursement coding/prior auth (2024–25) increases revenue volatility. US unemployment 3.7% (Jun 2025) and employer coverage ~49% (KFF 2023) pressure elective genomics; CPI 3.4% (2024) raises labor/reagent costs. Sequencing cost ~ $200/genome (2022); Quest/LabCorp hold ~50–60% of outpatient testing.
| Metric | Value | Impact |
|---|---|---|
| Medicare discount | ~40% | Revenue compression |
| Unemployment | 3.7% (Jun 2025) | Elective demand |
| Employer coverage | ~49% (KFF 2023) | Insurance access |
| CPI | 3.4% (2024) | Cost pressure |
| Seq cost | $200/genome (2022) | Unit cost decline |
| Market share | 50–60% | Competitive pressure |
Preview Before You Purchase
Fulgent PESTLE Analysis
The preview shown here is the exact document you’ll receive after purchase—fully formatted and ready to use. The Fulgent PESTLE Analysis delivers concise coverage of political, economic, social, technological, legal, and environmental factors affecting Fulgent, with clear implications and strategic recommendations. No placeholders, ready to download.











