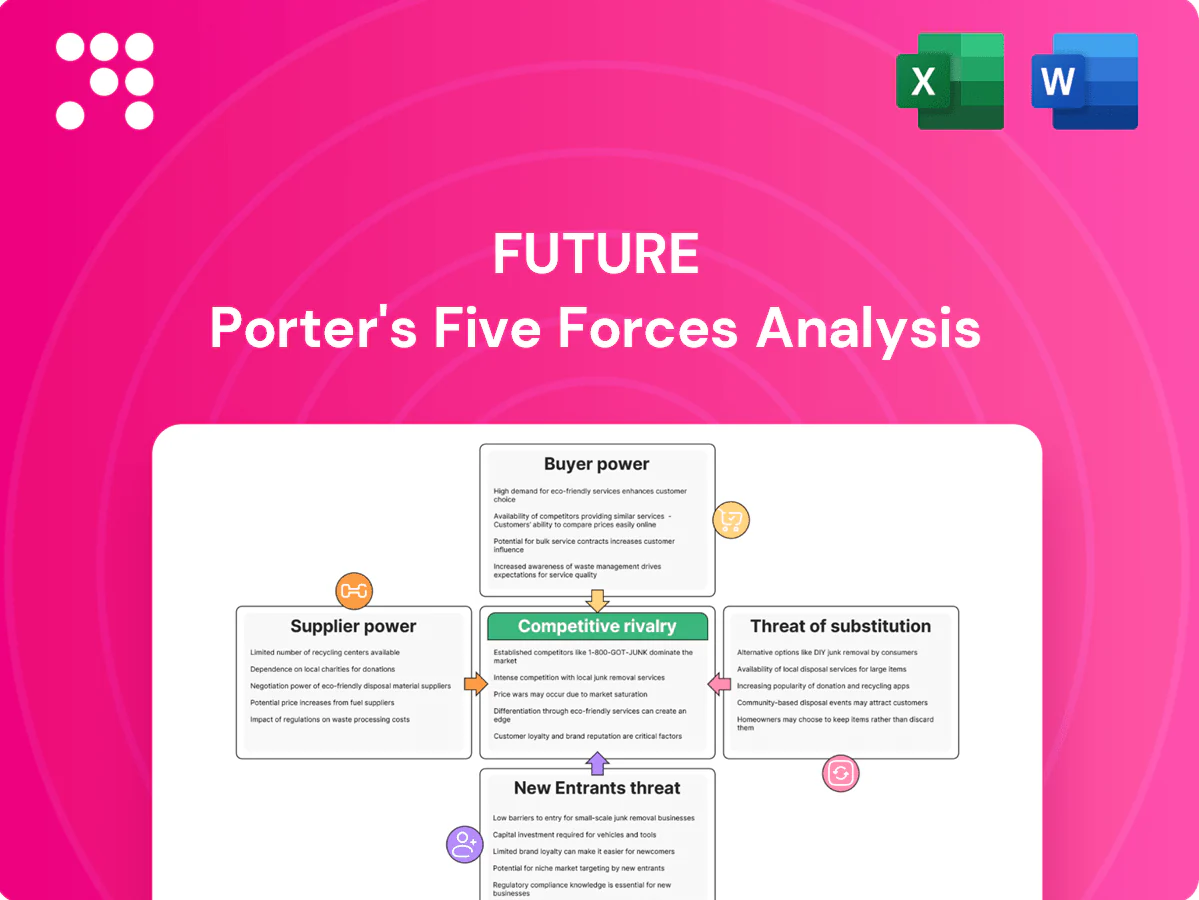
Future Porter's Five Forces Analysis

From Overview to Strategy Blueprint
This brief snapshot highlights key pressures shaping Future’s industry but only scratches the surface; the full Porter’s Five Forces Analysis maps supplier and buyer power, entrant threats, substitutes, and competitive rivalry in detail. Unlock force-by-force ratings, visuals, and strategic implications to inform investment or corporate strategy. Purchase the complete report for a consultant-grade, actionable breakdown tailored to Future.
Suppliers Bargaining Power

Platform gatekeepers leverage
Future depends on Google (≈92% global search share in 2024), Apple, Meta and Amazon for discovery, distribution and monetization. Algorithm shifts or fee rules (App Store/Play commissions typically 15–30%) can materially cut traffic and revenue share. Google+Meta control over 50% of global digital ad spend in 2024 and Amazon’s ad business is rapidly growing, giving these platforms meaningful bargaining power. Diversifying channels reduces but does not remove dependency.
Creative talent scarcity
Specialist editors, reviewers, and video creators in tech, gaming, and niche verticals are finite, feeding a creator economy estimated at roughly $250 billion in 2024. Top contributors command premium rates and flexible terms, with the top tier capturing a disproportionate share of revenue. Their reputational draw strengthens leverage around product launches and key cycles. Long-term contracts and in-house training reduce churn and cost volatility.

Printing and paper constraints
Print magazines depend on paper, ink and press capacity that have seen input-cost swings (pulp prices swung roughly 30% between 2022–2024) and spot ink surges tied to oil prices. Consolidated paper vendors and logistics disruptions have tightened leverage, allowing suppliers to push unfavorable pricing and surcharges. Volume commitments and multi-title bundling mitigate some supplier power—publishers report 10–20% better unit pricing with bundled contracts. Ongoing digital mix shift (print volumes down ~25% vs 2019) reduces exposure over time.

Ad-tech and data vendors
Ad servers, SSPs, CDPs and analytics providers shape yield and data access, and switching is costly because of integration work and limited data portability; vendors can therefore extract higher fees or bundle products. Google and Meta together command over 60% of global digital ad spend (2024), so platform control amplifies supplier leverage. Building first-party data and direct deals rebalances power for publishers and advertisers.
- Integration costs: high
- Data portability: limited
- Fees/bundles: rising
- First-party/data deals: reduce supplier power
Affiliate and commerce networks
Affiliate and commerce networks such as Amazon Associates, retail partners and SaaS affiliate platforms set commission structures (Amazon public bands ~1–10%), so rate cuts or attribution rule changes in 2023–24 have trimmed commerce revenue for many publishers by tens of percent and hit hardest in peak shopping seasons; multi‑merchant coverage and private deals can improve terms.
- Amazon Associates: ~1–10% commission bands
- Peak-season dependency: highest impact
- Mitigants: multi-merchant coverage, private deals
Platform power: search ≈92%, ads > 50%, creators ≈$250B
Platform suppliers concentrate power: Google ≈92% search share (2024), Google+Meta >50% digital ad spend (2024), Amazon ad growth pressures terms. Creator supply is finite: creator economy ≈$250B (2024) with top talent commanding premiums. Print/input volatility: pulp prices swung ~30% (2022–24); print volumes -25% vs 2019 reduces exposure.
| Supplier | Metric | 2024 |
|---|---|---|
| Search share | ≈92% | |
| Google+Meta | Ad share | >50% |
| Creator economy | Market size | ≈$250B |
What is included in the product
 Detailed Word Document
Provides a tailored Porter's Five Forces assessment for Future, uncovering competitive drivers, supplier and buyer power, threat of entrants and substitutes, and emerging disruptive forces with strategic commentary and industry data to assess pricing, profitability, and market-entry risk. Delivered in fully editable Word for easy integration into investor materials, strategy decks, or academic projects.

 Customizable Excel Spreadsheet
Future Porter's Five Forces delivers a one-sheet, no-code summary with customizable pressure levels and instant spider/radar visuals—perfect for quick decision-making, pitch decks, and scenario tabs (pre/post regulation or new entrants).
Customers Bargaining Power

Advertisers multi-home
Brand and performance advertisers routinely multi-home, allocating budgets across 4–6 publishers on average, which drives strong buyer leverage. Low switching costs and programmatic scale (about 70% of display in 2024) let advertisers demand tighter CPMs and granular targeting. Demonstrable ROI and access to unique audiences are critical to defend pricing, while direct-sold packages reduce dependence on auction volatility.
Merchants demand ROAS
Affiliate retailers and marketplaces increasingly demand ROAS, with 2024 surveys showing about 60% of merchants tying partner pay to performance; they negotiate tiers, exclusives and seasonal bonuses to hit attributable-sales targets. Transparent conversion data and platform-level attribution raise merchant leverage, while curated high-intent content can command premium CPAs and higher effective ROAS for partners.

Subscribers price sensitive
Readers can easily use free alternatives across the web and social, and paid penetration remained low—Reuters Institute found about 16% paid for online news in 2024. Churn risk rises sharply with price hikes or falling perceived value, especially in markets where substitutes are abundant. Bundling, member benefits, and ad-light experiences reduce sensitivity by boosting perceived value and retention. Deep niche coverage helps justify recurring spend by creating unique, hard-to-replace value.

Agencies control access
Agencies gate large advertiser budgets and shape channel mixes; GroupM estimates 2024 global ad spend near $900B with agencies controlling the bulk of programmatic flows, forcing demands for measurement, brand safety and favorable terms that often yield 5–10% tighter pricing for suppliers; preferred partner status unlocks volume but reduces margins while strong vertical authority improves negotiation outcomes.
- Agencies control budget allocation
- Measurement & brand safety demands
- Preferred partners get volume at tighter pricing
Retail distribution clout
Newsstands and wholesalers retain strong retail distribution clout, controlling shelf allocation and return terms; returns commonly exceed 20% in print channels and promotional fees can reach double-digit percentages. Declining print volumes (continuing into 2024) magnify per-unit leverage. Growth in direct-to-consumer and digital subscriptions in 2024 has begun to offset retail bargaining power.
- Returns often >20%
- Promotional/slotting fees: double-digit %
- Print volume decline continued in 2024, boosting per-unit leverage
- Digital/DTC subscription growth in 2024 partially offsets retail power
Programmatic dominance, agency control and ROAS-linked pay squeeze publisher margins
Advertisers multi-home (4–6 publishers) and programmatic (~70% of display in 2024) giving strong buyer leverage; agencies steer ~2024 $900B global ad spend, tightening terms. ~60% of merchants tie partner pay to ROAS, increasing retailer/marketplace pressure. Only ~16% pay for online news in 2024, raising churn risk; print returns often >20% and slotting fees are double-digit.
| Metric | 2024 Value |
|---|---|
| Programmatic share | ~70% |
| Ad spend (GroupM) | $900B |
| Merchants tying pay to ROAS | ~60% |
| Paid news penetration | ~16% |
| Print returns | >20% |
Same Document Delivered
Future Porter's Five Forces Analysis
This preview shows the Future Porter's Five Forces Analysis exactly as delivered—no placeholders or samples. The document you see is the full, professionally formatted analysis you’ll be able to download instantly after purchase. Use it immediately for strategy, valuation, or competitive planning.

From Overview to Strategy Blueprint
This brief snapshot highlights key pressures shaping Future’s industry but only scratches the surface; the full Porter’s Five Forces Analysis maps supplier and buyer power, entrant threats, substitutes, and competitive rivalry in detail. Unlock force-by-force ratings, visuals, and strategic implications to inform investment or corporate strategy. Purchase the complete report for a consultant-grade, actionable breakdown tailored to Future.
Suppliers Bargaining Power
Platform gatekeepers leverage
Future depends on Google (≈92% global search share in 2024), Apple, Meta and Amazon for discovery, distribution and monetization. Algorithm shifts or fee rules (App Store/Play commissions typically 15–30%) can materially cut traffic and revenue share. Google+Meta control over 50% of global digital ad spend in 2024 and Amazon’s ad business is rapidly growing, giving these platforms meaningful bargaining power. Diversifying channels reduces but does not remove dependency.
Creative talent scarcity
Specialist editors, reviewers, and video creators in tech, gaming, and niche verticals are finite, feeding a creator economy estimated at roughly $250 billion in 2024. Top contributors command premium rates and flexible terms, with the top tier capturing a disproportionate share of revenue. Their reputational draw strengthens leverage around product launches and key cycles. Long-term contracts and in-house training reduce churn and cost volatility.
Printing and paper constraints
Print magazines depend on paper, ink and press capacity that have seen input-cost swings (pulp prices swung roughly 30% between 2022–2024) and spot ink surges tied to oil prices. Consolidated paper vendors and logistics disruptions have tightened leverage, allowing suppliers to push unfavorable pricing and surcharges. Volume commitments and multi-title bundling mitigate some supplier power—publishers report 10–20% better unit pricing with bundled contracts. Ongoing digital mix shift (print volumes down ~25% vs 2019) reduces exposure over time.
Ad-tech and data vendors
Ad servers, SSPs, CDPs and analytics providers shape yield and data access, and switching is costly because of integration work and limited data portability; vendors can therefore extract higher fees or bundle products. Google and Meta together command over 60% of global digital ad spend (2024), so platform control amplifies supplier leverage. Building first-party data and direct deals rebalances power for publishers and advertisers.
- Integration costs: high
- Data portability: limited
- Fees/bundles: rising
- First-party/data deals: reduce supplier power
Affiliate and commerce networks
Affiliate and commerce networks such as Amazon Associates, retail partners and SaaS affiliate platforms set commission structures (Amazon public bands ~1–10%), so rate cuts or attribution rule changes in 2023–24 have trimmed commerce revenue for many publishers by tens of percent and hit hardest in peak shopping seasons; multi‑merchant coverage and private deals can improve terms.
- Amazon Associates: ~1–10% commission bands
- Peak-season dependency: highest impact
- Mitigants: multi-merchant coverage, private deals
Platform power: search ≈92%, ads > 50%, creators ≈$250B
Platform suppliers concentrate power: Google ≈92% search share (2024), Google+Meta >50% digital ad spend (2024), Amazon ad growth pressures terms. Creator supply is finite: creator economy ≈$250B (2024) with top talent commanding premiums. Print/input volatility: pulp prices swung ~30% (2022–24); print volumes -25% vs 2019 reduces exposure.
| Supplier | Metric | 2024 |
|---|---|---|
| Search share | ≈92% | |
| Google+Meta | Ad share | >50% |
| Creator economy | Market size | ≈$250B |
What is included in the product
Detailed Word Document
Provides a tailored Porter's Five Forces assessment for Future, uncovering competitive drivers, supplier and buyer power, threat of entrants and substitutes, and emerging disruptive forces with strategic commentary and industry data to assess pricing, profitability, and market-entry risk. Delivered in fully editable Word for easy integration into investor materials, strategy decks, or academic projects.
Customizable Excel Spreadsheet
Future Porter's Five Forces delivers a one-sheet, no-code summary with customizable pressure levels and instant spider/radar visuals—perfect for quick decision-making, pitch decks, and scenario tabs (pre/post regulation or new entrants).
Customers Bargaining Power
Advertisers multi-home
Brand and performance advertisers routinely multi-home, allocating budgets across 4–6 publishers on average, which drives strong buyer leverage. Low switching costs and programmatic scale (about 70% of display in 2024) let advertisers demand tighter CPMs and granular targeting. Demonstrable ROI and access to unique audiences are critical to defend pricing, while direct-sold packages reduce dependence on auction volatility.
Merchants demand ROAS
Affiliate retailers and marketplaces increasingly demand ROAS, with 2024 surveys showing about 60% of merchants tying partner pay to performance; they negotiate tiers, exclusives and seasonal bonuses to hit attributable-sales targets. Transparent conversion data and platform-level attribution raise merchant leverage, while curated high-intent content can command premium CPAs and higher effective ROAS for partners.
Subscribers price sensitive
Readers can easily use free alternatives across the web and social, and paid penetration remained low—Reuters Institute found about 16% paid for online news in 2024. Churn risk rises sharply with price hikes or falling perceived value, especially in markets where substitutes are abundant. Bundling, member benefits, and ad-light experiences reduce sensitivity by boosting perceived value and retention. Deep niche coverage helps justify recurring spend by creating unique, hard-to-replace value.
Agencies control access
Agencies gate large advertiser budgets and shape channel mixes; GroupM estimates 2024 global ad spend near $900B with agencies controlling the bulk of programmatic flows, forcing demands for measurement, brand safety and favorable terms that often yield 5–10% tighter pricing for suppliers; preferred partner status unlocks volume but reduces margins while strong vertical authority improves negotiation outcomes.
- Agencies control budget allocation
- Measurement & brand safety demands
- Preferred partners get volume at tighter pricing
Retail distribution clout
Newsstands and wholesalers retain strong retail distribution clout, controlling shelf allocation and return terms; returns commonly exceed 20% in print channels and promotional fees can reach double-digit percentages. Declining print volumes (continuing into 2024) magnify per-unit leverage. Growth in direct-to-consumer and digital subscriptions in 2024 has begun to offset retail bargaining power.
- Returns often >20%
- Promotional/slotting fees: double-digit %
- Print volume decline continued in 2024, boosting per-unit leverage
- Digital/DTC subscription growth in 2024 partially offsets retail power
Programmatic dominance, agency control and ROAS-linked pay squeeze publisher margins
Advertisers multi-home (4–6 publishers) and programmatic (~70% of display in 2024) giving strong buyer leverage; agencies steer ~2024 $900B global ad spend, tightening terms. ~60% of merchants tie partner pay to ROAS, increasing retailer/marketplace pressure. Only ~16% pay for online news in 2024, raising churn risk; print returns often >20% and slotting fees are double-digit.
| Metric | 2024 Value |
|---|---|
| Programmatic share | ~70% |
| Ad spend (GroupM) | $900B |
| Merchants tying pay to ROAS | ~60% |
| Paid news penetration | ~16% |
| Print returns | >20% |
Same Document Delivered
Future Porter's Five Forces Analysis
This preview shows the Future Porter's Five Forces Analysis exactly as delivered—no placeholders or samples. The document you see is the full, professionally formatted analysis you’ll be able to download instantly after purchase. Use it immediately for strategy, valuation, or competitive planning.
Original: $10.00
-65%$10.00
$3.50Description
From Overview to Strategy Blueprint
This brief snapshot highlights key pressures shaping Future’s industry but only scratches the surface; the full Porter’s Five Forces Analysis maps supplier and buyer power, entrant threats, substitutes, and competitive rivalry in detail. Unlock force-by-force ratings, visuals, and strategic implications to inform investment or corporate strategy. Purchase the complete report for a consultant-grade, actionable breakdown tailored to Future.
Suppliers Bargaining Power
Platform gatekeepers leverage
Future depends on Google (≈92% global search share in 2024), Apple, Meta and Amazon for discovery, distribution and monetization. Algorithm shifts or fee rules (App Store/Play commissions typically 15–30%) can materially cut traffic and revenue share. Google+Meta control over 50% of global digital ad spend in 2024 and Amazon’s ad business is rapidly growing, giving these platforms meaningful bargaining power. Diversifying channels reduces but does not remove dependency.
Creative talent scarcity
Specialist editors, reviewers, and video creators in tech, gaming, and niche verticals are finite, feeding a creator economy estimated at roughly $250 billion in 2024. Top contributors command premium rates and flexible terms, with the top tier capturing a disproportionate share of revenue. Their reputational draw strengthens leverage around product launches and key cycles. Long-term contracts and in-house training reduce churn and cost volatility.
Printing and paper constraints
Print magazines depend on paper, ink and press capacity that have seen input-cost swings (pulp prices swung roughly 30% between 2022–2024) and spot ink surges tied to oil prices. Consolidated paper vendors and logistics disruptions have tightened leverage, allowing suppliers to push unfavorable pricing and surcharges. Volume commitments and multi-title bundling mitigate some supplier power—publishers report 10–20% better unit pricing with bundled contracts. Ongoing digital mix shift (print volumes down ~25% vs 2019) reduces exposure over time.
Ad-tech and data vendors
Ad servers, SSPs, CDPs and analytics providers shape yield and data access, and switching is costly because of integration work and limited data portability; vendors can therefore extract higher fees or bundle products. Google and Meta together command over 60% of global digital ad spend (2024), so platform control amplifies supplier leverage. Building first-party data and direct deals rebalances power for publishers and advertisers.
- Integration costs: high
- Data portability: limited
- Fees/bundles: rising
- First-party/data deals: reduce supplier power
Affiliate and commerce networks
Affiliate and commerce networks such as Amazon Associates, retail partners and SaaS affiliate platforms set commission structures (Amazon public bands ~1–10%), so rate cuts or attribution rule changes in 2023–24 have trimmed commerce revenue for many publishers by tens of percent and hit hardest in peak shopping seasons; multi‑merchant coverage and private deals can improve terms.
- Amazon Associates: ~1–10% commission bands
- Peak-season dependency: highest impact
- Mitigants: multi-merchant coverage, private deals
Platform power: search ≈92%, ads > 50%, creators ≈$250B
Platform suppliers concentrate power: Google ≈92% search share (2024), Google+Meta >50% digital ad spend (2024), Amazon ad growth pressures terms. Creator supply is finite: creator economy ≈$250B (2024) with top talent commanding premiums. Print/input volatility: pulp prices swung ~30% (2022–24); print volumes -25% vs 2019 reduces exposure.
| Supplier | Metric | 2024 |
|---|---|---|
| Search share | ≈92% | |
| Google+Meta | Ad share | >50% |
| Creator economy | Market size | ≈$250B |
What is included in the product
Detailed Word Document
Provides a tailored Porter's Five Forces assessment for Future, uncovering competitive drivers, supplier and buyer power, threat of entrants and substitutes, and emerging disruptive forces with strategic commentary and industry data to assess pricing, profitability, and market-entry risk. Delivered in fully editable Word for easy integration into investor materials, strategy decks, or academic projects.
Customizable Excel Spreadsheet
Future Porter's Five Forces delivers a one-sheet, no-code summary with customizable pressure levels and instant spider/radar visuals—perfect for quick decision-making, pitch decks, and scenario tabs (pre/post regulation or new entrants).
Customers Bargaining Power
Advertisers multi-home
Brand and performance advertisers routinely multi-home, allocating budgets across 4–6 publishers on average, which drives strong buyer leverage. Low switching costs and programmatic scale (about 70% of display in 2024) let advertisers demand tighter CPMs and granular targeting. Demonstrable ROI and access to unique audiences are critical to defend pricing, while direct-sold packages reduce dependence on auction volatility.
Merchants demand ROAS
Affiliate retailers and marketplaces increasingly demand ROAS, with 2024 surveys showing about 60% of merchants tying partner pay to performance; they negotiate tiers, exclusives and seasonal bonuses to hit attributable-sales targets. Transparent conversion data and platform-level attribution raise merchant leverage, while curated high-intent content can command premium CPAs and higher effective ROAS for partners.
Subscribers price sensitive
Readers can easily use free alternatives across the web and social, and paid penetration remained low—Reuters Institute found about 16% paid for online news in 2024. Churn risk rises sharply with price hikes or falling perceived value, especially in markets where substitutes are abundant. Bundling, member benefits, and ad-light experiences reduce sensitivity by boosting perceived value and retention. Deep niche coverage helps justify recurring spend by creating unique, hard-to-replace value.
Agencies control access
Agencies gate large advertiser budgets and shape channel mixes; GroupM estimates 2024 global ad spend near $900B with agencies controlling the bulk of programmatic flows, forcing demands for measurement, brand safety and favorable terms that often yield 5–10% tighter pricing for suppliers; preferred partner status unlocks volume but reduces margins while strong vertical authority improves negotiation outcomes.
- Agencies control budget allocation
- Measurement & brand safety demands
- Preferred partners get volume at tighter pricing
Retail distribution clout
Newsstands and wholesalers retain strong retail distribution clout, controlling shelf allocation and return terms; returns commonly exceed 20% in print channels and promotional fees can reach double-digit percentages. Declining print volumes (continuing into 2024) magnify per-unit leverage. Growth in direct-to-consumer and digital subscriptions in 2024 has begun to offset retail bargaining power.
- Returns often >20%
- Promotional/slotting fees: double-digit %
- Print volume decline continued in 2024, boosting per-unit leverage
- Digital/DTC subscription growth in 2024 partially offsets retail power
Programmatic dominance, agency control and ROAS-linked pay squeeze publisher margins
Advertisers multi-home (4–6 publishers) and programmatic (~70% of display in 2024) giving strong buyer leverage; agencies steer ~2024 $900B global ad spend, tightening terms. ~60% of merchants tie partner pay to ROAS, increasing retailer/marketplace pressure. Only ~16% pay for online news in 2024, raising churn risk; print returns often >20% and slotting fees are double-digit.
| Metric | 2024 Value |
|---|---|
| Programmatic share | ~70% |
| Ad spend (GroupM) | $900B |
| Merchants tying pay to ROAS | ~60% |
| Paid news penetration | ~16% |
| Print returns | >20% |
Same Document Delivered
Future Porter's Five Forces Analysis
This preview shows the Future Porter's Five Forces Analysis exactly as delivered—no placeholders or samples. The document you see is the full, professionally formatted analysis you’ll be able to download instantly after purchase. Use it immediately for strategy, valuation, or competitive planning.











