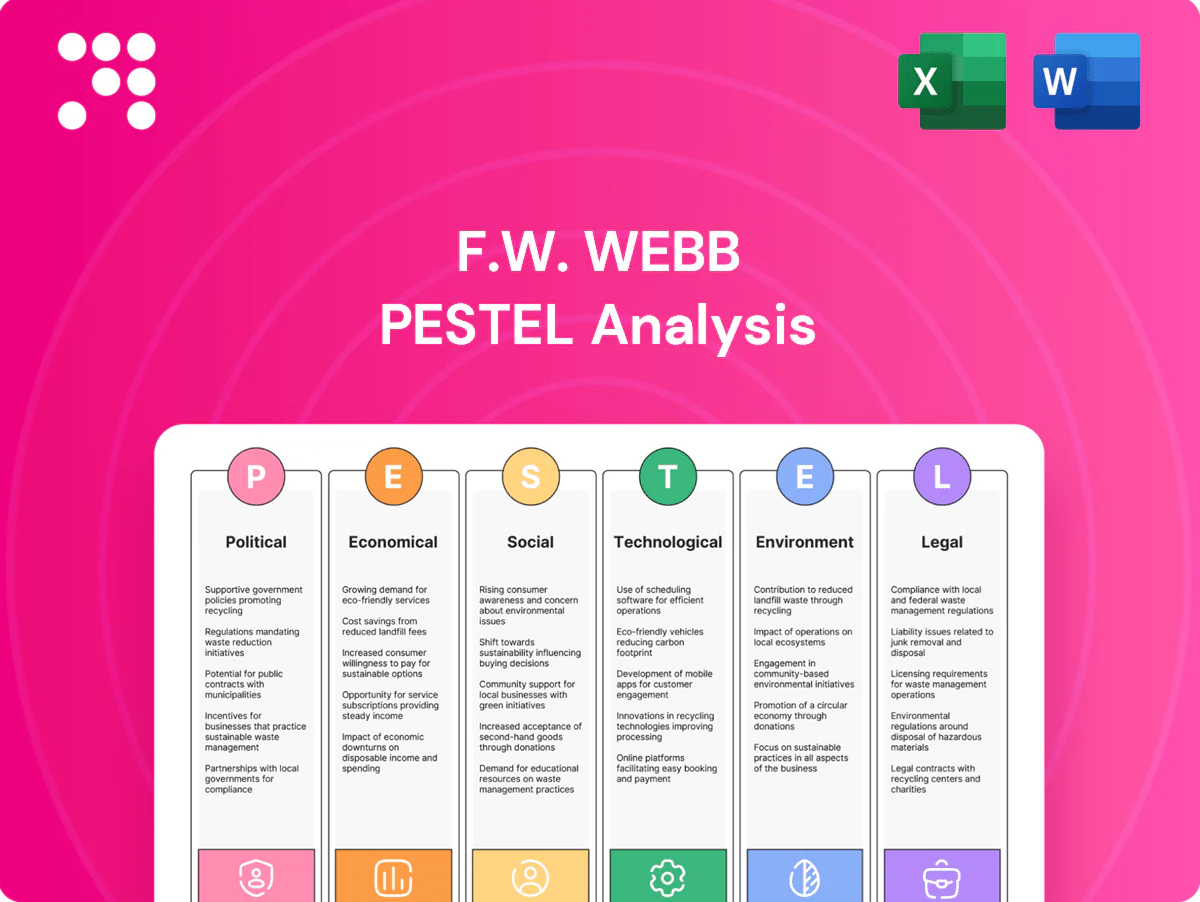
F.W. Webb PESTLE Analysis

Plan Smarter. Present Sharper. Compete Stronger.
Unlock strategic clarity with our F.W. Webb PESTLE Analysis — three to five concise insights into political, economic, social, technological, legal, and environmental forces shaping performance. Ideal for investors and strategists, this ready-to-use report highlights risks and growth levers. Purchase the full analysis to access detailed, actionable intelligence and downloadable templates today.
Political factors

Infrastructure and public spending
Public investment in water, HVAC and municipal facilities fuels steady PVF and mechanical demand; ARPA provided about $350B to state/localities and IIJA totals $1.2T (≈$550B new), sustaining project pipelines.
Northeast state capital plans create multi-year order visibility—e.g., New York's 5-year capital plan ~127B—while annual state capital budgets commonly run into the billions.
Post-election priority shifts can reallocate funds between new builds and maintenance; close monitoring of bond measures and ARPA/IIJA allocations informs branch inventory and ordering.
Trade policy and tariffs
Tariffs such as 25% Section 232 on steel and Section 301 duties up to 25% on China-origin goods raise landed costs for steel, copper, valves and HVAC components, reducing price competitiveness. Policy shifts or new actions can disrupt sourcing and lead times. Mitigations include supplier diversification, forward contracts and transparent pass-through pricing to pro customers to protect margins.

Energy incentives and rebates
Federal and state incentives — including the IRA-backed 30% residential clean energy tax credit — for heat pumps, high-efficiency boilers and building retrofits are accelerating category growth. Political support produces rebate-driven demand spikes, with US heat-pump shipments rising roughly 30% year-over-year in 2024. Programs vary by Northeast utility commission; rebates commonly range from $1,000 to $10,000. Aligning inventory and technician training with incentive calendars can lift conversion rates 10–20%.

Transportation and logistics policy
Funding for highways, ports and rail—including the Bipartisan Infrastructure Law allocations (roughly 110 billion for roads and bridges, 17 billion for ports, and 66 billion for rail)—directly affects F.W. Webb delivery reliability and freight cost volatility; trucking moves about 72% of US freight by weight. NE tolling and congestion pricing expansion (city/state programs) can change route economics, while FMCSA hours-of-service and 3.5 million CDL holders mean regulatory shifts intersect with political priorities. Scenario planning is needed to mitigate policy-driven bottlenecks and maintain service levels.
- Funding: IIJA allocations 110B / 17B / 66B
- Modal share: trucking ~72% by weight
- Workforce: ~3.5M active CDL holders
- Action: scenario planning for tolls, congestion pricing, HOS changes
Buy-American and procurement rules
Buy America/Build America provisions under the Infrastructure Investment and Jobs Act (IIJA) — $550 billion new infrastructure investment — push public projects toward domestic content, shaping F.W. Webb vendor selection and product mix for government bids; political focus on domestic manufacturing advantages compliant suppliers and requires rigorous documentation to capture a share of the US federal procurement market (over $600B annually).
- Domestic-content rules: IIJA $550B
- Federal procurement: >$600B/yr
- Supplier advantage: compliant manufacturers
- Must-have: bid-ready documentation
ARPA $350B + IIJA $550B boost municipal HVAC; IRA +30%
ARPA ~$350B and IIJA ~$1.2T (≈$550B new) sustain municipal PVF/HVAC demand; NY 5-yr cap plan ≈$127B. Tariffs (25% steel; Section 301 up to 25%) raise landed costs. IRA 30% heat-pump credit drove ~30% YoY US shipments in 2024. IIJA transport splits: Roads $110B, Ports $17B, Rail $66B; trucking ~72% modal share; ~3.5M CDL holders.
| Item | Value |
|---|---|
| ARPA | $350B |
| IIJA new | $550B |
| NY cap plan | $127B |
What is included in the product
 Detailed Word Document
Explores how macro-environmental factors uniquely affect F.W. Webb across Political, Economic, Social, Technological, Environmental, and Legal dimensions, each backed by data and current trends to identify threats and opportunities for executives, consultants, and investors; region- and industry-specific insights are delivered in clean, actionable formatting with forward-looking recommendations for scenario planning and strategic decision-making.

 Customizable Excel Spreadsheet
A concise, visually segmented PESTLE summary for F.W. Webb that can be dropped into presentations, shared across teams, and annotated with region- or business-specific notes to streamline planning and external risk discussions.
Economic factors

Construction cycle sensitivity
U.S. housing starts ran around 1.4 million in 2024 (U.S. Census Bureau), and nonresidential construction put-in-place exceeded $900 billion, making housing starts, commercial buildouts and industrial CAPEX clear drivers of F.W. Webb order volumes. The Northeast’s renovation-heavy market—where home improvement activity remained resilient versus new starts—provides counter-cyclical stability. Diversification across residential, commercial and industrial reduces revenue volatility. Proactive demand forecasting improves inventory turns through cycles.
Commodity price volatility
Steel, copper and resin swings materially move PVF and HVAC pricing and margins; as of Q2 2025 US hot-rolled coil averaged about $920/ton, LME copper near $9,100/ton and US resin indices were roughly 12% higher year-over-year, pressuring input costs. Indexed pricing and hedging reduce shock exposure by tying customer contracts to market indices and futures. Rapid repricing tools are essential to deliver timely quotes to contractors and engineers and protect margins. Close supplier collaboration improves availability and helps lock favorable lead times and terms.

Interest rates and financing
With the Fed funds target at roughly 5.25–5.50% and 30-year mortgage rates near 6.7% (June 2025), higher rates are damping new construction but favoring retrofit and renovation activity. Customer financing programs for contractors and facility managers help sustain F.W. Webb sales despite tighter credit. Broader inventory across branches increases working-capital costs; strict cash discipline and dynamic purchasing lower carrying costs.

Labor availability and wage pressure
Skilled trades shortages lengthen project timelines and change order patterns; 2024 AGC survey found 86% of contractors had difficulty hiring craft workers. Construction wages rose about 5% YoY in 2024, increasing demand for labor-saving products. Driver and warehouse pay inflation (roughly 8–10% lift since 2021) raises operating expenses. Value-added services and training help customers mitigate labor gaps.
- Trades shortage: 86% hiring difficulty (AGC 2024)
- Construction wages: +5% YoY (2024)
- Driver/warehouse pay: +8–10% since 2021
- Offset: training and value-added services
Fuel and freight costs
Diesel price volatility (U.S. retail diesel ~3.90/gal June 2025, EIA) and regional transport rates directly raise F.W. Webb delivery fees and affect route efficiency; carriers deploy flexible fuel surcharges and optimized dispatch to absorb short-term spikes. Dense Northeast branch coverage cuts last-mile costs materially, while telematics and load planning (8–12% fuel/idle savings reported) protect margins.
- Diesel (Jun 2025): ~3.90/gal (EIA)
- Flexible surcharges: standard industry response
- Last-mile cut: dense branches reduce costs (~15–25%)
- Telematics/load planning savings: ~8–12%
ARPA $350B + IIJA $550B boost municipal HVAC; IRA +30%
Housing starts ~1.4M (2024) and renovation resilience drive order mix; Fed funds ~5.25–5.50% and 30y mortgage ~6.7% (Jun 2025) shift demand to retrofits; input costs (HRC ~$920/t, copper ~$9,100/t, resin +12% YoY) and diesel ~$3.90/gal (Jun 2025) compress margins; dense NE branches and pricing/hedging mitigate volatility.
| Metric | Value | Impact |
|---|---|---|
| Housing starts | 1.4M (2024) | Order volume |
| Fed/30y | 5.25–5.50% / 6.7% | Retrofits↑ |
| HRC/Cu/Resin | $920/t / $9,100/t / +12% | Cost pressure |
| Diesel | $3.90/gal | Logistics cost |
Full Version Awaits
F.W. Webb PESTLE Analysis
The F.W. Webb PESTLE Analysis preview shown here is the exact document you’ll receive after purchase—fully formatted and ready to use. This snapshot reflects the final structure, content, and professional layout with no placeholders or teasers. After checkout you’ll instantly download the same completed file illustrated in the preview.

Plan Smarter. Present Sharper. Compete Stronger.
Unlock strategic clarity with our F.W. Webb PESTLE Analysis — three to five concise insights into political, economic, social, technological, legal, and environmental forces shaping performance. Ideal for investors and strategists, this ready-to-use report highlights risks and growth levers. Purchase the full analysis to access detailed, actionable intelligence and downloadable templates today.
Political factors
Infrastructure and public spending
Public investment in water, HVAC and municipal facilities fuels steady PVF and mechanical demand; ARPA provided about $350B to state/localities and IIJA totals $1.2T (≈$550B new), sustaining project pipelines.
Northeast state capital plans create multi-year order visibility—e.g., New York's 5-year capital plan ~127B—while annual state capital budgets commonly run into the billions.
Post-election priority shifts can reallocate funds between new builds and maintenance; close monitoring of bond measures and ARPA/IIJA allocations informs branch inventory and ordering.
Trade policy and tariffs
Tariffs such as 25% Section 232 on steel and Section 301 duties up to 25% on China-origin goods raise landed costs for steel, copper, valves and HVAC components, reducing price competitiveness. Policy shifts or new actions can disrupt sourcing and lead times. Mitigations include supplier diversification, forward contracts and transparent pass-through pricing to pro customers to protect margins.
Energy incentives and rebates
Federal and state incentives — including the IRA-backed 30% residential clean energy tax credit — for heat pumps, high-efficiency boilers and building retrofits are accelerating category growth. Political support produces rebate-driven demand spikes, with US heat-pump shipments rising roughly 30% year-over-year in 2024. Programs vary by Northeast utility commission; rebates commonly range from $1,000 to $10,000. Aligning inventory and technician training with incentive calendars can lift conversion rates 10–20%.
Transportation and logistics policy
Funding for highways, ports and rail—including the Bipartisan Infrastructure Law allocations (roughly 110 billion for roads and bridges, 17 billion for ports, and 66 billion for rail)—directly affects F.W. Webb delivery reliability and freight cost volatility; trucking moves about 72% of US freight by weight. NE tolling and congestion pricing expansion (city/state programs) can change route economics, while FMCSA hours-of-service and 3.5 million CDL holders mean regulatory shifts intersect with political priorities. Scenario planning is needed to mitigate policy-driven bottlenecks and maintain service levels.
- Funding: IIJA allocations 110B / 17B / 66B
- Modal share: trucking ~72% by weight
- Workforce: ~3.5M active CDL holders
- Action: scenario planning for tolls, congestion pricing, HOS changes
Buy-American and procurement rules
Buy America/Build America provisions under the Infrastructure Investment and Jobs Act (IIJA) — $550 billion new infrastructure investment — push public projects toward domestic content, shaping F.W. Webb vendor selection and product mix for government bids; political focus on domestic manufacturing advantages compliant suppliers and requires rigorous documentation to capture a share of the US federal procurement market (over $600B annually).
- Domestic-content rules: IIJA $550B
- Federal procurement: >$600B/yr
- Supplier advantage: compliant manufacturers
- Must-have: bid-ready documentation
ARPA $350B + IIJA $550B boost municipal HVAC; IRA +30%
ARPA ~$350B and IIJA ~$1.2T (≈$550B new) sustain municipal PVF/HVAC demand; NY 5-yr cap plan ≈$127B. Tariffs (25% steel; Section 301 up to 25%) raise landed costs. IRA 30% heat-pump credit drove ~30% YoY US shipments in 2024. IIJA transport splits: Roads $110B, Ports $17B, Rail $66B; trucking ~72% modal share; ~3.5M CDL holders.
| Item | Value |
|---|---|
| ARPA | $350B |
| IIJA new | $550B |
| NY cap plan | $127B |
What is included in the product
Detailed Word Document
Explores how macro-environmental factors uniquely affect F.W. Webb across Political, Economic, Social, Technological, Environmental, and Legal dimensions, each backed by data and current trends to identify threats and opportunities for executives, consultants, and investors; region- and industry-specific insights are delivered in clean, actionable formatting with forward-looking recommendations for scenario planning and strategic decision-making.
Customizable Excel Spreadsheet
A concise, visually segmented PESTLE summary for F.W. Webb that can be dropped into presentations, shared across teams, and annotated with region- or business-specific notes to streamline planning and external risk discussions.
Economic factors
Construction cycle sensitivity
U.S. housing starts ran around 1.4 million in 2024 (U.S. Census Bureau), and nonresidential construction put-in-place exceeded $900 billion, making housing starts, commercial buildouts and industrial CAPEX clear drivers of F.W. Webb order volumes. The Northeast’s renovation-heavy market—where home improvement activity remained resilient versus new starts—provides counter-cyclical stability. Diversification across residential, commercial and industrial reduces revenue volatility. Proactive demand forecasting improves inventory turns through cycles.
Commodity price volatility
Steel, copper and resin swings materially move PVF and HVAC pricing and margins; as of Q2 2025 US hot-rolled coil averaged about $920/ton, LME copper near $9,100/ton and US resin indices were roughly 12% higher year-over-year, pressuring input costs. Indexed pricing and hedging reduce shock exposure by tying customer contracts to market indices and futures. Rapid repricing tools are essential to deliver timely quotes to contractors and engineers and protect margins. Close supplier collaboration improves availability and helps lock favorable lead times and terms.
Interest rates and financing
With the Fed funds target at roughly 5.25–5.50% and 30-year mortgage rates near 6.7% (June 2025), higher rates are damping new construction but favoring retrofit and renovation activity. Customer financing programs for contractors and facility managers help sustain F.W. Webb sales despite tighter credit. Broader inventory across branches increases working-capital costs; strict cash discipline and dynamic purchasing lower carrying costs.
Labor availability and wage pressure
Skilled trades shortages lengthen project timelines and change order patterns; 2024 AGC survey found 86% of contractors had difficulty hiring craft workers. Construction wages rose about 5% YoY in 2024, increasing demand for labor-saving products. Driver and warehouse pay inflation (roughly 8–10% lift since 2021) raises operating expenses. Value-added services and training help customers mitigate labor gaps.
- Trades shortage: 86% hiring difficulty (AGC 2024)
- Construction wages: +5% YoY (2024)
- Driver/warehouse pay: +8–10% since 2021
- Offset: training and value-added services
Fuel and freight costs
Diesel price volatility (U.S. retail diesel ~3.90/gal June 2025, EIA) and regional transport rates directly raise F.W. Webb delivery fees and affect route efficiency; carriers deploy flexible fuel surcharges and optimized dispatch to absorb short-term spikes. Dense Northeast branch coverage cuts last-mile costs materially, while telematics and load planning (8–12% fuel/idle savings reported) protect margins.
- Diesel (Jun 2025): ~3.90/gal (EIA)
- Flexible surcharges: standard industry response
- Last-mile cut: dense branches reduce costs (~15–25%)
- Telematics/load planning savings: ~8–12%
ARPA $350B + IIJA $550B boost municipal HVAC; IRA +30%
Housing starts ~1.4M (2024) and renovation resilience drive order mix; Fed funds ~5.25–5.50% and 30y mortgage ~6.7% (Jun 2025) shift demand to retrofits; input costs (HRC ~$920/t, copper ~$9,100/t, resin +12% YoY) and diesel ~$3.90/gal (Jun 2025) compress margins; dense NE branches and pricing/hedging mitigate volatility.
| Metric | Value | Impact |
|---|---|---|
| Housing starts | 1.4M (2024) | Order volume |
| Fed/30y | 5.25–5.50% / 6.7% | Retrofits↑ |
| HRC/Cu/Resin | $920/t / $9,100/t / +12% | Cost pressure |
| Diesel | $3.90/gal | Logistics cost |
Full Version Awaits
F.W. Webb PESTLE Analysis
The F.W. Webb PESTLE Analysis preview shown here is the exact document you’ll receive after purchase—fully formatted and ready to use. This snapshot reflects the final structure, content, and professional layout with no placeholders or teasers. After checkout you’ll instantly download the same completed file illustrated in the preview.
Original: $10.00
-65%$10.00
$3.50Description
Plan Smarter. Present Sharper. Compete Stronger.
Unlock strategic clarity with our F.W. Webb PESTLE Analysis — three to five concise insights into political, economic, social, technological, legal, and environmental forces shaping performance. Ideal for investors and strategists, this ready-to-use report highlights risks and growth levers. Purchase the full analysis to access detailed, actionable intelligence and downloadable templates today.
Political factors
Infrastructure and public spending
Public investment in water, HVAC and municipal facilities fuels steady PVF and mechanical demand; ARPA provided about $350B to state/localities and IIJA totals $1.2T (≈$550B new), sustaining project pipelines.
Northeast state capital plans create multi-year order visibility—e.g., New York's 5-year capital plan ~127B—while annual state capital budgets commonly run into the billions.
Post-election priority shifts can reallocate funds between new builds and maintenance; close monitoring of bond measures and ARPA/IIJA allocations informs branch inventory and ordering.
Trade policy and tariffs
Tariffs such as 25% Section 232 on steel and Section 301 duties up to 25% on China-origin goods raise landed costs for steel, copper, valves and HVAC components, reducing price competitiveness. Policy shifts or new actions can disrupt sourcing and lead times. Mitigations include supplier diversification, forward contracts and transparent pass-through pricing to pro customers to protect margins.
Energy incentives and rebates
Federal and state incentives — including the IRA-backed 30% residential clean energy tax credit — for heat pumps, high-efficiency boilers and building retrofits are accelerating category growth. Political support produces rebate-driven demand spikes, with US heat-pump shipments rising roughly 30% year-over-year in 2024. Programs vary by Northeast utility commission; rebates commonly range from $1,000 to $10,000. Aligning inventory and technician training with incentive calendars can lift conversion rates 10–20%.
Transportation and logistics policy
Funding for highways, ports and rail—including the Bipartisan Infrastructure Law allocations (roughly 110 billion for roads and bridges, 17 billion for ports, and 66 billion for rail)—directly affects F.W. Webb delivery reliability and freight cost volatility; trucking moves about 72% of US freight by weight. NE tolling and congestion pricing expansion (city/state programs) can change route economics, while FMCSA hours-of-service and 3.5 million CDL holders mean regulatory shifts intersect with political priorities. Scenario planning is needed to mitigate policy-driven bottlenecks and maintain service levels.
- Funding: IIJA allocations 110B / 17B / 66B
- Modal share: trucking ~72% by weight
- Workforce: ~3.5M active CDL holders
- Action: scenario planning for tolls, congestion pricing, HOS changes
Buy-American and procurement rules
Buy America/Build America provisions under the Infrastructure Investment and Jobs Act (IIJA) — $550 billion new infrastructure investment — push public projects toward domestic content, shaping F.W. Webb vendor selection and product mix for government bids; political focus on domestic manufacturing advantages compliant suppliers and requires rigorous documentation to capture a share of the US federal procurement market (over $600B annually).
- Domestic-content rules: IIJA $550B
- Federal procurement: >$600B/yr
- Supplier advantage: compliant manufacturers
- Must-have: bid-ready documentation
ARPA $350B + IIJA $550B boost municipal HVAC; IRA +30%
ARPA ~$350B and IIJA ~$1.2T (≈$550B new) sustain municipal PVF/HVAC demand; NY 5-yr cap plan ≈$127B. Tariffs (25% steel; Section 301 up to 25%) raise landed costs. IRA 30% heat-pump credit drove ~30% YoY US shipments in 2024. IIJA transport splits: Roads $110B, Ports $17B, Rail $66B; trucking ~72% modal share; ~3.5M CDL holders.
| Item | Value |
|---|---|
| ARPA | $350B |
| IIJA new | $550B |
| NY cap plan | $127B |
What is included in the product
Detailed Word Document
Explores how macro-environmental factors uniquely affect F.W. Webb across Political, Economic, Social, Technological, Environmental, and Legal dimensions, each backed by data and current trends to identify threats and opportunities for executives, consultants, and investors; region- and industry-specific insights are delivered in clean, actionable formatting with forward-looking recommendations for scenario planning and strategic decision-making.
Customizable Excel Spreadsheet
A concise, visually segmented PESTLE summary for F.W. Webb that can be dropped into presentations, shared across teams, and annotated with region- or business-specific notes to streamline planning and external risk discussions.
Economic factors
Construction cycle sensitivity
U.S. housing starts ran around 1.4 million in 2024 (U.S. Census Bureau), and nonresidential construction put-in-place exceeded $900 billion, making housing starts, commercial buildouts and industrial CAPEX clear drivers of F.W. Webb order volumes. The Northeast’s renovation-heavy market—where home improvement activity remained resilient versus new starts—provides counter-cyclical stability. Diversification across residential, commercial and industrial reduces revenue volatility. Proactive demand forecasting improves inventory turns through cycles.
Commodity price volatility
Steel, copper and resin swings materially move PVF and HVAC pricing and margins; as of Q2 2025 US hot-rolled coil averaged about $920/ton, LME copper near $9,100/ton and US resin indices were roughly 12% higher year-over-year, pressuring input costs. Indexed pricing and hedging reduce shock exposure by tying customer contracts to market indices and futures. Rapid repricing tools are essential to deliver timely quotes to contractors and engineers and protect margins. Close supplier collaboration improves availability and helps lock favorable lead times and terms.
Interest rates and financing
With the Fed funds target at roughly 5.25–5.50% and 30-year mortgage rates near 6.7% (June 2025), higher rates are damping new construction but favoring retrofit and renovation activity. Customer financing programs for contractors and facility managers help sustain F.W. Webb sales despite tighter credit. Broader inventory across branches increases working-capital costs; strict cash discipline and dynamic purchasing lower carrying costs.
Labor availability and wage pressure
Skilled trades shortages lengthen project timelines and change order patterns; 2024 AGC survey found 86% of contractors had difficulty hiring craft workers. Construction wages rose about 5% YoY in 2024, increasing demand for labor-saving products. Driver and warehouse pay inflation (roughly 8–10% lift since 2021) raises operating expenses. Value-added services and training help customers mitigate labor gaps.
- Trades shortage: 86% hiring difficulty (AGC 2024)
- Construction wages: +5% YoY (2024)
- Driver/warehouse pay: +8–10% since 2021
- Offset: training and value-added services
Fuel and freight costs
Diesel price volatility (U.S. retail diesel ~3.90/gal June 2025, EIA) and regional transport rates directly raise F.W. Webb delivery fees and affect route efficiency; carriers deploy flexible fuel surcharges and optimized dispatch to absorb short-term spikes. Dense Northeast branch coverage cuts last-mile costs materially, while telematics and load planning (8–12% fuel/idle savings reported) protect margins.
- Diesel (Jun 2025): ~3.90/gal (EIA)
- Flexible surcharges: standard industry response
- Last-mile cut: dense branches reduce costs (~15–25%)
- Telematics/load planning savings: ~8–12%
ARPA $350B + IIJA $550B boost municipal HVAC; IRA +30%
Housing starts ~1.4M (2024) and renovation resilience drive order mix; Fed funds ~5.25–5.50% and 30y mortgage ~6.7% (Jun 2025) shift demand to retrofits; input costs (HRC ~$920/t, copper ~$9,100/t, resin +12% YoY) and diesel ~$3.90/gal (Jun 2025) compress margins; dense NE branches and pricing/hedging mitigate volatility.
| Metric | Value | Impact |
|---|---|---|
| Housing starts | 1.4M (2024) | Order volume |
| Fed/30y | 5.25–5.50% / 6.7% | Retrofits↑ |
| HRC/Cu/Resin | $920/t / $9,100/t / +12% | Cost pressure |
| Diesel | $3.90/gal | Logistics cost |
Full Version Awaits
F.W. Webb PESTLE Analysis
The F.W. Webb PESTLE Analysis preview shown here is the exact document you’ll receive after purchase—fully formatted and ready to use. This snapshot reflects the final structure, content, and professional layout with no placeholders or teasers. After checkout you’ll instantly download the same completed file illustrated in the preview.











