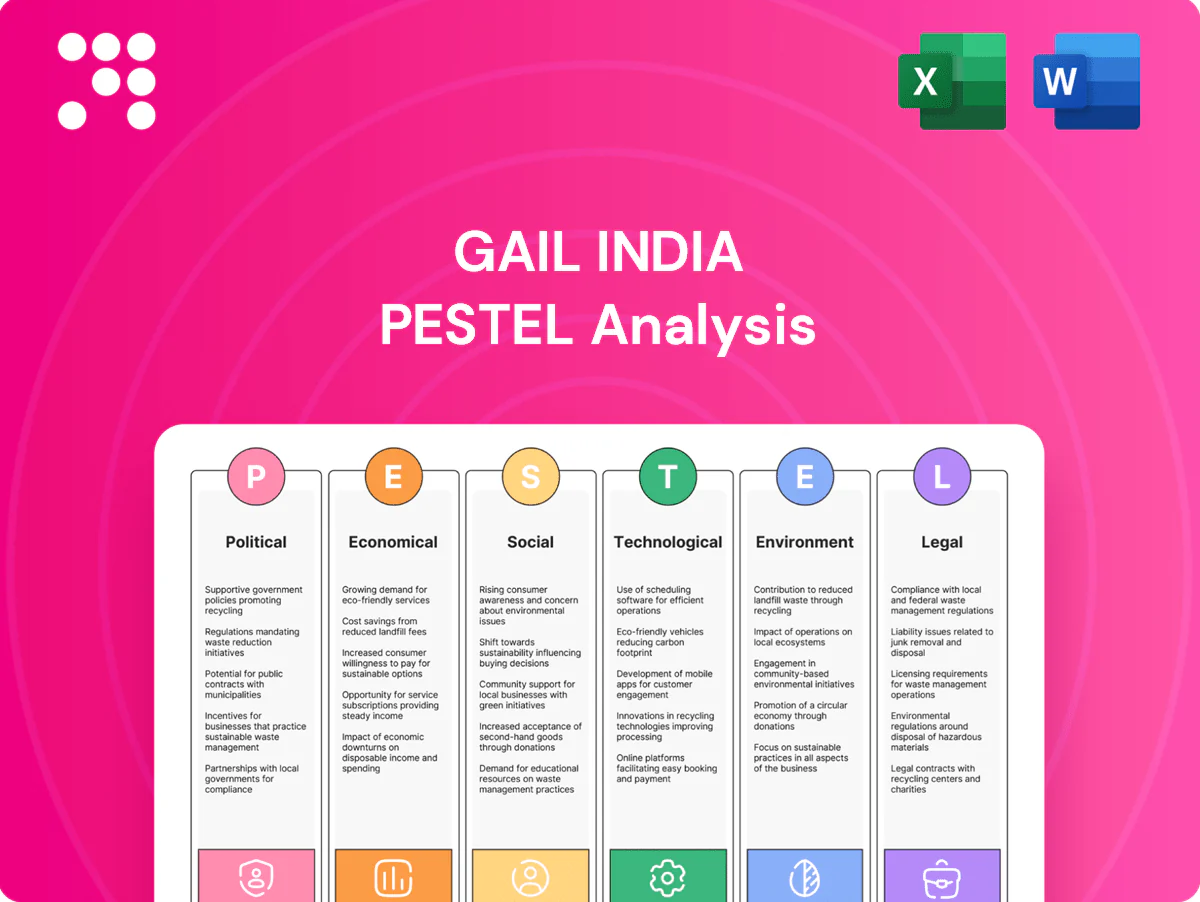
GAIL India PESTLE Analysis

Your Competitive Advantage Starts with This Report
Discover how political shifts, economic trends, and regulatory changes shape GAIL India's growth and risk profile. Our concise PESTLE highlights energy transition, infrastructure priorities, and environmental and legal exposures to inform investment and strategy decisions. Ready-made and actionable, it's ideal for analysts and planners. Purchase the full report for the complete, editable breakdown.
Political factors

Energy policy and gas prioritization
India’s push to raise natural gas from about 6.3% of primary energy (2022) to a 15% target by 2030 and the rapid CGD rollout (over 9 million PNG/CNG connections by 2024) directly shape GAIL’s volumes and tariff leverage. Government prioritization of fertilizer, CGD and power influences allocation and pool-pricing, impacting merchant tariffs. Changes to subsidy regimes or policy continuity can swing demand and pipeline economics, while stable policy underpins multi-year capex and network expansion planning.
State and central coordination
GAIL’s pipeline network traverses multiple states, requiring permits, right-of-way clearances and sustained local cooperation; alignment between central and state governments speeds approvals while political misalignment causes project delays and cost escalation. The 2024 general election cycle notably slowed approvals and disbursements in several states, illustrating how federal dynamics directly raise execution risk and extend project timelines.

Geopolitics and gas sourcing
GAILs imported LNG exposure ties it directly to global geopolitics, sanctions regimes and maritime chokepoints as most volumes are sourced under long‑term agreements from suppliers including Qatar and the US. Those long‑term contracts hinge on diplomatic stability and can face rerouting or renegotiation during tensions. Regional conflicts can disrupt supply chains or spike charter rates and freight costs. Diversifying supplier base and routes reduces geopolitical shock.

Public sector governance
As a government-influenced enterprise, GAIL balances policy-driven mandates with commercial goals; recent directives on dividend distribution and strategic capex prioritisation have redirected capital toward pipeline and strategic gasification projects, sometimes at the expense of short-term returns. Governance reforms from DIPAM aim to boost efficiency but increase compliance and reporting overhead; policy-driven projects often pursue social or strategic objectives beyond pure commercial returns.
- Government ownership: policy influence on capital allocation
- Dividend/capex directives: prioritise strategic pipelines over near-term ROE
- Reforms: efficiency gains vs higher compliance
- Policy projects: non-commercial objectives and fiscal support
Infrastructure and transition agendas
India targets raising gas share from about 6.2% (FY2022–23) to roughly 15% by 2030, underpinning GAIL’s pipeline demand against its ~14,000 km network; CGD expansion and fiscal incentives boost volumes, while government backing of green hydrogen and bio-CNG (National Green Hydrogen Mission launched 2023) creates new adjacencies; Atmanirbhar procurement rules shift sourcing to domestic suppliers; cross-border pipelines remain subject to political feasibility.
- gas-share-target: 15% by 2030 vs 6.2% now
- GAIL-pipeline-length: ~14,000 km
- policy-adjacencies: green hydrogen, bio-CNG
- sourcing: Atmanirbhar domestic push
- risk: cross-border pipelines hinge on geopolitics
India aims 15% gas by 2030; LNG sourcing and permits drive pipeline growth
India’s 15% gas-share target by 2030 (vs ~6.2% in FY2022–23) plus >9m PNG/CNG connections by 2024 boost GAIL volume prospects. State-centre alignment affects permits and ROW; 2024 election delays highlighted execution risk. LNG sourcing (long‑term contracts with Qatar/US) ties GAIL to geopolitics and freight volatility. Government ownership and dividend/capex directives steer capital to strategic pipelines over short-term ROE.
| Metric | Value | Note |
|---|---|---|
| Gas share | 15% target by 2030 | ~6.2% in FY2022–23 |
| Pipeline | ~14,000 km | GAIL network |
| PNG/CNG | >9m by 2024 | CGD rollout |
What is included in the product
 Detailed Word Document
Explores how external macro-environmental factors uniquely affect GAIL India across Political, Economic, Social, Technological, Environmental and Legal dimensions; each section is data‑backed, includes forward‑looking insights and scenario implications to help executives, consultants and investors identify threats, opportunities and strategic actions.

 Customizable Excel Spreadsheet
A clean, summarized PESTLE of GAIL India for easy referencing in meetings or presentations, visually segmented by political, economic, social, technological, legal and environmental factors to speed interpretation and stakeholder alignment.
Economic factors

LNG price volatility
Volatile spot LNG prices — JKM spiking to ~70 USD/MMBtu in 2022 then easing to roughly 10–12 USD/MMBtu by 2024 — compress GAIL marketing margins and affect end-user affordability. Sustained high prices can curb industrial offtake and raise under-recovery risks for regulated gas sales. Hedging and a mix of long-term contracts reduce but do not remove exposure; stable prices support higher pipeline utilization and petrochemical spreads.
Industrial demand and GDP growth
Gas demand for GAIL closely tracks growth in power, fertilizer, refining and MSMEs, with IMF projecting India GDP at 6.8% in 2025; economic slowdowns therefore cut offtake and pipeline throughput. Strong capex cycles in steel, cement and chemicals materially boost industrial gas usage. Urbanization (about 35% urban population) and rapid CGD expansion underpin resilient, annuity-like demand.

Exchange rate and inflation
USD-INR averaged around 82–83 in 2024–25, raising LNG import costs, dollar debt servicing and equipment capex for GAIL as volumes remain imported in USD. Inflation in India ran near 5–6% in 2024, lifting EPC and O&M costs and pressuring regulated returns. Tariff revisions and take-or-pay clauses can partially offset pass-through. Effective cost control and index-linked contracts help preserve margins.

Capital intensity and financing
Pipelines, petrochemicals and renewables are highly capital‑intensive for GAIL, needing long‑tenor funding that makes project IRRs sensitive to interest‑rate cycles; RBI policy rate stood at 6.5% in mid‑2025, tightening WACC and refinancing costs. Access to bond markets and multilateral lenders materially aids execution and risk allocation. Maintaining balanced leverage is critical to sustain growth and dividend capacity.
- Long tenor funding required
- Rate sensitivity (RBI repo 6.5% mid‑2025)
- Bond/multilateral access supports execution
- Balanced leverage preserves dividends
Petrochemical cycle
Petrochemical cycle: polymer prices and cracker margins are cyclical and driven by global demand; global polymer demand is ~400 million tonnes/year, making feedstock spreads and overcapacity key drivers of volatility. Integration with gas-based feedstock gives GAIL cost advantage versus naphtha crackers, while moves into renewables and gas trading help smooth earnings and reduce margin cyclicality.
- Polymer demand ~400 Mt/yr
- Overcapacity raises margin volatility
- Gas feed integration lowers feed costs
- Diversification into renewables/gas trading stabilizes earnings
India aims 15% gas by 2030; LNG sourcing and permits drive pipeline growth
GAIL margins and LNG import costs remain sensitive to volatile JKM (≈70 USD/MMBtu in 2022 → 10–12 USD/MMBtu by 2024), USD‑INR ~82–83 in 2024–25 and RBI repo ~6.5% mid‑2025; GDP growth (IMF 2025 India GDP 6.8%) and industrial capex drive pipeline throughput while polymer demand (~400 Mt/yr) affects petrochemical spreads.
| Indicator | Value |
|---|---|
| India GDP 2025 (IMF) | 6.8% |
| USD‑INR 2024–25 | 82–83 |
| RBI repo mid‑2025 | 6.5% |
| JKM 2022 / 2024 | ~70 / 10–12 USD/MMBtu |
| Polymer demand | ~400 Mt/yr |
Preview the Actual Deliverable
GAIL India PESTLE Analysis
The preview shown here is the exact GAIL India PESTLE Analysis document you’ll receive after purchase—fully formatted, professionally structured, and ready to use. What you see is the final file with no placeholders or teasers. After payment you’ll be able to download this identical document instantly.

Your Competitive Advantage Starts with This Report
Discover how political shifts, economic trends, and regulatory changes shape GAIL India's growth and risk profile. Our concise PESTLE highlights energy transition, infrastructure priorities, and environmental and legal exposures to inform investment and strategy decisions. Ready-made and actionable, it's ideal for analysts and planners. Purchase the full report for the complete, editable breakdown.
Political factors
Energy policy and gas prioritization
India’s push to raise natural gas from about 6.3% of primary energy (2022) to a 15% target by 2030 and the rapid CGD rollout (over 9 million PNG/CNG connections by 2024) directly shape GAIL’s volumes and tariff leverage. Government prioritization of fertilizer, CGD and power influences allocation and pool-pricing, impacting merchant tariffs. Changes to subsidy regimes or policy continuity can swing demand and pipeline economics, while stable policy underpins multi-year capex and network expansion planning.
State and central coordination
GAIL’s pipeline network traverses multiple states, requiring permits, right-of-way clearances and sustained local cooperation; alignment between central and state governments speeds approvals while political misalignment causes project delays and cost escalation. The 2024 general election cycle notably slowed approvals and disbursements in several states, illustrating how federal dynamics directly raise execution risk and extend project timelines.
Geopolitics and gas sourcing
GAILs imported LNG exposure ties it directly to global geopolitics, sanctions regimes and maritime chokepoints as most volumes are sourced under long‑term agreements from suppliers including Qatar and the US. Those long‑term contracts hinge on diplomatic stability and can face rerouting or renegotiation during tensions. Regional conflicts can disrupt supply chains or spike charter rates and freight costs. Diversifying supplier base and routes reduces geopolitical shock.
Public sector governance
As a government-influenced enterprise, GAIL balances policy-driven mandates with commercial goals; recent directives on dividend distribution and strategic capex prioritisation have redirected capital toward pipeline and strategic gasification projects, sometimes at the expense of short-term returns. Governance reforms from DIPAM aim to boost efficiency but increase compliance and reporting overhead; policy-driven projects often pursue social or strategic objectives beyond pure commercial returns.
- Government ownership: policy influence on capital allocation
- Dividend/capex directives: prioritise strategic pipelines over near-term ROE
- Reforms: efficiency gains vs higher compliance
- Policy projects: non-commercial objectives and fiscal support
Infrastructure and transition agendas
India targets raising gas share from about 6.2% (FY2022–23) to roughly 15% by 2030, underpinning GAIL’s pipeline demand against its ~14,000 km network; CGD expansion and fiscal incentives boost volumes, while government backing of green hydrogen and bio-CNG (National Green Hydrogen Mission launched 2023) creates new adjacencies; Atmanirbhar procurement rules shift sourcing to domestic suppliers; cross-border pipelines remain subject to political feasibility.
- gas-share-target: 15% by 2030 vs 6.2% now
- GAIL-pipeline-length: ~14,000 km
- policy-adjacencies: green hydrogen, bio-CNG
- sourcing: Atmanirbhar domestic push
- risk: cross-border pipelines hinge on geopolitics
India aims 15% gas by 2030; LNG sourcing and permits drive pipeline growth
India’s 15% gas-share target by 2030 (vs ~6.2% in FY2022–23) plus >9m PNG/CNG connections by 2024 boost GAIL volume prospects. State-centre alignment affects permits and ROW; 2024 election delays highlighted execution risk. LNG sourcing (long‑term contracts with Qatar/US) ties GAIL to geopolitics and freight volatility. Government ownership and dividend/capex directives steer capital to strategic pipelines over short-term ROE.
| Metric | Value | Note |
|---|---|---|
| Gas share | 15% target by 2030 | ~6.2% in FY2022–23 |
| Pipeline | ~14,000 km | GAIL network |
| PNG/CNG | >9m by 2024 | CGD rollout |
What is included in the product
Detailed Word Document
Explores how external macro-environmental factors uniquely affect GAIL India across Political, Economic, Social, Technological, Environmental and Legal dimensions; each section is data‑backed, includes forward‑looking insights and scenario implications to help executives, consultants and investors identify threats, opportunities and strategic actions.
Customizable Excel Spreadsheet
A clean, summarized PESTLE of GAIL India for easy referencing in meetings or presentations, visually segmented by political, economic, social, technological, legal and environmental factors to speed interpretation and stakeholder alignment.
Economic factors
LNG price volatility
Volatile spot LNG prices — JKM spiking to ~70 USD/MMBtu in 2022 then easing to roughly 10–12 USD/MMBtu by 2024 — compress GAIL marketing margins and affect end-user affordability. Sustained high prices can curb industrial offtake and raise under-recovery risks for regulated gas sales. Hedging and a mix of long-term contracts reduce but do not remove exposure; stable prices support higher pipeline utilization and petrochemical spreads.
Industrial demand and GDP growth
Gas demand for GAIL closely tracks growth in power, fertilizer, refining and MSMEs, with IMF projecting India GDP at 6.8% in 2025; economic slowdowns therefore cut offtake and pipeline throughput. Strong capex cycles in steel, cement and chemicals materially boost industrial gas usage. Urbanization (about 35% urban population) and rapid CGD expansion underpin resilient, annuity-like demand.
Exchange rate and inflation
USD-INR averaged around 82–83 in 2024–25, raising LNG import costs, dollar debt servicing and equipment capex for GAIL as volumes remain imported in USD. Inflation in India ran near 5–6% in 2024, lifting EPC and O&M costs and pressuring regulated returns. Tariff revisions and take-or-pay clauses can partially offset pass-through. Effective cost control and index-linked contracts help preserve margins.
Capital intensity and financing
Pipelines, petrochemicals and renewables are highly capital‑intensive for GAIL, needing long‑tenor funding that makes project IRRs sensitive to interest‑rate cycles; RBI policy rate stood at 6.5% in mid‑2025, tightening WACC and refinancing costs. Access to bond markets and multilateral lenders materially aids execution and risk allocation. Maintaining balanced leverage is critical to sustain growth and dividend capacity.
- Long tenor funding required
- Rate sensitivity (RBI repo 6.5% mid‑2025)
- Bond/multilateral access supports execution
- Balanced leverage preserves dividends
Petrochemical cycle
Petrochemical cycle: polymer prices and cracker margins are cyclical and driven by global demand; global polymer demand is ~400 million tonnes/year, making feedstock spreads and overcapacity key drivers of volatility. Integration with gas-based feedstock gives GAIL cost advantage versus naphtha crackers, while moves into renewables and gas trading help smooth earnings and reduce margin cyclicality.
- Polymer demand ~400 Mt/yr
- Overcapacity raises margin volatility
- Gas feed integration lowers feed costs
- Diversification into renewables/gas trading stabilizes earnings
India aims 15% gas by 2030; LNG sourcing and permits drive pipeline growth
GAIL margins and LNG import costs remain sensitive to volatile JKM (≈70 USD/MMBtu in 2022 → 10–12 USD/MMBtu by 2024), USD‑INR ~82–83 in 2024–25 and RBI repo ~6.5% mid‑2025; GDP growth (IMF 2025 India GDP 6.8%) and industrial capex drive pipeline throughput while polymer demand (~400 Mt/yr) affects petrochemical spreads.
| Indicator | Value |
|---|---|
| India GDP 2025 (IMF) | 6.8% |
| USD‑INR 2024–25 | 82–83 |
| RBI repo mid‑2025 | 6.5% |
| JKM 2022 / 2024 | ~70 / 10–12 USD/MMBtu |
| Polymer demand | ~400 Mt/yr |
Preview the Actual Deliverable
GAIL India PESTLE Analysis
The preview shown here is the exact GAIL India PESTLE Analysis document you’ll receive after purchase—fully formatted, professionally structured, and ready to use. What you see is the final file with no placeholders or teasers. After payment you’ll be able to download this identical document instantly.
Original: $10.00
-65%$10.00
$3.50Description
Your Competitive Advantage Starts with This Report
Discover how political shifts, economic trends, and regulatory changes shape GAIL India's growth and risk profile. Our concise PESTLE highlights energy transition, infrastructure priorities, and environmental and legal exposures to inform investment and strategy decisions. Ready-made and actionable, it's ideal for analysts and planners. Purchase the full report for the complete, editable breakdown.
Political factors
Energy policy and gas prioritization
India’s push to raise natural gas from about 6.3% of primary energy (2022) to a 15% target by 2030 and the rapid CGD rollout (over 9 million PNG/CNG connections by 2024) directly shape GAIL’s volumes and tariff leverage. Government prioritization of fertilizer, CGD and power influences allocation and pool-pricing, impacting merchant tariffs. Changes to subsidy regimes or policy continuity can swing demand and pipeline economics, while stable policy underpins multi-year capex and network expansion planning.
State and central coordination
GAIL’s pipeline network traverses multiple states, requiring permits, right-of-way clearances and sustained local cooperation; alignment between central and state governments speeds approvals while political misalignment causes project delays and cost escalation. The 2024 general election cycle notably slowed approvals and disbursements in several states, illustrating how federal dynamics directly raise execution risk and extend project timelines.
Geopolitics and gas sourcing
GAILs imported LNG exposure ties it directly to global geopolitics, sanctions regimes and maritime chokepoints as most volumes are sourced under long‑term agreements from suppliers including Qatar and the US. Those long‑term contracts hinge on diplomatic stability and can face rerouting or renegotiation during tensions. Regional conflicts can disrupt supply chains or spike charter rates and freight costs. Diversifying supplier base and routes reduces geopolitical shock.
Public sector governance
As a government-influenced enterprise, GAIL balances policy-driven mandates with commercial goals; recent directives on dividend distribution and strategic capex prioritisation have redirected capital toward pipeline and strategic gasification projects, sometimes at the expense of short-term returns. Governance reforms from DIPAM aim to boost efficiency but increase compliance and reporting overhead; policy-driven projects often pursue social or strategic objectives beyond pure commercial returns.
- Government ownership: policy influence on capital allocation
- Dividend/capex directives: prioritise strategic pipelines over near-term ROE
- Reforms: efficiency gains vs higher compliance
- Policy projects: non-commercial objectives and fiscal support
Infrastructure and transition agendas
India targets raising gas share from about 6.2% (FY2022–23) to roughly 15% by 2030, underpinning GAIL’s pipeline demand against its ~14,000 km network; CGD expansion and fiscal incentives boost volumes, while government backing of green hydrogen and bio-CNG (National Green Hydrogen Mission launched 2023) creates new adjacencies; Atmanirbhar procurement rules shift sourcing to domestic suppliers; cross-border pipelines remain subject to political feasibility.
- gas-share-target: 15% by 2030 vs 6.2% now
- GAIL-pipeline-length: ~14,000 km
- policy-adjacencies: green hydrogen, bio-CNG
- sourcing: Atmanirbhar domestic push
- risk: cross-border pipelines hinge on geopolitics
India aims 15% gas by 2030; LNG sourcing and permits drive pipeline growth
India’s 15% gas-share target by 2030 (vs ~6.2% in FY2022–23) plus >9m PNG/CNG connections by 2024 boost GAIL volume prospects. State-centre alignment affects permits and ROW; 2024 election delays highlighted execution risk. LNG sourcing (long‑term contracts with Qatar/US) ties GAIL to geopolitics and freight volatility. Government ownership and dividend/capex directives steer capital to strategic pipelines over short-term ROE.
| Metric | Value | Note |
|---|---|---|
| Gas share | 15% target by 2030 | ~6.2% in FY2022–23 |
| Pipeline | ~14,000 km | GAIL network |
| PNG/CNG | >9m by 2024 | CGD rollout |
What is included in the product
Detailed Word Document
Explores how external macro-environmental factors uniquely affect GAIL India across Political, Economic, Social, Technological, Environmental and Legal dimensions; each section is data‑backed, includes forward‑looking insights and scenario implications to help executives, consultants and investors identify threats, opportunities and strategic actions.
Customizable Excel Spreadsheet
A clean, summarized PESTLE of GAIL India for easy referencing in meetings or presentations, visually segmented by political, economic, social, technological, legal and environmental factors to speed interpretation and stakeholder alignment.
Economic factors
LNG price volatility
Volatile spot LNG prices — JKM spiking to ~70 USD/MMBtu in 2022 then easing to roughly 10–12 USD/MMBtu by 2024 — compress GAIL marketing margins and affect end-user affordability. Sustained high prices can curb industrial offtake and raise under-recovery risks for regulated gas sales. Hedging and a mix of long-term contracts reduce but do not remove exposure; stable prices support higher pipeline utilization and petrochemical spreads.
Industrial demand and GDP growth
Gas demand for GAIL closely tracks growth in power, fertilizer, refining and MSMEs, with IMF projecting India GDP at 6.8% in 2025; economic slowdowns therefore cut offtake and pipeline throughput. Strong capex cycles in steel, cement and chemicals materially boost industrial gas usage. Urbanization (about 35% urban population) and rapid CGD expansion underpin resilient, annuity-like demand.
Exchange rate and inflation
USD-INR averaged around 82–83 in 2024–25, raising LNG import costs, dollar debt servicing and equipment capex for GAIL as volumes remain imported in USD. Inflation in India ran near 5–6% in 2024, lifting EPC and O&M costs and pressuring regulated returns. Tariff revisions and take-or-pay clauses can partially offset pass-through. Effective cost control and index-linked contracts help preserve margins.
Capital intensity and financing
Pipelines, petrochemicals and renewables are highly capital‑intensive for GAIL, needing long‑tenor funding that makes project IRRs sensitive to interest‑rate cycles; RBI policy rate stood at 6.5% in mid‑2025, tightening WACC and refinancing costs. Access to bond markets and multilateral lenders materially aids execution and risk allocation. Maintaining balanced leverage is critical to sustain growth and dividend capacity.
- Long tenor funding required
- Rate sensitivity (RBI repo 6.5% mid‑2025)
- Bond/multilateral access supports execution
- Balanced leverage preserves dividends
Petrochemical cycle
Petrochemical cycle: polymer prices and cracker margins are cyclical and driven by global demand; global polymer demand is ~400 million tonnes/year, making feedstock spreads and overcapacity key drivers of volatility. Integration with gas-based feedstock gives GAIL cost advantage versus naphtha crackers, while moves into renewables and gas trading help smooth earnings and reduce margin cyclicality.
- Polymer demand ~400 Mt/yr
- Overcapacity raises margin volatility
- Gas feed integration lowers feed costs
- Diversification into renewables/gas trading stabilizes earnings
India aims 15% gas by 2030; LNG sourcing and permits drive pipeline growth
GAIL margins and LNG import costs remain sensitive to volatile JKM (≈70 USD/MMBtu in 2022 → 10–12 USD/MMBtu by 2024), USD‑INR ~82–83 in 2024–25 and RBI repo ~6.5% mid‑2025; GDP growth (IMF 2025 India GDP 6.8%) and industrial capex drive pipeline throughput while polymer demand (~400 Mt/yr) affects petrochemical spreads.
| Indicator | Value |
|---|---|
| India GDP 2025 (IMF) | 6.8% |
| USD‑INR 2024–25 | 82–83 |
| RBI repo mid‑2025 | 6.5% |
| JKM 2022 / 2024 | ~70 / 10–12 USD/MMBtu |
| Polymer demand | ~400 Mt/yr |
Preview the Actual Deliverable
GAIL India PESTLE Analysis
The preview shown here is the exact GAIL India PESTLE Analysis document you’ll receive after purchase—fully formatted, professionally structured, and ready to use. What you see is the final file with no placeholders or teasers. After payment you’ll be able to download this identical document instantly.











