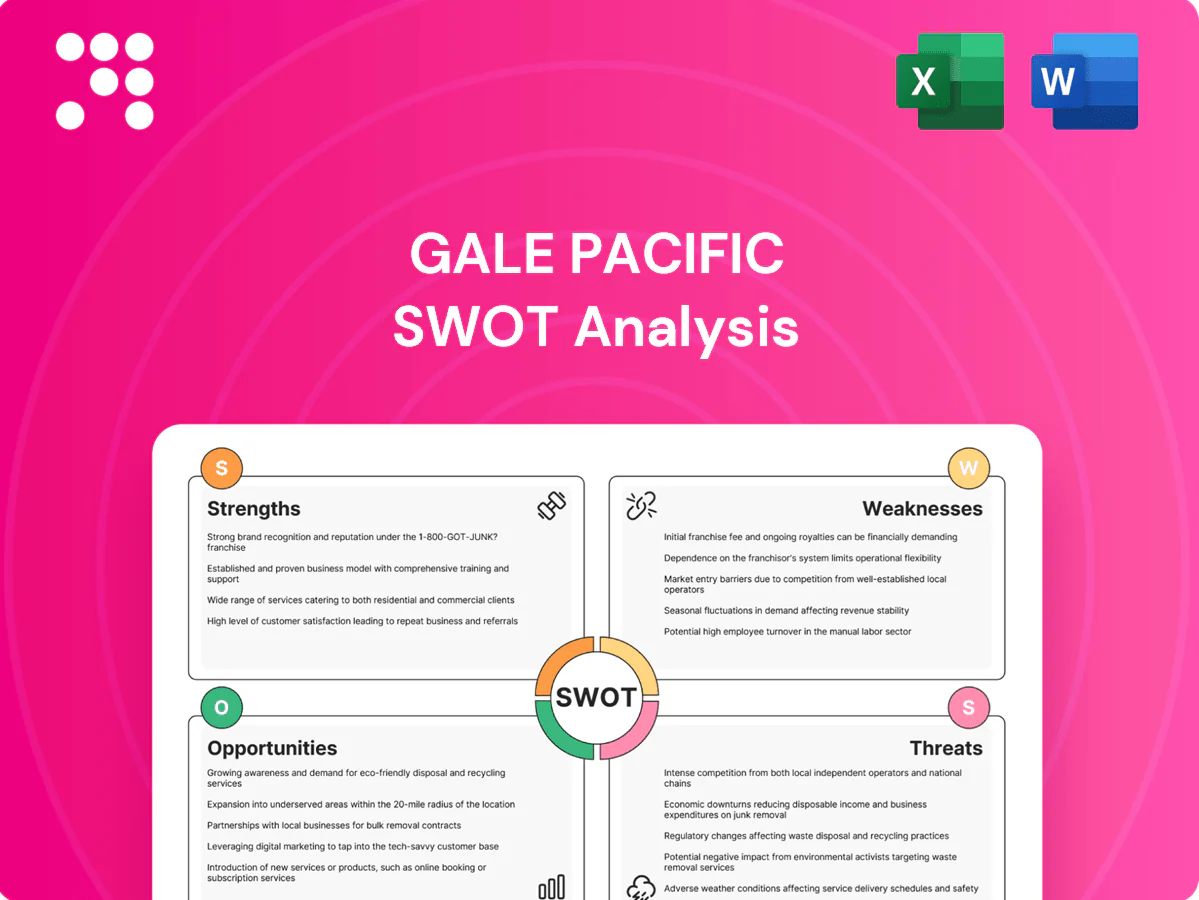
Gale Pacific SWOT Analysis

Elevate Your Analysis with the Complete SWOT Report
Gale Pacific’s SWOT analysis outlines its core strengths in innovative materials, geographic reach, and distribution channels, balanced against competitive pressures and commodity risks; it highlights growth drivers like sustainable product demand and expanding infrastructure markets. Want the full strategic picture? Purchase the complete SWOT to receive a research-backed, editable Word report plus an Excel matrix for investment and planning.
Strengths

Diversified fabric portfolio
Gale Pacific, an ASX-listed manufacturer operating in over 70 countries, spans shade cloths, screening, synthetic turf and architectural textiles, reducing reliance on any single product line. This breadth enables cross-selling into residential, commercial and industrial segments and bolsters resilience against seasonal or sectoral demand swings. A wide catalog helps defend shelf space with retailers and specifiers, including Bunnings and major distributors.
Sun-protection brand positioning
Gale Pacific’s core value proposition centers on UV protection, privacy and outdoor comfort—needs that persist across climates and user segments. Clear functional benefits make it easier to communicate ROI to homeowners and facilities managers. This focus supports premium pricing on performance SKUs and aligns with health narratives in hot, high-UV regions; in Australia 2 in 3 people will be diagnosed with skin cancer by age 70 (Skin Cancer Foundation).

Global manufacturing footprint
Gale Pacifics global manufacturing footprint enables proximity to customers and faster fulfillment, supporting FY2024 group sales of AUD 204.6m and reducing lead times across regions. It mitigates single-country supply and currency concentration risks by diversifying production. Regional plants tailor products to local codes and climates, while scale across markets boosts procurement leverage on polymers and additives, lowering input cost volatility.

Channel reach in retail and trade
Gale Pacific serves DIY retail, professional installers and architectural specifiers, giving products broad end-market relevance; multichannel access spreads demand and raises market visibility while diversifying margin mix between retail and project sales, and broader routes-to-market shorten payback on product development.
- Channels: DIY / Trade / Specifiers
- Benefit: demand spread + visibility
- Finance: diversified margin mix
- R&D: faster payback via routes-to-market
Application versatility
Gale Pacifics range from shade sails and gazebos to blinds and screens lets the company serve projects from small patios to commercial facades, supporting system selling (fabric plus hardware and fittings) and boosting win rates across project sizes; the business operates in over 80 countries.
- Application versatility
- System selling (fabric + hardware)
- Patio to facade coverage
- Supports adjacent outdoor living entry
Global fabrics group posts AUD 204.6m FY24, ASX-listed cross-sell strength
Gale Pacific, ASX-listed, operates in 80+ countries and reported FY2024 revenue AUD 204.6m, reducing single-market exposure. Its broad product mix (shade, turf, architectural fabrics) enables cross-selling across DIY, trade and specifier channels and supports system selling. Global manufacturing footprint shortens lead times and improves procurement leverage on polymers.
| Metric | Value |
|---|---|
| FY2024 revenue | AUD 204.6m |
| Geographic reach | 80+ countries |
| Channels | DIY / Trade / Specifiers |
What is included in the product
 Detailed Word Document
Provides a concise strategic overview of Gale Pacific’s internal strengths and weaknesses and external opportunities and threats, mapping key growth drivers, operational gaps, and market risks to inform strategic decision-making.

 Customizable Excel Spreadsheet
Delivers a concise SWOT matrix tailored to Gale Pacific for rapid strategic clarity and stakeholder alignment, with an editable format that lets teams quickly update insights as market conditions change.
Weaknesses

Polymer input dependency
Many advanced fabrics rely on petrochemical-derived fibers and coatings, with synthetic fibers accounting for about 69% of global fiber production in 2023, exposing margins to resin-price volatility. Spot polypropylene and polyethylene saw swings exceeding 40% during 2020–2022, directly pressuring input costs and gross margins. Periodic polymer supply tightness has also extended lead times by several weeks, complicating fulfilment and sustainability positioning.
Exposure to weather seasonality
Outdoor living spend clusters in warm seasons and renovation cycles, concentrating demand into peak quarters and magnifying revenue volatility for Gale Pacific. Seasonality strains working capital and manufacturing planning as production must scale for short windows while smoothing off-season capacity. Retail sell-through variability during peak months can trigger discounting, eroding margins. Inventory risk rises sharply on weather anomalies that shorten selling seasons.

Project specification lag
Architectural fabric adoption for Gale Pacific (ASX: GAP) is tied to specification cycles and approvals, often spanning 12–24 months, slowing uptake. Long specification-driven sales cycles defer revenue recognition and cash conversion. Small spec losses can create underutilization in specialized manufacturing lines, while high technical support requirements add overhead and depress win rates.

Brand fragmentation risk
Serving DIY, trade and industrial customers risks diluting Gale Pacifics brand message as price/value cues and product positioning diverge across segments; different buyer needs complicate portfolio architecture and product roadmaps. Overlapping SKUs can confuse distributors and inflate inventory carrying costs, while marketing spend must stretch across digital, trade and B2B channels, reducing efficiency.
- Segment misalignment: weak unified brand
- SKU overlap: distributor confusion, higher inventory
- Marketing stretch: lower ROI across channels
Hardware and install reliance
End-product performance often hinges on fittings, frames and installer skill, so inconsistent installation partners can directly impact perceived quality and brand reputation. Limited post-sale control increases exposure to warranty claims and service costs, while the added complexity of professional installation deters some DIY consumers and narrows market reach.
- Dependence on external installers
- Inconsistent perceived quality
- Higher post-sale warranty risk
- Reduced appeal to DIY segment
Resin volatility and seasonal demand squeeze margins amid 12-24 month spec lag
Gale Pacific faces input-cost exposure as synthetic fibers made ~69% of global supply in 2023 and polymer spot swings exceeded 40% in 2020–22, pressuring margins. Demand seasonality concentrates sales into peak quarters, creating revenue volatility and inventory risk. Architectural spec cycles of 12–24 months slow revenue conversion and installer dependence raises warranty/service costs.
| Weakness | Key metric |
|---|---|
| Resin/fiber exposure | >40% spot swings; 69% synthetic share |
| Seasonality | Peak-quarter revenue concentration |
| Spec cycles | 12–24 months |
| Installer dependence | Higher warranty/service cost |
Preview the Actual Deliverable
Gale Pacific SWOT Analysis
This is the actual SWOT analysis document you’ll receive upon purchase—no surprises, just professional quality. The preview below is taken directly from the full SWOT report you'll get, and the complete, editable version is unlocked after checkout. You’re viewing a live preview of the real file; buy now to access the full, detailed Gale Pacific SWOT analysis.

Elevate Your Analysis with the Complete SWOT Report
Gale Pacific’s SWOT analysis outlines its core strengths in innovative materials, geographic reach, and distribution channels, balanced against competitive pressures and commodity risks; it highlights growth drivers like sustainable product demand and expanding infrastructure markets. Want the full strategic picture? Purchase the complete SWOT to receive a research-backed, editable Word report plus an Excel matrix for investment and planning.
Strengths
Diversified fabric portfolio
Gale Pacific, an ASX-listed manufacturer operating in over 70 countries, spans shade cloths, screening, synthetic turf and architectural textiles, reducing reliance on any single product line. This breadth enables cross-selling into residential, commercial and industrial segments and bolsters resilience against seasonal or sectoral demand swings. A wide catalog helps defend shelf space with retailers and specifiers, including Bunnings and major distributors.
Sun-protection brand positioning
Gale Pacific’s core value proposition centers on UV protection, privacy and outdoor comfort—needs that persist across climates and user segments. Clear functional benefits make it easier to communicate ROI to homeowners and facilities managers. This focus supports premium pricing on performance SKUs and aligns with health narratives in hot, high-UV regions; in Australia 2 in 3 people will be diagnosed with skin cancer by age 70 (Skin Cancer Foundation).
Global manufacturing footprint
Gale Pacifics global manufacturing footprint enables proximity to customers and faster fulfillment, supporting FY2024 group sales of AUD 204.6m and reducing lead times across regions. It mitigates single-country supply and currency concentration risks by diversifying production. Regional plants tailor products to local codes and climates, while scale across markets boosts procurement leverage on polymers and additives, lowering input cost volatility.
Channel reach in retail and trade
Gale Pacific serves DIY retail, professional installers and architectural specifiers, giving products broad end-market relevance; multichannel access spreads demand and raises market visibility while diversifying margin mix between retail and project sales, and broader routes-to-market shorten payback on product development.
- Channels: DIY / Trade / Specifiers
- Benefit: demand spread + visibility
- Finance: diversified margin mix
- R&D: faster payback via routes-to-market
Application versatility
Gale Pacifics range from shade sails and gazebos to blinds and screens lets the company serve projects from small patios to commercial facades, supporting system selling (fabric plus hardware and fittings) and boosting win rates across project sizes; the business operates in over 80 countries.
- Application versatility
- System selling (fabric + hardware)
- Patio to facade coverage
- Supports adjacent outdoor living entry
Global fabrics group posts AUD 204.6m FY24, ASX-listed cross-sell strength
Gale Pacific, ASX-listed, operates in 80+ countries and reported FY2024 revenue AUD 204.6m, reducing single-market exposure. Its broad product mix (shade, turf, architectural fabrics) enables cross-selling across DIY, trade and specifier channels and supports system selling. Global manufacturing footprint shortens lead times and improves procurement leverage on polymers.
| Metric | Value |
|---|---|
| FY2024 revenue | AUD 204.6m |
| Geographic reach | 80+ countries |
| Channels | DIY / Trade / Specifiers |
What is included in the product
Detailed Word Document
Provides a concise strategic overview of Gale Pacific’s internal strengths and weaknesses and external opportunities and threats, mapping key growth drivers, operational gaps, and market risks to inform strategic decision-making.
Customizable Excel Spreadsheet
Delivers a concise SWOT matrix tailored to Gale Pacific for rapid strategic clarity and stakeholder alignment, with an editable format that lets teams quickly update insights as market conditions change.
Weaknesses
Polymer input dependency
Many advanced fabrics rely on petrochemical-derived fibers and coatings, with synthetic fibers accounting for about 69% of global fiber production in 2023, exposing margins to resin-price volatility. Spot polypropylene and polyethylene saw swings exceeding 40% during 2020–2022, directly pressuring input costs and gross margins. Periodic polymer supply tightness has also extended lead times by several weeks, complicating fulfilment and sustainability positioning.
Exposure to weather seasonality
Outdoor living spend clusters in warm seasons and renovation cycles, concentrating demand into peak quarters and magnifying revenue volatility for Gale Pacific. Seasonality strains working capital and manufacturing planning as production must scale for short windows while smoothing off-season capacity. Retail sell-through variability during peak months can trigger discounting, eroding margins. Inventory risk rises sharply on weather anomalies that shorten selling seasons.
Project specification lag
Architectural fabric adoption for Gale Pacific (ASX: GAP) is tied to specification cycles and approvals, often spanning 12–24 months, slowing uptake. Long specification-driven sales cycles defer revenue recognition and cash conversion. Small spec losses can create underutilization in specialized manufacturing lines, while high technical support requirements add overhead and depress win rates.
Brand fragmentation risk
Serving DIY, trade and industrial customers risks diluting Gale Pacifics brand message as price/value cues and product positioning diverge across segments; different buyer needs complicate portfolio architecture and product roadmaps. Overlapping SKUs can confuse distributors and inflate inventory carrying costs, while marketing spend must stretch across digital, trade and B2B channels, reducing efficiency.
- Segment misalignment: weak unified brand
- SKU overlap: distributor confusion, higher inventory
- Marketing stretch: lower ROI across channels
Hardware and install reliance
End-product performance often hinges on fittings, frames and installer skill, so inconsistent installation partners can directly impact perceived quality and brand reputation. Limited post-sale control increases exposure to warranty claims and service costs, while the added complexity of professional installation deters some DIY consumers and narrows market reach.
- Dependence on external installers
- Inconsistent perceived quality
- Higher post-sale warranty risk
- Reduced appeal to DIY segment
Resin volatility and seasonal demand squeeze margins amid 12-24 month spec lag
Gale Pacific faces input-cost exposure as synthetic fibers made ~69% of global supply in 2023 and polymer spot swings exceeded 40% in 2020–22, pressuring margins. Demand seasonality concentrates sales into peak quarters, creating revenue volatility and inventory risk. Architectural spec cycles of 12–24 months slow revenue conversion and installer dependence raises warranty/service costs.
| Weakness | Key metric |
|---|---|
| Resin/fiber exposure | >40% spot swings; 69% synthetic share |
| Seasonality | Peak-quarter revenue concentration |
| Spec cycles | 12–24 months |
| Installer dependence | Higher warranty/service cost |
Preview the Actual Deliverable
Gale Pacific SWOT Analysis
This is the actual SWOT analysis document you’ll receive upon purchase—no surprises, just professional quality. The preview below is taken directly from the full SWOT report you'll get, and the complete, editable version is unlocked after checkout. You’re viewing a live preview of the real file; buy now to access the full, detailed Gale Pacific SWOT analysis.
Original: $10.00
-65%$10.00
$3.50Description
Elevate Your Analysis with the Complete SWOT Report
Gale Pacific’s SWOT analysis outlines its core strengths in innovative materials, geographic reach, and distribution channels, balanced against competitive pressures and commodity risks; it highlights growth drivers like sustainable product demand and expanding infrastructure markets. Want the full strategic picture? Purchase the complete SWOT to receive a research-backed, editable Word report plus an Excel matrix for investment and planning.
Strengths
Diversified fabric portfolio
Gale Pacific, an ASX-listed manufacturer operating in over 70 countries, spans shade cloths, screening, synthetic turf and architectural textiles, reducing reliance on any single product line. This breadth enables cross-selling into residential, commercial and industrial segments and bolsters resilience against seasonal or sectoral demand swings. A wide catalog helps defend shelf space with retailers and specifiers, including Bunnings and major distributors.
Sun-protection brand positioning
Gale Pacific’s core value proposition centers on UV protection, privacy and outdoor comfort—needs that persist across climates and user segments. Clear functional benefits make it easier to communicate ROI to homeowners and facilities managers. This focus supports premium pricing on performance SKUs and aligns with health narratives in hot, high-UV regions; in Australia 2 in 3 people will be diagnosed with skin cancer by age 70 (Skin Cancer Foundation).
Global manufacturing footprint
Gale Pacifics global manufacturing footprint enables proximity to customers and faster fulfillment, supporting FY2024 group sales of AUD 204.6m and reducing lead times across regions. It mitigates single-country supply and currency concentration risks by diversifying production. Regional plants tailor products to local codes and climates, while scale across markets boosts procurement leverage on polymers and additives, lowering input cost volatility.
Channel reach in retail and trade
Gale Pacific serves DIY retail, professional installers and architectural specifiers, giving products broad end-market relevance; multichannel access spreads demand and raises market visibility while diversifying margin mix between retail and project sales, and broader routes-to-market shorten payback on product development.
- Channels: DIY / Trade / Specifiers
- Benefit: demand spread + visibility
- Finance: diversified margin mix
- R&D: faster payback via routes-to-market
Application versatility
Gale Pacifics range from shade sails and gazebos to blinds and screens lets the company serve projects from small patios to commercial facades, supporting system selling (fabric plus hardware and fittings) and boosting win rates across project sizes; the business operates in over 80 countries.
- Application versatility
- System selling (fabric + hardware)
- Patio to facade coverage
- Supports adjacent outdoor living entry
Global fabrics group posts AUD 204.6m FY24, ASX-listed cross-sell strength
Gale Pacific, ASX-listed, operates in 80+ countries and reported FY2024 revenue AUD 204.6m, reducing single-market exposure. Its broad product mix (shade, turf, architectural fabrics) enables cross-selling across DIY, trade and specifier channels and supports system selling. Global manufacturing footprint shortens lead times and improves procurement leverage on polymers.
| Metric | Value |
|---|---|
| FY2024 revenue | AUD 204.6m |
| Geographic reach | 80+ countries |
| Channels | DIY / Trade / Specifiers |
What is included in the product
Detailed Word Document
Provides a concise strategic overview of Gale Pacific’s internal strengths and weaknesses and external opportunities and threats, mapping key growth drivers, operational gaps, and market risks to inform strategic decision-making.
Customizable Excel Spreadsheet
Delivers a concise SWOT matrix tailored to Gale Pacific for rapid strategic clarity and stakeholder alignment, with an editable format that lets teams quickly update insights as market conditions change.
Weaknesses
Polymer input dependency
Many advanced fabrics rely on petrochemical-derived fibers and coatings, with synthetic fibers accounting for about 69% of global fiber production in 2023, exposing margins to resin-price volatility. Spot polypropylene and polyethylene saw swings exceeding 40% during 2020–2022, directly pressuring input costs and gross margins. Periodic polymer supply tightness has also extended lead times by several weeks, complicating fulfilment and sustainability positioning.
Exposure to weather seasonality
Outdoor living spend clusters in warm seasons and renovation cycles, concentrating demand into peak quarters and magnifying revenue volatility for Gale Pacific. Seasonality strains working capital and manufacturing planning as production must scale for short windows while smoothing off-season capacity. Retail sell-through variability during peak months can trigger discounting, eroding margins. Inventory risk rises sharply on weather anomalies that shorten selling seasons.
Project specification lag
Architectural fabric adoption for Gale Pacific (ASX: GAP) is tied to specification cycles and approvals, often spanning 12–24 months, slowing uptake. Long specification-driven sales cycles defer revenue recognition and cash conversion. Small spec losses can create underutilization in specialized manufacturing lines, while high technical support requirements add overhead and depress win rates.
Brand fragmentation risk
Serving DIY, trade and industrial customers risks diluting Gale Pacifics brand message as price/value cues and product positioning diverge across segments; different buyer needs complicate portfolio architecture and product roadmaps. Overlapping SKUs can confuse distributors and inflate inventory carrying costs, while marketing spend must stretch across digital, trade and B2B channels, reducing efficiency.
- Segment misalignment: weak unified brand
- SKU overlap: distributor confusion, higher inventory
- Marketing stretch: lower ROI across channels
Hardware and install reliance
End-product performance often hinges on fittings, frames and installer skill, so inconsistent installation partners can directly impact perceived quality and brand reputation. Limited post-sale control increases exposure to warranty claims and service costs, while the added complexity of professional installation deters some DIY consumers and narrows market reach.
- Dependence on external installers
- Inconsistent perceived quality
- Higher post-sale warranty risk
- Reduced appeal to DIY segment
Resin volatility and seasonal demand squeeze margins amid 12-24 month spec lag
Gale Pacific faces input-cost exposure as synthetic fibers made ~69% of global supply in 2023 and polymer spot swings exceeded 40% in 2020–22, pressuring margins. Demand seasonality concentrates sales into peak quarters, creating revenue volatility and inventory risk. Architectural spec cycles of 12–24 months slow revenue conversion and installer dependence raises warranty/service costs.
| Weakness | Key metric |
|---|---|
| Resin/fiber exposure | >40% spot swings; 69% synthetic share |
| Seasonality | Peak-quarter revenue concentration |
| Spec cycles | 12–24 months |
| Installer dependence | Higher warranty/service cost |
Preview the Actual Deliverable
Gale Pacific SWOT Analysis
This is the actual SWOT analysis document you’ll receive upon purchase—no surprises, just professional quality. The preview below is taken directly from the full SWOT report you'll get, and the complete, editable version is unlocked after checkout. You’re viewing a live preview of the real file; buy now to access the full, detailed Gale Pacific SWOT analysis.











