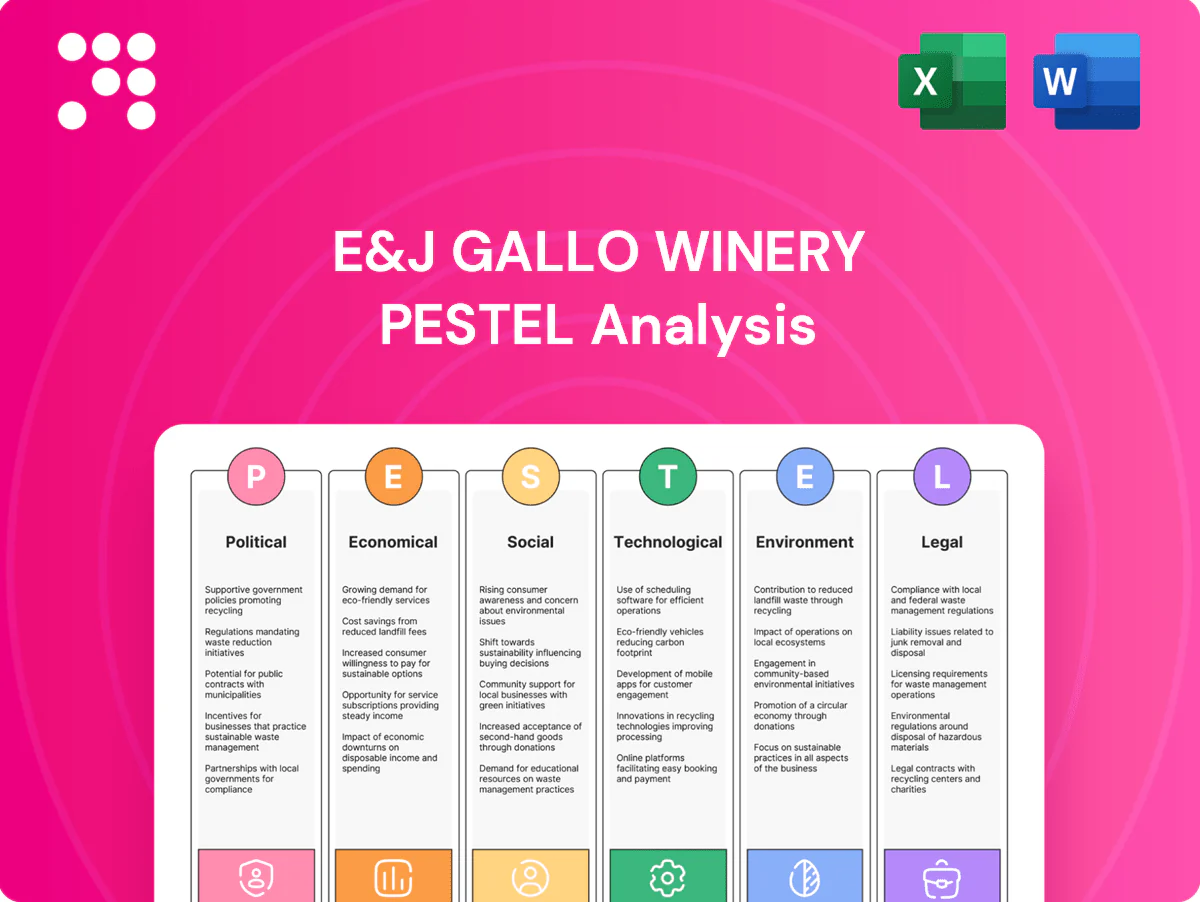
E&J Gallo Winery PESTLE Analysis

Skip the Research. Get the Strategy.
Explore how political shifts, economic trends, social tastes, technological advances, environmental pressures, and legal changes are shaping E&J Gallo Winery today. Our concise PESTLE highlights key risks and opportunities. Ideal for investors and strategists. Purchase the full analysis to get detailed, actionable insights now.
Political factors

Alcohol excise taxes and duties
Federal US wine excise rates (2024) range roughly $1.07/gal (0–14% ABV) to $3.15/gal (>21% ABV), while state levies vary widely, materially affecting shelf price and margins; evolving sin-tax moves are shifting demand to lower‑ABV and value segments, so Gallo must scenario‑plan for rate hikes and protect mix; cross‑border duties and tariffs can add significant landed cost, altering export routing and competitiveness.
Trade policy and tariffs
Tariffs on glass, aluminum, cork or imported EU wines can lift input costs and change relative pricing; with Gallo holding roughly 25% of the US wine market, a 5–10% rise in packaging costs would materially compress margins. New trade agreements or disputes (eg bilateral shifts since 2021–2024) can alter sourcing and market access, but Gallo’s diversified supply chains and multiple production footprints across US and international sites hedge geopolitical risk. Proactive lobbying, tariff engineering and customs optimization have reduced past duty impacts and remain key levers to mitigate sudden shocks.

Agricultural subsidies and farm policy
US and state vineyard supports, crop insurance and water allocations shift cost curves—crop insurance program liability exceeded $140B in recent years and H-2A certified agricultural positions hit about 344,000 (FY2023), highlighting labor pressure. Policy incentives for sustainable farming (state grants, carbon programs) lower long-term risk and boost brand equity, while shifts in immigration policy require proactive engagement with policymakers to preserve viticulture viability.

Interstate shipping and three-tier dynamics
Interstate shipping rules vary widely and, as of 2024, about 48 states permit some form of direct-to-consumer wine shipping, constraining or enabling premium DTC margins; DTC often captures 10–15% of revenue despite lower volume, boosting profitability. The three-tier system sets pricing power and channel strategy, affecting distributor negotiations and national rollout. Regulatory liberalization in states with recent reforms has unlocked higher-LTV DTC customers, while compliance needs state-by-state operational rigor and tracking.
Public health and marketing regulation
Growing regulatory scrutiny—highlighted by the US Surgeon General advisory on alcohol and health (Nov 2023)—is driving tighter rules on marketing, labeling, sponsorships and outlet density; mandated warnings and placement limits raise go-to-market costs for producers like E&J Gallo. Gallo must calibrate robust responsible-marketing frameworks and work with trade bodies to influence balanced policy outcomes.
Excise, tariffs & labor threaten margins; 25%, +5–10% costs
Federal excise hikes, state levies and tariffs (glass/aluminum) materially affect Gallo’s margins given ~25% US market share; packaging cost rises of 5–10% would be significant. Labor and crop policy (H-2A ~344,000 FY2023; crop insurance exposure ~$140B) drive cost/availability. DTC (48 states, ~10–15% revenue) and Surgeon General advisory Nov 2023 tighten marketing/compliance.
| Metric | Value |
|---|---|
| US market share | ~25% |
| DTC states | 48 |
| DTC revenue | 10–15% |
| H-2A positions (FY2023) | ~344,000 |
| Crop insurance liability | ~$140B |
What is included in the product
 Detailed Word Document
Explores how macro-environmental forces—Political, Economic, Social, Technological, Environmental and Legal—specifically impact E&J Gallo Winery, using data-driven trends and region-specific examples to identify risks and opportunities. Designed for executives and investors to inform strategy, scenario planning, and funding discussions.

 Customizable Excel Spreadsheet
A concise, visually segmented PESTLE summary of E&J Gallo Winery that can be dropped into PowerPoints or used in planning sessions, streamlining external risk and market-position discussions. Allows quick team alignment and simple customization with notes for region or business line.
Economic factors

Consumer spending and premiumization cycles
Macroeconomic swings shift mix between value, core, and luxury tiers; after inflation peaked in 2022 and US CPI eased to about 3.4% by Dec 2023, trading-down pressures compressed margins in downturns while recoveries lift premium SKUs. Gallo’s broad portfolio across price points buffers channel volatility. Active revenue management and pack-size strategy smooth elasticity impacts and protect share.
Input cost inflation and logistics
Input-cost inflation for glass, aluminum, pallets, energy and freight continues to compress margins; container rates remain volatile after falling roughly 80% from 2021 peaks, and industrial energy and metal prices stayed elevated through 2024.
Hedging, long-term supplier contracts and lightweighting—which can reduce packaging weight by 20–30% in some SKU groups—are used to lower exposure and preserve margins.
Nearshoring and multimodal logistics improve resilience and shorten lead times, while cost-to-serve analytics guide SKU rationalization to eliminate low-margin items and optimize distribution efficiency.

Foreign exchange and global demand
USD strength (DXY ~103–105 in mid‑2025) erodes export competitiveness and reduces repatriated profits for E&J Gallo, while IMF April 2025 data projects emerging‑market growth around 4.3% in 2025, offering volume upside but higher FX volatility. Pricing corridors and local distribution partnerships help stabilize margins. Natural hedges from local sourcing and multi‑currency planning remain critical to protect earnings.

Interest rates and working capital
Higher interest rates (US federal funds target 5.25–5.50% as of July 2025) raise financing costs for inventory, barrels and capital projects, increasing WACC and pressuring working capital. Long wine aging cycles (often 12–36 months) tie up cash and demand strict cash conversion discipline. Dynamic discounting and S&OP deployments shorten inventory days and improve cash flow. Capex is being prioritized toward high-ROI automation and sustainability investments.
- Higher rates: Fed funds 5.25–5.50% (Jul 2025)
- Aging cycles: 12–36 months
- Inventory reduction: S&OP/dynamic discounting improve days on hand
- Capex focus: automation + sustainability for best ROI
Channel consolidation and bargaining power
Large retailers and distributors now dictate placement and promotion, with the top four US grocery chains capturing roughly 50% of off-premise wine sales in 2024 (NielsenIQ), forcing E&J Gallo to prioritize trade-spend efficiency and joint business planning where promotional ROI is decisive. Omnichannel expansion—direct-to-consumer and e-commerce—offsets shelf-space risk as online wine sales grew ~18% in 2024. Data-sharing and category captaincy give Gallo stronger negotiation leverage through shared POS and shopper analytics.
- Retail concentration: top-4 ≈50% of off-premise wine sales (2024)
- Trade spend focus: promotional ROI and joint business planning
- Omnichannel growth: online wine sales +18% (2024)
- Negotiation leverage: POS data & category captaincy
Excise, tariffs & labor threaten margins; 25%, +5–10% costs
Macroeconomic swings and USD strength (DXY ~103–105 mid‑2025) shift consumers toward value but recoveries boost premium SKUs; US CPI eased to ~3.4% Dec 2023. Input-cost inflation (glass, energy, freight) and higher rates (Fed 5.25–5.50% Jul 2025) compress margins; container rates fell ~80% from 2021 peaks. Trade concentration (top‑4 ≈50% off‑premise 2024) and online sales +18% (2024) drive channel strategy.
| Metric | Value |
|---|---|
| Fed funds | 5.25–5.50% (Jul 2025) |
| DXY | ~103–105 (mid‑2025) |
| US CPI | ~3.4% (Dec 2023) |
| Top‑4 retail share | ~50% (2024) |
| Online wine growth | +18% (2024) |
Preview the Actual Deliverable
E&J Gallo Winery PESTLE Analysis
This E&J Gallo Winery PESTLE Analysis preview is the exact, fully formatted document you’ll receive after purchase, ready for immediate use. It includes political, economic, social, technological, legal and environmental insights specific to Gallo. What you see here is the final file—no placeholders, no edits needed.

Skip the Research. Get the Strategy.
Explore how political shifts, economic trends, social tastes, technological advances, environmental pressures, and legal changes are shaping E&J Gallo Winery today. Our concise PESTLE highlights key risks and opportunities. Ideal for investors and strategists. Purchase the full analysis to get detailed, actionable insights now.
Political factors
Alcohol excise taxes and duties
Federal US wine excise rates (2024) range roughly $1.07/gal (0–14% ABV) to $3.15/gal (>21% ABV), while state levies vary widely, materially affecting shelf price and margins; evolving sin-tax moves are shifting demand to lower‑ABV and value segments, so Gallo must scenario‑plan for rate hikes and protect mix; cross‑border duties and tariffs can add significant landed cost, altering export routing and competitiveness.
Trade policy and tariffs
Tariffs on glass, aluminum, cork or imported EU wines can lift input costs and change relative pricing; with Gallo holding roughly 25% of the US wine market, a 5–10% rise in packaging costs would materially compress margins. New trade agreements or disputes (eg bilateral shifts since 2021–2024) can alter sourcing and market access, but Gallo’s diversified supply chains and multiple production footprints across US and international sites hedge geopolitical risk. Proactive lobbying, tariff engineering and customs optimization have reduced past duty impacts and remain key levers to mitigate sudden shocks.
Agricultural subsidies and farm policy
US and state vineyard supports, crop insurance and water allocations shift cost curves—crop insurance program liability exceeded $140B in recent years and H-2A certified agricultural positions hit about 344,000 (FY2023), highlighting labor pressure. Policy incentives for sustainable farming (state grants, carbon programs) lower long-term risk and boost brand equity, while shifts in immigration policy require proactive engagement with policymakers to preserve viticulture viability.
Interstate shipping and three-tier dynamics
Interstate shipping rules vary widely and, as of 2024, about 48 states permit some form of direct-to-consumer wine shipping, constraining or enabling premium DTC margins; DTC often captures 10–15% of revenue despite lower volume, boosting profitability. The three-tier system sets pricing power and channel strategy, affecting distributor negotiations and national rollout. Regulatory liberalization in states with recent reforms has unlocked higher-LTV DTC customers, while compliance needs state-by-state operational rigor and tracking.
Public health and marketing regulation
Growing regulatory scrutiny—highlighted by the US Surgeon General advisory on alcohol and health (Nov 2023)—is driving tighter rules on marketing, labeling, sponsorships and outlet density; mandated warnings and placement limits raise go-to-market costs for producers like E&J Gallo. Gallo must calibrate robust responsible-marketing frameworks and work with trade bodies to influence balanced policy outcomes.
Excise, tariffs & labor threaten margins; 25%, +5–10% costs
Federal excise hikes, state levies and tariffs (glass/aluminum) materially affect Gallo’s margins given ~25% US market share; packaging cost rises of 5–10% would be significant. Labor and crop policy (H-2A ~344,000 FY2023; crop insurance exposure ~$140B) drive cost/availability. DTC (48 states, ~10–15% revenue) and Surgeon General advisory Nov 2023 tighten marketing/compliance.
| Metric | Value |
|---|---|
| US market share | ~25% |
| DTC states | 48 |
| DTC revenue | 10–15% |
| H-2A positions (FY2023) | ~344,000 |
| Crop insurance liability | ~$140B |
What is included in the product
Detailed Word Document
Explores how macro-environmental forces—Political, Economic, Social, Technological, Environmental and Legal—specifically impact E&J Gallo Winery, using data-driven trends and region-specific examples to identify risks and opportunities. Designed for executives and investors to inform strategy, scenario planning, and funding discussions.
Customizable Excel Spreadsheet
A concise, visually segmented PESTLE summary of E&J Gallo Winery that can be dropped into PowerPoints or used in planning sessions, streamlining external risk and market-position discussions. Allows quick team alignment and simple customization with notes for region or business line.
Economic factors
Consumer spending and premiumization cycles
Macroeconomic swings shift mix between value, core, and luxury tiers; after inflation peaked in 2022 and US CPI eased to about 3.4% by Dec 2023, trading-down pressures compressed margins in downturns while recoveries lift premium SKUs. Gallo’s broad portfolio across price points buffers channel volatility. Active revenue management and pack-size strategy smooth elasticity impacts and protect share.
Input cost inflation and logistics
Input-cost inflation for glass, aluminum, pallets, energy and freight continues to compress margins; container rates remain volatile after falling roughly 80% from 2021 peaks, and industrial energy and metal prices stayed elevated through 2024.
Hedging, long-term supplier contracts and lightweighting—which can reduce packaging weight by 20–30% in some SKU groups—are used to lower exposure and preserve margins.
Nearshoring and multimodal logistics improve resilience and shorten lead times, while cost-to-serve analytics guide SKU rationalization to eliminate low-margin items and optimize distribution efficiency.
Foreign exchange and global demand
USD strength (DXY ~103–105 in mid‑2025) erodes export competitiveness and reduces repatriated profits for E&J Gallo, while IMF April 2025 data projects emerging‑market growth around 4.3% in 2025, offering volume upside but higher FX volatility. Pricing corridors and local distribution partnerships help stabilize margins. Natural hedges from local sourcing and multi‑currency planning remain critical to protect earnings.
Interest rates and working capital
Higher interest rates (US federal funds target 5.25–5.50% as of July 2025) raise financing costs for inventory, barrels and capital projects, increasing WACC and pressuring working capital. Long wine aging cycles (often 12–36 months) tie up cash and demand strict cash conversion discipline. Dynamic discounting and S&OP deployments shorten inventory days and improve cash flow. Capex is being prioritized toward high-ROI automation and sustainability investments.
- Higher rates: Fed funds 5.25–5.50% (Jul 2025)
- Aging cycles: 12–36 months
- Inventory reduction: S&OP/dynamic discounting improve days on hand
- Capex focus: automation + sustainability for best ROI
Channel consolidation and bargaining power
Large retailers and distributors now dictate placement and promotion, with the top four US grocery chains capturing roughly 50% of off-premise wine sales in 2024 (NielsenIQ), forcing E&J Gallo to prioritize trade-spend efficiency and joint business planning where promotional ROI is decisive. Omnichannel expansion—direct-to-consumer and e-commerce—offsets shelf-space risk as online wine sales grew ~18% in 2024. Data-sharing and category captaincy give Gallo stronger negotiation leverage through shared POS and shopper analytics.
- Retail concentration: top-4 ≈50% of off-premise wine sales (2024)
- Trade spend focus: promotional ROI and joint business planning
- Omnichannel growth: online wine sales +18% (2024)
- Negotiation leverage: POS data & category captaincy
Excise, tariffs & labor threaten margins; 25%, +5–10% costs
Macroeconomic swings and USD strength (DXY ~103–105 mid‑2025) shift consumers toward value but recoveries boost premium SKUs; US CPI eased to ~3.4% Dec 2023. Input-cost inflation (glass, energy, freight) and higher rates (Fed 5.25–5.50% Jul 2025) compress margins; container rates fell ~80% from 2021 peaks. Trade concentration (top‑4 ≈50% off‑premise 2024) and online sales +18% (2024) drive channel strategy.
| Metric | Value |
|---|---|
| Fed funds | 5.25–5.50% (Jul 2025) |
| DXY | ~103–105 (mid‑2025) |
| US CPI | ~3.4% (Dec 2023) |
| Top‑4 retail share | ~50% (2024) |
| Online wine growth | +18% (2024) |
Preview the Actual Deliverable
E&J Gallo Winery PESTLE Analysis
This E&J Gallo Winery PESTLE Analysis preview is the exact, fully formatted document you’ll receive after purchase, ready for immediate use. It includes political, economic, social, technological, legal and environmental insights specific to Gallo. What you see here is the final file—no placeholders, no edits needed.
Original: $10.00
-65%$10.00
$3.50Description
Skip the Research. Get the Strategy.
Explore how political shifts, economic trends, social tastes, technological advances, environmental pressures, and legal changes are shaping E&J Gallo Winery today. Our concise PESTLE highlights key risks and opportunities. Ideal for investors and strategists. Purchase the full analysis to get detailed, actionable insights now.
Political factors
Alcohol excise taxes and duties
Federal US wine excise rates (2024) range roughly $1.07/gal (0–14% ABV) to $3.15/gal (>21% ABV), while state levies vary widely, materially affecting shelf price and margins; evolving sin-tax moves are shifting demand to lower‑ABV and value segments, so Gallo must scenario‑plan for rate hikes and protect mix; cross‑border duties and tariffs can add significant landed cost, altering export routing and competitiveness.
Trade policy and tariffs
Tariffs on glass, aluminum, cork or imported EU wines can lift input costs and change relative pricing; with Gallo holding roughly 25% of the US wine market, a 5–10% rise in packaging costs would materially compress margins. New trade agreements or disputes (eg bilateral shifts since 2021–2024) can alter sourcing and market access, but Gallo’s diversified supply chains and multiple production footprints across US and international sites hedge geopolitical risk. Proactive lobbying, tariff engineering and customs optimization have reduced past duty impacts and remain key levers to mitigate sudden shocks.
Agricultural subsidies and farm policy
US and state vineyard supports, crop insurance and water allocations shift cost curves—crop insurance program liability exceeded $140B in recent years and H-2A certified agricultural positions hit about 344,000 (FY2023), highlighting labor pressure. Policy incentives for sustainable farming (state grants, carbon programs) lower long-term risk and boost brand equity, while shifts in immigration policy require proactive engagement with policymakers to preserve viticulture viability.
Interstate shipping and three-tier dynamics
Interstate shipping rules vary widely and, as of 2024, about 48 states permit some form of direct-to-consumer wine shipping, constraining or enabling premium DTC margins; DTC often captures 10–15% of revenue despite lower volume, boosting profitability. The three-tier system sets pricing power and channel strategy, affecting distributor negotiations and national rollout. Regulatory liberalization in states with recent reforms has unlocked higher-LTV DTC customers, while compliance needs state-by-state operational rigor and tracking.
Public health and marketing regulation
Growing regulatory scrutiny—highlighted by the US Surgeon General advisory on alcohol and health (Nov 2023)—is driving tighter rules on marketing, labeling, sponsorships and outlet density; mandated warnings and placement limits raise go-to-market costs for producers like E&J Gallo. Gallo must calibrate robust responsible-marketing frameworks and work with trade bodies to influence balanced policy outcomes.
Excise, tariffs & labor threaten margins; 25%, +5–10% costs
Federal excise hikes, state levies and tariffs (glass/aluminum) materially affect Gallo’s margins given ~25% US market share; packaging cost rises of 5–10% would be significant. Labor and crop policy (H-2A ~344,000 FY2023; crop insurance exposure ~$140B) drive cost/availability. DTC (48 states, ~10–15% revenue) and Surgeon General advisory Nov 2023 tighten marketing/compliance.
| Metric | Value |
|---|---|
| US market share | ~25% |
| DTC states | 48 |
| DTC revenue | 10–15% |
| H-2A positions (FY2023) | ~344,000 |
| Crop insurance liability | ~$140B |
What is included in the product
Detailed Word Document
Explores how macro-environmental forces—Political, Economic, Social, Technological, Environmental and Legal—specifically impact E&J Gallo Winery, using data-driven trends and region-specific examples to identify risks and opportunities. Designed for executives and investors to inform strategy, scenario planning, and funding discussions.
Customizable Excel Spreadsheet
A concise, visually segmented PESTLE summary of E&J Gallo Winery that can be dropped into PowerPoints or used in planning sessions, streamlining external risk and market-position discussions. Allows quick team alignment and simple customization with notes for region or business line.
Economic factors
Consumer spending and premiumization cycles
Macroeconomic swings shift mix between value, core, and luxury tiers; after inflation peaked in 2022 and US CPI eased to about 3.4% by Dec 2023, trading-down pressures compressed margins in downturns while recoveries lift premium SKUs. Gallo’s broad portfolio across price points buffers channel volatility. Active revenue management and pack-size strategy smooth elasticity impacts and protect share.
Input cost inflation and logistics
Input-cost inflation for glass, aluminum, pallets, energy and freight continues to compress margins; container rates remain volatile after falling roughly 80% from 2021 peaks, and industrial energy and metal prices stayed elevated through 2024.
Hedging, long-term supplier contracts and lightweighting—which can reduce packaging weight by 20–30% in some SKU groups—are used to lower exposure and preserve margins.
Nearshoring and multimodal logistics improve resilience and shorten lead times, while cost-to-serve analytics guide SKU rationalization to eliminate low-margin items and optimize distribution efficiency.
Foreign exchange and global demand
USD strength (DXY ~103–105 in mid‑2025) erodes export competitiveness and reduces repatriated profits for E&J Gallo, while IMF April 2025 data projects emerging‑market growth around 4.3% in 2025, offering volume upside but higher FX volatility. Pricing corridors and local distribution partnerships help stabilize margins. Natural hedges from local sourcing and multi‑currency planning remain critical to protect earnings.
Interest rates and working capital
Higher interest rates (US federal funds target 5.25–5.50% as of July 2025) raise financing costs for inventory, barrels and capital projects, increasing WACC and pressuring working capital. Long wine aging cycles (often 12–36 months) tie up cash and demand strict cash conversion discipline. Dynamic discounting and S&OP deployments shorten inventory days and improve cash flow. Capex is being prioritized toward high-ROI automation and sustainability investments.
- Higher rates: Fed funds 5.25–5.50% (Jul 2025)
- Aging cycles: 12–36 months
- Inventory reduction: S&OP/dynamic discounting improve days on hand
- Capex focus: automation + sustainability for best ROI
Channel consolidation and bargaining power
Large retailers and distributors now dictate placement and promotion, with the top four US grocery chains capturing roughly 50% of off-premise wine sales in 2024 (NielsenIQ), forcing E&J Gallo to prioritize trade-spend efficiency and joint business planning where promotional ROI is decisive. Omnichannel expansion—direct-to-consumer and e-commerce—offsets shelf-space risk as online wine sales grew ~18% in 2024. Data-sharing and category captaincy give Gallo stronger negotiation leverage through shared POS and shopper analytics.
- Retail concentration: top-4 ≈50% of off-premise wine sales (2024)
- Trade spend focus: promotional ROI and joint business planning
- Omnichannel growth: online wine sales +18% (2024)
- Negotiation leverage: POS data & category captaincy
Excise, tariffs & labor threaten margins; 25%, +5–10% costs
Macroeconomic swings and USD strength (DXY ~103–105 mid‑2025) shift consumers toward value but recoveries boost premium SKUs; US CPI eased to ~3.4% Dec 2023. Input-cost inflation (glass, energy, freight) and higher rates (Fed 5.25–5.50% Jul 2025) compress margins; container rates fell ~80% from 2021 peaks. Trade concentration (top‑4 ≈50% off‑premise 2024) and online sales +18% (2024) drive channel strategy.
| Metric | Value |
|---|---|
| Fed funds | 5.25–5.50% (Jul 2025) |
| DXY | ~103–105 (mid‑2025) |
| US CPI | ~3.4% (Dec 2023) |
| Top‑4 retail share | ~50% (2024) |
| Online wine growth | +18% (2024) |
Preview the Actual Deliverable
E&J Gallo Winery PESTLE Analysis
This E&J Gallo Winery PESTLE Analysis preview is the exact, fully formatted document you’ll receive after purchase, ready for immediate use. It includes political, economic, social, technological, legal and environmental insights specific to Gallo. What you see here is the final file—no placeholders, no edits needed.











