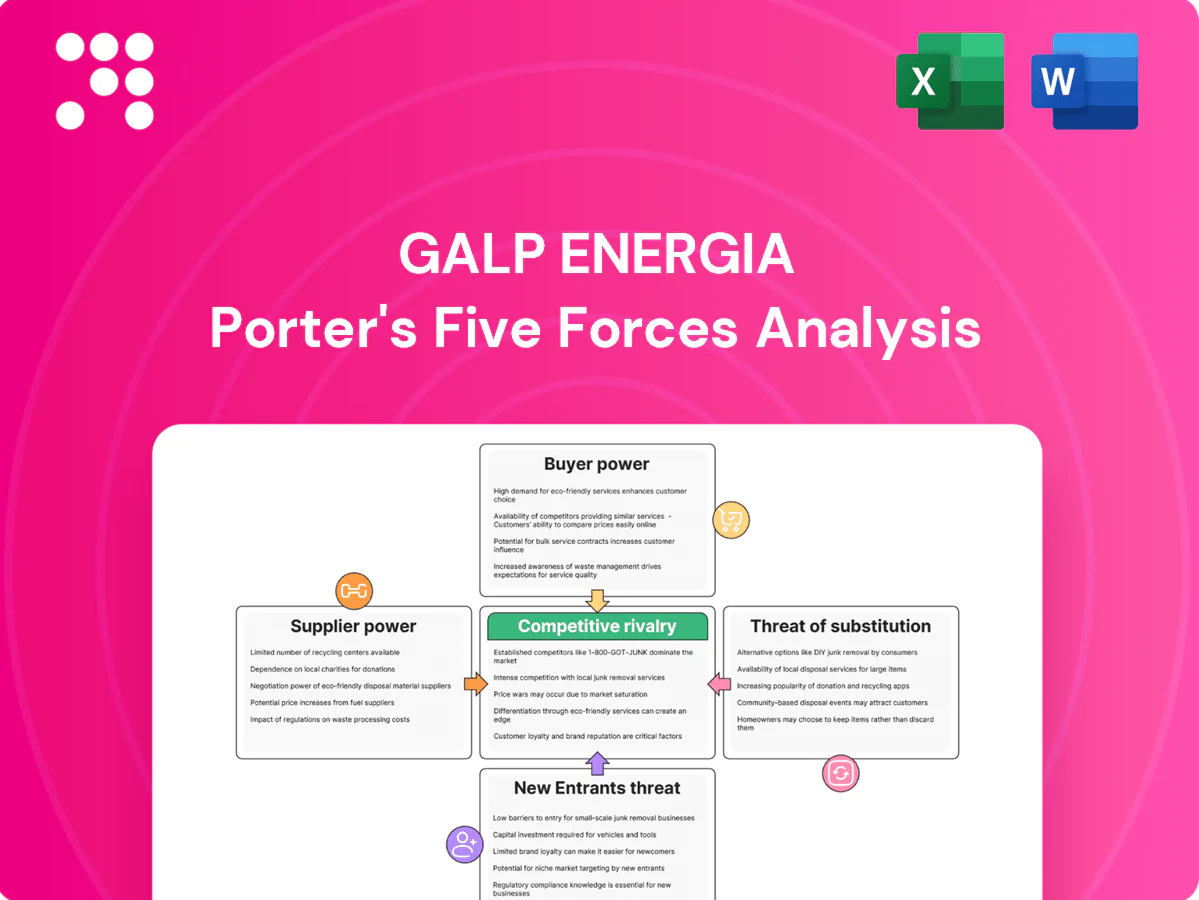
Galp Energia Porter's Five Forces Analysis

Go Beyond the Preview—Access the Full Strategic Report
Galp Energia faces moderate supplier power, regulated buyer markets, and evolving substitute threats amid energy transition, creating a dynamic competitive landscape that demands strategic clarity. This brief snapshot only scratches the surface. Unlock the full Porter's Five Forces Analysis to explore Galp’s market pressures and strategic advantages in detail.
Suppliers Bargaining Power

Resource-owning states/NOCs
Upstream access for Galp is governed by host states and NOCs, which in 2024 control roughly 75% of proven oil reserves and can set fiscal terms and local‑content rules that raise costs. Concession scarcity and geopolitical risk (e.g., licence curbs) boost their leverage. Long‑dated PSCs (typically 20–30 years) smooth revenue but limit Galp’s operational flexibility, while competition from majors for acreage sustains supplier power.
Oilfield services & EPC capacity
Specialized drilling, subsea and EPC providers remain concentrated — the top five oilfield services firms held over 60% of market share in 2024 — and the sector is highly cyclical. Tight post‑downturn service markets in 2024 pushed dayrates and input costs higher, sustaining inflationary pressure on project budgets. Galp can multi‑source and use frame contracts to mitigate exposure, but critical scopes (subsea trees, long‑lead turbomachinery) limit substitution. Schedule risk therefore amplifies supplier leverage over project economics.

Crude/feedstock & gas procurement
Refining depends on suitable crudes and gas with quality and logistics limits; Galp’s Sines complex faces feedstock matching and pipeline/LNG constraints that tightened in 2024 when Brent averaged about $85–90/bbl. OPEC+ production adjustments (~2 mb/d cuts) and regional pipeline/LNG bottlenecks elevated input costs and volatility. Term contracts and hedging partially shield Galp, but supply shocks feed quickly into refining margin pressure.

Power equipment & solar OEMs
Galp’s renewables expansion ties it closely to module, inverter and transformer OEMs, with long OEM delivery cycles (commonly 12–24 weeks) giving suppliers pricing leverage amid supply‑chain tightness and trade measures that have periodically tightened margins in 2024. Standardized components lower single‑supplier risk, but strict grid codes and certification requirements constrain substitute options and raise integration costs. Prolonged lead times and concentrated OEM capabilities sustain supplier bargaining power.
- lead_times: 12–24 weeks
- OEM_capex_share: >50% of project hardware
- grid_code_limits: restrict alternative suppliers
- trade_measures_2024: tighten pricing/lead times
Grid access & transmission operators
Grid connection points, curtailment rules and reinforcement are controlled by TSOs/DSOs, so Galp cannot set timing or technical terms; queue backlogs and connection fees frequently force project resizing or multi-year delays. Scarce capacity increases effective supplier power, and EU estimates require roughly €500bn of grid investment to 2030, underscoring constrained transmission capacity in 2024.
- Connection control: TSOs/DSOs set points and rules
- Delay impact: queues can delay projects years
- Costs: connection fees and reinforcements resize CAPEX
- Market power: scarce capacity raises supplier leverage
Host-state supplier power rises — reserves ~75%, Brent $85–90/bbl
Supplier power over Galp is high: host states/NOCs control ~75% of reserves and set fiscal/local rules; OPEC+ cuts and Brent ~$85–90/bbl in 2024 raised feedstock costs. Top‑5 oilfield service share >60% and tight markets pushed rates up; critical long‑lead items and OEM capex (>50%) with 12–24 week lead times limit substitution. Grid bottlenecks and €500bn EU transmission need to 2030 increase TSO leverage.
| Metric | 2024/Estimate |
|---|---|
| Host‑state reserve share | ~75% |
| Top‑5 OFS market share | >60% |
| Brent | $85–90/bbl |
| OEM capex share | >50% |
| Lead times | 12–24 weeks |
| EU grid capex to 2030 | €500bn |
What is included in the product
 Detailed Word Document
Tailored Porter's Five Forces analysis for Galp Energia, uncovering competitive drivers, buyer and supplier power, entry barriers, substitutes and industry rivalry, and identifying disruptive threats and strategic levers shaping its pricing and profitability.

 Customizable Excel Spreadsheet
One-sheet Porter's Five Forces for Galp Energia — quickly visualize competitive pressures across oil, gas and renewables with an editable radar chart and customizable inputs, ready to drop into board decks or integrate with broader Excel dashboards for fast strategic decisions.
Customers Bargaining Power

Wholesale fuel distributors
Large resellers and fleet customers secure volume discounts and branding terms, exercising high leverage given transparent pricing and low switching costs; wholesale channels account for over 60% of B2B volumes in Iberia. Galp sustains share via a 1,300+ forecourt network, loyalty programs and integrated logistics. Competitive tenders commonly compress margins, often reducing bid spreads by double digits in 2024.
Industrial gas & power offtakers
Energy-intensive industrial offtakers push for indexed, flexible contracts and risk-sharing, leveraging alternatives like multi-sourcing and corporate PPAs that strengthened buyer positions after global corporate PPA volumes exceeded 30 GW in 2023 and remained robust into 2024. Creditworthy corporates secure bespoke pricing, collateral and delivery terms. Galp responds with bundled fuel, power and services and emphasizes supply reliability to retain contracts.

Retail motorists & households
Price visibility at the pump and in power tariffs enables rapid switching by retail motorists and households, while loyalty programs and station convenience cut but do not remove price sensitivity; EVs, which accounted for about 14% of global car sales in 2023 per IEA and rose further in 2024, gradually erode road‑fuel dependence, and digital comparators increase buyer awareness and negotiating power.

Utilities and traders
Utilities and traders exert strong bargaining power: 2024 hub liquidity rose markedly, enabling arbitrage across TTF, NBP and power hubs and compressing margins in standard products; Galp offsets this by differentiating via green attributes and firming services, which preserve premium spreads; active risk management is required to maintain those spreads amid volatile short-term basis and shape risks.
- 2024 hub liquidity: elevated, enabling cross-hub arbitrage
- Compression: tighter margins on vanilla products
- Differentiation: green attributes and firming services reduce buyer leverage
- Key focus: balancing risk management to protect spreads
Government/regulated segments
Regulated tariffs set by Portugal’s regulator ERSE cap pass-through in gas and power, limiting Galp’s ability to transfer wholesale cost spikes to end customers and shifting volatility risk to suppliers.
Compliance with social tariff rules and grid obligations raises operating costs and constrains pricing freedom, while long-term regulated contracts and regulated-asset returns provide partial stability; EU ETS averaged near €100/tCO2 in 2024, pressuring supplier margins.
- Regulatory cap: ERSE-controlled tariffs reduce pass-through
- Risk shift: customers protected, suppliers bear volatility
- Cost pressure: compliance and social tariffs limit pricing
- Stability: long-term regulated returns partially mitigate asymmetry
B2B buyers (>60%) and utilities compress margins as EU ETS nears €100/tCO2
Large B2B buyers (wholesale >60% Iberia) and utilities/traders exert strong leverage, compressing margins despite Galp’s 1,300+ forecourts, loyalty programs and bundled offers. Energy‑intensive corporates (corporate PPA volumes >30 GW in 2023) demand indexed, flexible contracts; retail switching rises with EVs (~14% global car sales 2023). Regulation (ERSE caps) and EU ETS near €100/tCO2 in 2024 constrain pass‑through and press margins.
| Metric | 2024 value | Implication |
|---|---|---|
| Wholesale B2B share Iberia | >60% | High buyer leverage |
| Galp forecourts | 1,300+ | Retention tool |
| Corporate PPA | >30 GW (2023) | Stronger buyer options |
| EU ETS | ~€100/tCO2 | Margin pressure |
Preview the Actual Deliverable
Galp Energia Porter's Five Forces Analysis
This preview shows the exact Galp Energia Porter's Five Forces Analysis you'll receive immediately after purchase—no surprises, no placeholders. The file is fully formatted and ready for download and use the moment you buy. You’re previewing the final version, identical to your deliverable.

Go Beyond the Preview—Access the Full Strategic Report
Galp Energia faces moderate supplier power, regulated buyer markets, and evolving substitute threats amid energy transition, creating a dynamic competitive landscape that demands strategic clarity. This brief snapshot only scratches the surface. Unlock the full Porter's Five Forces Analysis to explore Galp’s market pressures and strategic advantages in detail.
Suppliers Bargaining Power
Resource-owning states/NOCs
Upstream access for Galp is governed by host states and NOCs, which in 2024 control roughly 75% of proven oil reserves and can set fiscal terms and local‑content rules that raise costs. Concession scarcity and geopolitical risk (e.g., licence curbs) boost their leverage. Long‑dated PSCs (typically 20–30 years) smooth revenue but limit Galp’s operational flexibility, while competition from majors for acreage sustains supplier power.
Oilfield services & EPC capacity
Specialized drilling, subsea and EPC providers remain concentrated — the top five oilfield services firms held over 60% of market share in 2024 — and the sector is highly cyclical. Tight post‑downturn service markets in 2024 pushed dayrates and input costs higher, sustaining inflationary pressure on project budgets. Galp can multi‑source and use frame contracts to mitigate exposure, but critical scopes (subsea trees, long‑lead turbomachinery) limit substitution. Schedule risk therefore amplifies supplier leverage over project economics.
Crude/feedstock & gas procurement
Refining depends on suitable crudes and gas with quality and logistics limits; Galp’s Sines complex faces feedstock matching and pipeline/LNG constraints that tightened in 2024 when Brent averaged about $85–90/bbl. OPEC+ production adjustments (~2 mb/d cuts) and regional pipeline/LNG bottlenecks elevated input costs and volatility. Term contracts and hedging partially shield Galp, but supply shocks feed quickly into refining margin pressure.
Power equipment & solar OEMs
Galp’s renewables expansion ties it closely to module, inverter and transformer OEMs, with long OEM delivery cycles (commonly 12–24 weeks) giving suppliers pricing leverage amid supply‑chain tightness and trade measures that have periodically tightened margins in 2024. Standardized components lower single‑supplier risk, but strict grid codes and certification requirements constrain substitute options and raise integration costs. Prolonged lead times and concentrated OEM capabilities sustain supplier bargaining power.
- lead_times: 12–24 weeks
- OEM_capex_share: >50% of project hardware
- grid_code_limits: restrict alternative suppliers
- trade_measures_2024: tighten pricing/lead times
Grid access & transmission operators
Grid connection points, curtailment rules and reinforcement are controlled by TSOs/DSOs, so Galp cannot set timing or technical terms; queue backlogs and connection fees frequently force project resizing or multi-year delays. Scarce capacity increases effective supplier power, and EU estimates require roughly €500bn of grid investment to 2030, underscoring constrained transmission capacity in 2024.
- Connection control: TSOs/DSOs set points and rules
- Delay impact: queues can delay projects years
- Costs: connection fees and reinforcements resize CAPEX
- Market power: scarce capacity raises supplier leverage
Host-state supplier power rises — reserves ~75%, Brent $85–90/bbl
Supplier power over Galp is high: host states/NOCs control ~75% of reserves and set fiscal/local rules; OPEC+ cuts and Brent ~$85–90/bbl in 2024 raised feedstock costs. Top‑5 oilfield service share >60% and tight markets pushed rates up; critical long‑lead items and OEM capex (>50%) with 12–24 week lead times limit substitution. Grid bottlenecks and €500bn EU transmission need to 2030 increase TSO leverage.
| Metric | 2024/Estimate |
|---|---|
| Host‑state reserve share | ~75% |
| Top‑5 OFS market share | >60% |
| Brent | $85–90/bbl |
| OEM capex share | >50% |
| Lead times | 12–24 weeks |
| EU grid capex to 2030 | €500bn |
What is included in the product
Detailed Word Document
Tailored Porter's Five Forces analysis for Galp Energia, uncovering competitive drivers, buyer and supplier power, entry barriers, substitutes and industry rivalry, and identifying disruptive threats and strategic levers shaping its pricing and profitability.
Customizable Excel Spreadsheet
One-sheet Porter's Five Forces for Galp Energia — quickly visualize competitive pressures across oil, gas and renewables with an editable radar chart and customizable inputs, ready to drop into board decks or integrate with broader Excel dashboards for fast strategic decisions.
Customers Bargaining Power
Wholesale fuel distributors
Large resellers and fleet customers secure volume discounts and branding terms, exercising high leverage given transparent pricing and low switching costs; wholesale channels account for over 60% of B2B volumes in Iberia. Galp sustains share via a 1,300+ forecourt network, loyalty programs and integrated logistics. Competitive tenders commonly compress margins, often reducing bid spreads by double digits in 2024.
Industrial gas & power offtakers
Energy-intensive industrial offtakers push for indexed, flexible contracts and risk-sharing, leveraging alternatives like multi-sourcing and corporate PPAs that strengthened buyer positions after global corporate PPA volumes exceeded 30 GW in 2023 and remained robust into 2024. Creditworthy corporates secure bespoke pricing, collateral and delivery terms. Galp responds with bundled fuel, power and services and emphasizes supply reliability to retain contracts.
Retail motorists & households
Price visibility at the pump and in power tariffs enables rapid switching by retail motorists and households, while loyalty programs and station convenience cut but do not remove price sensitivity; EVs, which accounted for about 14% of global car sales in 2023 per IEA and rose further in 2024, gradually erode road‑fuel dependence, and digital comparators increase buyer awareness and negotiating power.
Utilities and traders
Utilities and traders exert strong bargaining power: 2024 hub liquidity rose markedly, enabling arbitrage across TTF, NBP and power hubs and compressing margins in standard products; Galp offsets this by differentiating via green attributes and firming services, which preserve premium spreads; active risk management is required to maintain those spreads amid volatile short-term basis and shape risks.
- 2024 hub liquidity: elevated, enabling cross-hub arbitrage
- Compression: tighter margins on vanilla products
- Differentiation: green attributes and firming services reduce buyer leverage
- Key focus: balancing risk management to protect spreads
Government/regulated segments
Regulated tariffs set by Portugal’s regulator ERSE cap pass-through in gas and power, limiting Galp’s ability to transfer wholesale cost spikes to end customers and shifting volatility risk to suppliers.
Compliance with social tariff rules and grid obligations raises operating costs and constrains pricing freedom, while long-term regulated contracts and regulated-asset returns provide partial stability; EU ETS averaged near €100/tCO2 in 2024, pressuring supplier margins.
- Regulatory cap: ERSE-controlled tariffs reduce pass-through
- Risk shift: customers protected, suppliers bear volatility
- Cost pressure: compliance and social tariffs limit pricing
- Stability: long-term regulated returns partially mitigate asymmetry
B2B buyers (>60%) and utilities compress margins as EU ETS nears €100/tCO2
Large B2B buyers (wholesale >60% Iberia) and utilities/traders exert strong leverage, compressing margins despite Galp’s 1,300+ forecourts, loyalty programs and bundled offers. Energy‑intensive corporates (corporate PPA volumes >30 GW in 2023) demand indexed, flexible contracts; retail switching rises with EVs (~14% global car sales 2023). Regulation (ERSE caps) and EU ETS near €100/tCO2 in 2024 constrain pass‑through and press margins.
| Metric | 2024 value | Implication |
|---|---|---|
| Wholesale B2B share Iberia | >60% | High buyer leverage |
| Galp forecourts | 1,300+ | Retention tool |
| Corporate PPA | >30 GW (2023) | Stronger buyer options |
| EU ETS | ~€100/tCO2 | Margin pressure |
Preview the Actual Deliverable
Galp Energia Porter's Five Forces Analysis
This preview shows the exact Galp Energia Porter's Five Forces Analysis you'll receive immediately after purchase—no surprises, no placeholders. The file is fully formatted and ready for download and use the moment you buy. You’re previewing the final version, identical to your deliverable.
Original: $10.00
-65%$10.00
$3.50Description
Go Beyond the Preview—Access the Full Strategic Report
Galp Energia faces moderate supplier power, regulated buyer markets, and evolving substitute threats amid energy transition, creating a dynamic competitive landscape that demands strategic clarity. This brief snapshot only scratches the surface. Unlock the full Porter's Five Forces Analysis to explore Galp’s market pressures and strategic advantages in detail.
Suppliers Bargaining Power
Resource-owning states/NOCs
Upstream access for Galp is governed by host states and NOCs, which in 2024 control roughly 75% of proven oil reserves and can set fiscal terms and local‑content rules that raise costs. Concession scarcity and geopolitical risk (e.g., licence curbs) boost their leverage. Long‑dated PSCs (typically 20–30 years) smooth revenue but limit Galp’s operational flexibility, while competition from majors for acreage sustains supplier power.
Oilfield services & EPC capacity
Specialized drilling, subsea and EPC providers remain concentrated — the top five oilfield services firms held over 60% of market share in 2024 — and the sector is highly cyclical. Tight post‑downturn service markets in 2024 pushed dayrates and input costs higher, sustaining inflationary pressure on project budgets. Galp can multi‑source and use frame contracts to mitigate exposure, but critical scopes (subsea trees, long‑lead turbomachinery) limit substitution. Schedule risk therefore amplifies supplier leverage over project economics.
Crude/feedstock & gas procurement
Refining depends on suitable crudes and gas with quality and logistics limits; Galp’s Sines complex faces feedstock matching and pipeline/LNG constraints that tightened in 2024 when Brent averaged about $85–90/bbl. OPEC+ production adjustments (~2 mb/d cuts) and regional pipeline/LNG bottlenecks elevated input costs and volatility. Term contracts and hedging partially shield Galp, but supply shocks feed quickly into refining margin pressure.
Power equipment & solar OEMs
Galp’s renewables expansion ties it closely to module, inverter and transformer OEMs, with long OEM delivery cycles (commonly 12–24 weeks) giving suppliers pricing leverage amid supply‑chain tightness and trade measures that have periodically tightened margins in 2024. Standardized components lower single‑supplier risk, but strict grid codes and certification requirements constrain substitute options and raise integration costs. Prolonged lead times and concentrated OEM capabilities sustain supplier bargaining power.
- lead_times: 12–24 weeks
- OEM_capex_share: >50% of project hardware
- grid_code_limits: restrict alternative suppliers
- trade_measures_2024: tighten pricing/lead times
Grid access & transmission operators
Grid connection points, curtailment rules and reinforcement are controlled by TSOs/DSOs, so Galp cannot set timing or technical terms; queue backlogs and connection fees frequently force project resizing or multi-year delays. Scarce capacity increases effective supplier power, and EU estimates require roughly €500bn of grid investment to 2030, underscoring constrained transmission capacity in 2024.
- Connection control: TSOs/DSOs set points and rules
- Delay impact: queues can delay projects years
- Costs: connection fees and reinforcements resize CAPEX
- Market power: scarce capacity raises supplier leverage
Host-state supplier power rises — reserves ~75%, Brent $85–90/bbl
Supplier power over Galp is high: host states/NOCs control ~75% of reserves and set fiscal/local rules; OPEC+ cuts and Brent ~$85–90/bbl in 2024 raised feedstock costs. Top‑5 oilfield service share >60% and tight markets pushed rates up; critical long‑lead items and OEM capex (>50%) with 12–24 week lead times limit substitution. Grid bottlenecks and €500bn EU transmission need to 2030 increase TSO leverage.
| Metric | 2024/Estimate |
|---|---|
| Host‑state reserve share | ~75% |
| Top‑5 OFS market share | >60% |
| Brent | $85–90/bbl |
| OEM capex share | >50% |
| Lead times | 12–24 weeks |
| EU grid capex to 2030 | €500bn |
What is included in the product
Detailed Word Document
Tailored Porter's Five Forces analysis for Galp Energia, uncovering competitive drivers, buyer and supplier power, entry barriers, substitutes and industry rivalry, and identifying disruptive threats and strategic levers shaping its pricing and profitability.
Customizable Excel Spreadsheet
One-sheet Porter's Five Forces for Galp Energia — quickly visualize competitive pressures across oil, gas and renewables with an editable radar chart and customizable inputs, ready to drop into board decks or integrate with broader Excel dashboards for fast strategic decisions.
Customers Bargaining Power
Wholesale fuel distributors
Large resellers and fleet customers secure volume discounts and branding terms, exercising high leverage given transparent pricing and low switching costs; wholesale channels account for over 60% of B2B volumes in Iberia. Galp sustains share via a 1,300+ forecourt network, loyalty programs and integrated logistics. Competitive tenders commonly compress margins, often reducing bid spreads by double digits in 2024.
Industrial gas & power offtakers
Energy-intensive industrial offtakers push for indexed, flexible contracts and risk-sharing, leveraging alternatives like multi-sourcing and corporate PPAs that strengthened buyer positions after global corporate PPA volumes exceeded 30 GW in 2023 and remained robust into 2024. Creditworthy corporates secure bespoke pricing, collateral and delivery terms. Galp responds with bundled fuel, power and services and emphasizes supply reliability to retain contracts.
Retail motorists & households
Price visibility at the pump and in power tariffs enables rapid switching by retail motorists and households, while loyalty programs and station convenience cut but do not remove price sensitivity; EVs, which accounted for about 14% of global car sales in 2023 per IEA and rose further in 2024, gradually erode road‑fuel dependence, and digital comparators increase buyer awareness and negotiating power.
Utilities and traders
Utilities and traders exert strong bargaining power: 2024 hub liquidity rose markedly, enabling arbitrage across TTF, NBP and power hubs and compressing margins in standard products; Galp offsets this by differentiating via green attributes and firming services, which preserve premium spreads; active risk management is required to maintain those spreads amid volatile short-term basis and shape risks.
- 2024 hub liquidity: elevated, enabling cross-hub arbitrage
- Compression: tighter margins on vanilla products
- Differentiation: green attributes and firming services reduce buyer leverage
- Key focus: balancing risk management to protect spreads
Government/regulated segments
Regulated tariffs set by Portugal’s regulator ERSE cap pass-through in gas and power, limiting Galp’s ability to transfer wholesale cost spikes to end customers and shifting volatility risk to suppliers.
Compliance with social tariff rules and grid obligations raises operating costs and constrains pricing freedom, while long-term regulated contracts and regulated-asset returns provide partial stability; EU ETS averaged near €100/tCO2 in 2024, pressuring supplier margins.
- Regulatory cap: ERSE-controlled tariffs reduce pass-through
- Risk shift: customers protected, suppliers bear volatility
- Cost pressure: compliance and social tariffs limit pricing
- Stability: long-term regulated returns partially mitigate asymmetry
B2B buyers (>60%) and utilities compress margins as EU ETS nears €100/tCO2
Large B2B buyers (wholesale >60% Iberia) and utilities/traders exert strong leverage, compressing margins despite Galp’s 1,300+ forecourts, loyalty programs and bundled offers. Energy‑intensive corporates (corporate PPA volumes >30 GW in 2023) demand indexed, flexible contracts; retail switching rises with EVs (~14% global car sales 2023). Regulation (ERSE caps) and EU ETS near €100/tCO2 in 2024 constrain pass‑through and press margins.
| Metric | 2024 value | Implication |
|---|---|---|
| Wholesale B2B share Iberia | >60% | High buyer leverage |
| Galp forecourts | 1,300+ | Retention tool |
| Corporate PPA | >30 GW (2023) | Stronger buyer options |
| EU ETS | ~€100/tCO2 | Margin pressure |
Preview the Actual Deliverable
Galp Energia Porter's Five Forces Analysis
This preview shows the exact Galp Energia Porter's Five Forces Analysis you'll receive immediately after purchase—no surprises, no placeholders. The file is fully formatted and ready for download and use the moment you buy. You’re previewing the final version, identical to your deliverable.











