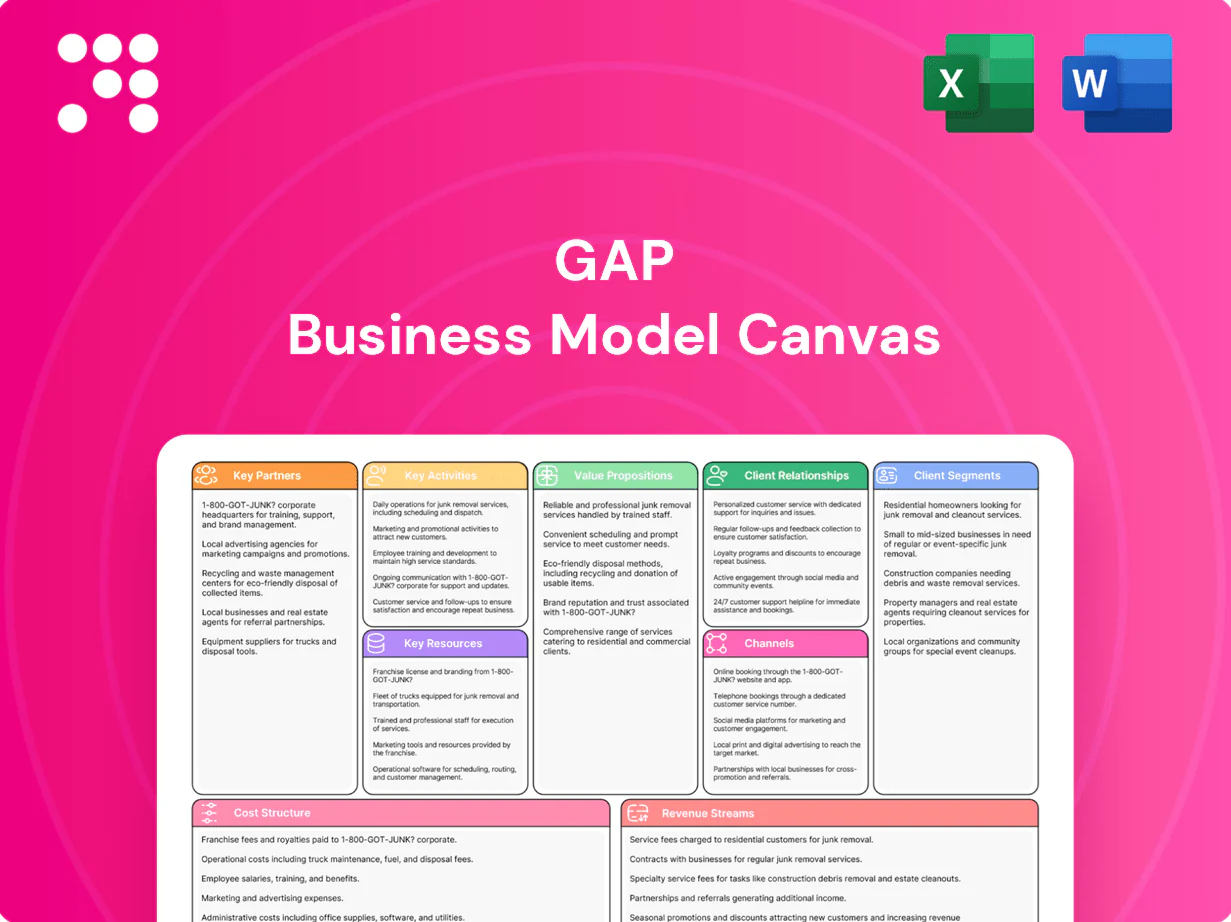
Gap Business Model Canvas

Unlock a leading retailer's Business Model Canvas: concise, actionable strategic insights
Unlock Gap’s strategic blueprint with our concise Business Model Canvas—three to five expertly analyzed sentences that reveal how Gap creates value, targets customers, and monetizes fashion at scale. Ideal for entrepreneurs, investors, and strategists seeking actionable insights. Purchase the full, editable Word and Excel canvas to benchmark, adapt, and execute with confidence.
Partnerships

Global sourcing and manufacturing partners
Contracted factories produce Gap apparel at scale, delivering cost and speed advantages across cut-and-sew, dyeing and finishing while providing compliance oversight.
Relationships extend to cut-and-sew, wet processing and final finishing operations with vendor scorecards and third-party audits, per Gap Inc. supplier practices in 2024.
Vendor scorecards and audits track quality, labor and environmental metrics, and strategic capacity reservations reduce lead-time volatility through reserved production slots.
Fabric mills and material innovators
Partnerships with fabric mills secure Gap Inc. access to core fabrics and seasonal innovations while supporting its goal of 100% sustainably sourced cotton, linen and hemp by 2025. Collaborations enable uptake of sustainable fibers, advanced stretch and performance blends as the textile sector accounts for roughly 10% of global carbon emissions. Long-term agreements stabilize pricing and availability; joint R&D creates brand-differentiated textiles.

Logistics, 3PL, and last-mile carriers
Third-party logistics manage Gap's regional distribution, seasonal warehousing and peak flex capacity, with 3PLs absorbing surges that can double volume during peak weeks; last-mile carriers handle e-commerce fulfillment and returns, where US apparel return rates average about 16%. Ocean, air and intermodal lanes are traded to balance cost versus speed, while network optimization can cut last-mile expense (about 50% of total shipping cost) and reduce delivery distances and CO2 emissions.

Technology, e-commerce, and payments providers
Technology partners—cloud platforms, OMS, POS, and analytics tools—power Gap’s omnichannel operations by unifying inventory, orders, and customer insights across web, app, and stores.
Payments partners enable secure checkout, BNPL options, and fraud prevention while martech stacks drive personalization, loyalty, and attribution; tight integrations improve site performance and app experiences.
- Cloud/OMS/POS/Analytics
- Payments: secure checkout, BNPL, fraud
- Martech: personalization, loyalty, attribution
- Integrations: faster site and app UX
Franchise operators and retail landlords
Franchise operators expand Gap brand presence in select international markets under agreements that specify assortment, brand standards, and royalty structures to protect brand consistency and margins. Mall and high-street landlords supply prime locations that drive foot traffic and sales velocity, while coordinated co-marketing and lease negotiations optimize store productivity and cost per square foot. These partnerships balance capital-light expansion with controlled brand governance.
- Franchise expansion: international market reach
- Agreements: assortment, standards, royalties
- Landlords: prime mall and high-street sites
- Optimizations: co-marketing and lease negotiations
Sustainable fabrics, audit-driven vendors, and agile 3PLs power omnichannel peak performance
Contracted factories and fabric mills secure scale, seasonal textiles and sustainability (Gap Inc. target: 100% sustainably sourced cotton/linen/hemp by 2025) while vendor scorecards and audits monitor quality, labor and enviro metrics. 3PLs absorb peak surges (volumes can double); last‑mile and payments partners enable omnichannel fulfillment and conversion.
| Partnership | Role | 2024 metric |
|---|---|---|
| Fabrics/Factories | Supply & compliance | 100% sustainable target by 2025 |
| 3PL/Carriers | Peak capacity | Peak volumes ×2 |
| Payments/Tech | Checkout & OMS | Returns ~16% |
What is included in the product
 Detailed Word Document
A comprehensive, pre-written Business Model Canvas for Gap Inc. detailing customer segments, channels, value propositions, revenue streams, cost structure, key activities, resources, partnerships and customer relationships. Ideal for presentations and investor discussions, it reflects real-world operations, includes competitive advantage analysis and SWOT-linked insights to support strategic decisions and validation using company data.

 Customizable Excel Spreadsheet
High-level view of Gap's business model with editable cells that quickly identify core components—product mix, channels, supply chain, and cost drivers—so teams can pinpoint and resolve operational pain points faster. Perfect for fast strategy tweaks, cross-functional alignment, and board-ready summaries.
Activities

Design and merchandising
Seasonal line planning aligns trends with core basics by brand, cycling 4–6 seasonal drops annually across 40+ markets. CAD, fit sessions, and wear testing refine silhouettes and quality, improving fit and reducing defects. Assortments are localized for climate and customer preferences, while pricing ladders are calibrated to balance perceived value and target gross margins near 40%.
Sourcing and quality assurance
Vendor selection, aggressive cost negotiations and capacity planning drive apparel COGS, typically around 50–60% of revenue in the retail clothing sector; strategic sourcing decisions directly affect gross margin. Inline inspections and lab testing validate durability and colorfastness against ASTM and ISO benchmarks. Robust compliance programs monitor labor and environmental standards across supplier tiers. Dual-sourcing across Asia and Latin America reduces single-source disruption risk.

Omnichannel retail operations
Store execution, visual merchandising, and optimized workforce scheduling drive conversion in Gap stores, supporting a digital penetration above 30% in 2024. E-commerce fulfillment, BOPIS and ship-from-store lift availability and can reduce fulfillment time by ~30%. Returns processing and reverse logistics curb the industry apparel e-commerce return rate of ~22% (2024), while real-time inventory visibility syncs across channels to cut stockouts.

Brand marketing and demand generation
Campaigns articulate each brand’s positioning and value through storytelling and consistent messaging; influencer, social and performance media drive traffic, with the influencer market valued at an estimated 21.1 billion in 2024. CRM and loyalty offers support retention and increase purchase frequency, while in-store events and experiential storytelling deepen engagement and brand affinity.
- Campaigns: positioning + value
- Channels: influencers, social, performance (2024 influencer market $21.1B)
- Retention: CRM + loyalty offers
- Engagement: in-store events & storytelling
Data analytics and inventory optimization
Data analytics at Gap drives demand forecasting and allocation to cut stockouts and markdowns—industry 2024 benchmarks show forecasting can lower stockouts up to 30% and markdowns ~20%. Size curves and regional clustering refine buys to reduce returns; basket analysis informs adjacencies and lifts AOV; test-and-learn improves pricing and promo ROI by about 15%.
- forecast: -30% stockouts
- markdowns: -20%
- promo ROI: +15%
Data-led omnichannel retail: 4-6 seasonal drops, >30% digital, ~40% gross margin
Seasonal line planning cycles 4–6 drops across 40+ markets, targeting ~40% gross margin; COGS ~50–60% of revenue. Omnichannel fulfillment raises digital penetration >30% and cuts fulfillment time ~30%; returns rate ~22% (2024). Data-led forecasting lowers stockouts ~30% and markdowns ~20%, improving promo ROI ~15%.
| Metric | Value (2024) |
|---|---|
| Seasonal drops | 4–6/yr |
| Markets | 40+ |
| Gross margin target | ~40% |
| COGS | 50–60% rev |
| Digital penetration | >30% |
| Returns rate | ~22% |
| Stockout reduction | ~30% |
| Markdown reduction | ~20% |
| Promo ROI lift | ~15% |
Delivered as Displayed
Business Model Canvas
The document you're previewing is the actual Gap Business Model Canvas you’ll receive after purchase. It’s not a mockup—this live preview shows the exact structure, content and layout of the final file. After buying you’ll get the complete, editable deliverable ready to present or edit. No surprises.

Unlock a leading retailer's Business Model Canvas: concise, actionable strategic insights
Unlock Gap’s strategic blueprint with our concise Business Model Canvas—three to five expertly analyzed sentences that reveal how Gap creates value, targets customers, and monetizes fashion at scale. Ideal for entrepreneurs, investors, and strategists seeking actionable insights. Purchase the full, editable Word and Excel canvas to benchmark, adapt, and execute with confidence.
Partnerships
Global sourcing and manufacturing partners
Contracted factories produce Gap apparel at scale, delivering cost and speed advantages across cut-and-sew, dyeing and finishing while providing compliance oversight.
Relationships extend to cut-and-sew, wet processing and final finishing operations with vendor scorecards and third-party audits, per Gap Inc. supplier practices in 2024.
Vendor scorecards and audits track quality, labor and environmental metrics, and strategic capacity reservations reduce lead-time volatility through reserved production slots.
Fabric mills and material innovators
Partnerships with fabric mills secure Gap Inc. access to core fabrics and seasonal innovations while supporting its goal of 100% sustainably sourced cotton, linen and hemp by 2025. Collaborations enable uptake of sustainable fibers, advanced stretch and performance blends as the textile sector accounts for roughly 10% of global carbon emissions. Long-term agreements stabilize pricing and availability; joint R&D creates brand-differentiated textiles.
Logistics, 3PL, and last-mile carriers
Third-party logistics manage Gap's regional distribution, seasonal warehousing and peak flex capacity, with 3PLs absorbing surges that can double volume during peak weeks; last-mile carriers handle e-commerce fulfillment and returns, where US apparel return rates average about 16%. Ocean, air and intermodal lanes are traded to balance cost versus speed, while network optimization can cut last-mile expense (about 50% of total shipping cost) and reduce delivery distances and CO2 emissions.
Technology, e-commerce, and payments providers
Technology partners—cloud platforms, OMS, POS, and analytics tools—power Gap’s omnichannel operations by unifying inventory, orders, and customer insights across web, app, and stores.
Payments partners enable secure checkout, BNPL options, and fraud prevention while martech stacks drive personalization, loyalty, and attribution; tight integrations improve site performance and app experiences.
- Cloud/OMS/POS/Analytics
- Payments: secure checkout, BNPL, fraud
- Martech: personalization, loyalty, attribution
- Integrations: faster site and app UX
Franchise operators and retail landlords
Franchise operators expand Gap brand presence in select international markets under agreements that specify assortment, brand standards, and royalty structures to protect brand consistency and margins. Mall and high-street landlords supply prime locations that drive foot traffic and sales velocity, while coordinated co-marketing and lease negotiations optimize store productivity and cost per square foot. These partnerships balance capital-light expansion with controlled brand governance.
- Franchise expansion: international market reach
- Agreements: assortment, standards, royalties
- Landlords: prime mall and high-street sites
- Optimizations: co-marketing and lease negotiations
Sustainable fabrics, audit-driven vendors, and agile 3PLs power omnichannel peak performance
Contracted factories and fabric mills secure scale, seasonal textiles and sustainability (Gap Inc. target: 100% sustainably sourced cotton/linen/hemp by 2025) while vendor scorecards and audits monitor quality, labor and enviro metrics. 3PLs absorb peak surges (volumes can double); last‑mile and payments partners enable omnichannel fulfillment and conversion.
| Partnership | Role | 2024 metric |
|---|---|---|
| Fabrics/Factories | Supply & compliance | 100% sustainable target by 2025 |
| 3PL/Carriers | Peak capacity | Peak volumes ×2 |
| Payments/Tech | Checkout & OMS | Returns ~16% |
What is included in the product
Detailed Word Document
A comprehensive, pre-written Business Model Canvas for Gap Inc. detailing customer segments, channels, value propositions, revenue streams, cost structure, key activities, resources, partnerships and customer relationships. Ideal for presentations and investor discussions, it reflects real-world operations, includes competitive advantage analysis and SWOT-linked insights to support strategic decisions and validation using company data.
Customizable Excel Spreadsheet
High-level view of Gap's business model with editable cells that quickly identify core components—product mix, channels, supply chain, and cost drivers—so teams can pinpoint and resolve operational pain points faster. Perfect for fast strategy tweaks, cross-functional alignment, and board-ready summaries.
Activities
Design and merchandising
Seasonal line planning aligns trends with core basics by brand, cycling 4–6 seasonal drops annually across 40+ markets. CAD, fit sessions, and wear testing refine silhouettes and quality, improving fit and reducing defects. Assortments are localized for climate and customer preferences, while pricing ladders are calibrated to balance perceived value and target gross margins near 40%.
Sourcing and quality assurance
Vendor selection, aggressive cost negotiations and capacity planning drive apparel COGS, typically around 50–60% of revenue in the retail clothing sector; strategic sourcing decisions directly affect gross margin. Inline inspections and lab testing validate durability and colorfastness against ASTM and ISO benchmarks. Robust compliance programs monitor labor and environmental standards across supplier tiers. Dual-sourcing across Asia and Latin America reduces single-source disruption risk.
Omnichannel retail operations
Store execution, visual merchandising, and optimized workforce scheduling drive conversion in Gap stores, supporting a digital penetration above 30% in 2024. E-commerce fulfillment, BOPIS and ship-from-store lift availability and can reduce fulfillment time by ~30%. Returns processing and reverse logistics curb the industry apparel e-commerce return rate of ~22% (2024), while real-time inventory visibility syncs across channels to cut stockouts.
Brand marketing and demand generation
Campaigns articulate each brand’s positioning and value through storytelling and consistent messaging; influencer, social and performance media drive traffic, with the influencer market valued at an estimated 21.1 billion in 2024. CRM and loyalty offers support retention and increase purchase frequency, while in-store events and experiential storytelling deepen engagement and brand affinity.
- Campaigns: positioning + value
- Channels: influencers, social, performance (2024 influencer market $21.1B)
- Retention: CRM + loyalty offers
- Engagement: in-store events & storytelling
Data analytics and inventory optimization
Data analytics at Gap drives demand forecasting and allocation to cut stockouts and markdowns—industry 2024 benchmarks show forecasting can lower stockouts up to 30% and markdowns ~20%. Size curves and regional clustering refine buys to reduce returns; basket analysis informs adjacencies and lifts AOV; test-and-learn improves pricing and promo ROI by about 15%.
- forecast: -30% stockouts
- markdowns: -20%
- promo ROI: +15%
Data-led omnichannel retail: 4-6 seasonal drops, >30% digital, ~40% gross margin
Seasonal line planning cycles 4–6 drops across 40+ markets, targeting ~40% gross margin; COGS ~50–60% of revenue. Omnichannel fulfillment raises digital penetration >30% and cuts fulfillment time ~30%; returns rate ~22% (2024). Data-led forecasting lowers stockouts ~30% and markdowns ~20%, improving promo ROI ~15%.
| Metric | Value (2024) |
|---|---|
| Seasonal drops | 4–6/yr |
| Markets | 40+ |
| Gross margin target | ~40% |
| COGS | 50–60% rev |
| Digital penetration | >30% |
| Returns rate | ~22% |
| Stockout reduction | ~30% |
| Markdown reduction | ~20% |
| Promo ROI lift | ~15% |
Delivered as Displayed
Business Model Canvas
The document you're previewing is the actual Gap Business Model Canvas you’ll receive after purchase. It’s not a mockup—this live preview shows the exact structure, content and layout of the final file. After buying you’ll get the complete, editable deliverable ready to present or edit. No surprises.
Original: $10.00
-65%$10.00
$3.50Description
Unlock a leading retailer's Business Model Canvas: concise, actionable strategic insights
Unlock Gap’s strategic blueprint with our concise Business Model Canvas—three to five expertly analyzed sentences that reveal how Gap creates value, targets customers, and monetizes fashion at scale. Ideal for entrepreneurs, investors, and strategists seeking actionable insights. Purchase the full, editable Word and Excel canvas to benchmark, adapt, and execute with confidence.
Partnerships
Global sourcing and manufacturing partners
Contracted factories produce Gap apparel at scale, delivering cost and speed advantages across cut-and-sew, dyeing and finishing while providing compliance oversight.
Relationships extend to cut-and-sew, wet processing and final finishing operations with vendor scorecards and third-party audits, per Gap Inc. supplier practices in 2024.
Vendor scorecards and audits track quality, labor and environmental metrics, and strategic capacity reservations reduce lead-time volatility through reserved production slots.
Fabric mills and material innovators
Partnerships with fabric mills secure Gap Inc. access to core fabrics and seasonal innovations while supporting its goal of 100% sustainably sourced cotton, linen and hemp by 2025. Collaborations enable uptake of sustainable fibers, advanced stretch and performance blends as the textile sector accounts for roughly 10% of global carbon emissions. Long-term agreements stabilize pricing and availability; joint R&D creates brand-differentiated textiles.
Logistics, 3PL, and last-mile carriers
Third-party logistics manage Gap's regional distribution, seasonal warehousing and peak flex capacity, with 3PLs absorbing surges that can double volume during peak weeks; last-mile carriers handle e-commerce fulfillment and returns, where US apparel return rates average about 16%. Ocean, air and intermodal lanes are traded to balance cost versus speed, while network optimization can cut last-mile expense (about 50% of total shipping cost) and reduce delivery distances and CO2 emissions.
Technology, e-commerce, and payments providers
Technology partners—cloud platforms, OMS, POS, and analytics tools—power Gap’s omnichannel operations by unifying inventory, orders, and customer insights across web, app, and stores.
Payments partners enable secure checkout, BNPL options, and fraud prevention while martech stacks drive personalization, loyalty, and attribution; tight integrations improve site performance and app experiences.
- Cloud/OMS/POS/Analytics
- Payments: secure checkout, BNPL, fraud
- Martech: personalization, loyalty, attribution
- Integrations: faster site and app UX
Franchise operators and retail landlords
Franchise operators expand Gap brand presence in select international markets under agreements that specify assortment, brand standards, and royalty structures to protect brand consistency and margins. Mall and high-street landlords supply prime locations that drive foot traffic and sales velocity, while coordinated co-marketing and lease negotiations optimize store productivity and cost per square foot. These partnerships balance capital-light expansion with controlled brand governance.
- Franchise expansion: international market reach
- Agreements: assortment, standards, royalties
- Landlords: prime mall and high-street sites
- Optimizations: co-marketing and lease negotiations
Sustainable fabrics, audit-driven vendors, and agile 3PLs power omnichannel peak performance
Contracted factories and fabric mills secure scale, seasonal textiles and sustainability (Gap Inc. target: 100% sustainably sourced cotton/linen/hemp by 2025) while vendor scorecards and audits monitor quality, labor and enviro metrics. 3PLs absorb peak surges (volumes can double); last‑mile and payments partners enable omnichannel fulfillment and conversion.
| Partnership | Role | 2024 metric |
|---|---|---|
| Fabrics/Factories | Supply & compliance | 100% sustainable target by 2025 |
| 3PL/Carriers | Peak capacity | Peak volumes ×2 |
| Payments/Tech | Checkout & OMS | Returns ~16% |
What is included in the product
Detailed Word Document
A comprehensive, pre-written Business Model Canvas for Gap Inc. detailing customer segments, channels, value propositions, revenue streams, cost structure, key activities, resources, partnerships and customer relationships. Ideal for presentations and investor discussions, it reflects real-world operations, includes competitive advantage analysis and SWOT-linked insights to support strategic decisions and validation using company data.
Customizable Excel Spreadsheet
High-level view of Gap's business model with editable cells that quickly identify core components—product mix, channels, supply chain, and cost drivers—so teams can pinpoint and resolve operational pain points faster. Perfect for fast strategy tweaks, cross-functional alignment, and board-ready summaries.
Activities
Design and merchandising
Seasonal line planning aligns trends with core basics by brand, cycling 4–6 seasonal drops annually across 40+ markets. CAD, fit sessions, and wear testing refine silhouettes and quality, improving fit and reducing defects. Assortments are localized for climate and customer preferences, while pricing ladders are calibrated to balance perceived value and target gross margins near 40%.
Sourcing and quality assurance
Vendor selection, aggressive cost negotiations and capacity planning drive apparel COGS, typically around 50–60% of revenue in the retail clothing sector; strategic sourcing decisions directly affect gross margin. Inline inspections and lab testing validate durability and colorfastness against ASTM and ISO benchmarks. Robust compliance programs monitor labor and environmental standards across supplier tiers. Dual-sourcing across Asia and Latin America reduces single-source disruption risk.
Omnichannel retail operations
Store execution, visual merchandising, and optimized workforce scheduling drive conversion in Gap stores, supporting a digital penetration above 30% in 2024. E-commerce fulfillment, BOPIS and ship-from-store lift availability and can reduce fulfillment time by ~30%. Returns processing and reverse logistics curb the industry apparel e-commerce return rate of ~22% (2024), while real-time inventory visibility syncs across channels to cut stockouts.
Brand marketing and demand generation
Campaigns articulate each brand’s positioning and value through storytelling and consistent messaging; influencer, social and performance media drive traffic, with the influencer market valued at an estimated 21.1 billion in 2024. CRM and loyalty offers support retention and increase purchase frequency, while in-store events and experiential storytelling deepen engagement and brand affinity.
- Campaigns: positioning + value
- Channels: influencers, social, performance (2024 influencer market $21.1B)
- Retention: CRM + loyalty offers
- Engagement: in-store events & storytelling
Data analytics and inventory optimization
Data analytics at Gap drives demand forecasting and allocation to cut stockouts and markdowns—industry 2024 benchmarks show forecasting can lower stockouts up to 30% and markdowns ~20%. Size curves and regional clustering refine buys to reduce returns; basket analysis informs adjacencies and lifts AOV; test-and-learn improves pricing and promo ROI by about 15%.
- forecast: -30% stockouts
- markdowns: -20%
- promo ROI: +15%
Data-led omnichannel retail: 4-6 seasonal drops, >30% digital, ~40% gross margin
Seasonal line planning cycles 4–6 drops across 40+ markets, targeting ~40% gross margin; COGS ~50–60% of revenue. Omnichannel fulfillment raises digital penetration >30% and cuts fulfillment time ~30%; returns rate ~22% (2024). Data-led forecasting lowers stockouts ~30% and markdowns ~20%, improving promo ROI ~15%.
| Metric | Value (2024) |
|---|---|
| Seasonal drops | 4–6/yr |
| Markets | 40+ |
| Gross margin target | ~40% |
| COGS | 50–60% rev |
| Digital penetration | >30% |
| Returns rate | ~22% |
| Stockout reduction | ~30% |
| Markdown reduction | ~20% |
| Promo ROI lift | ~15% |
Delivered as Displayed
Business Model Canvas
The document you're previewing is the actual Gap Business Model Canvas you’ll receive after purchase. It’s not a mockup—this live preview shows the exact structure, content and layout of the final file. After buying you’ll get the complete, editable deliverable ready to present or edit. No surprises.











