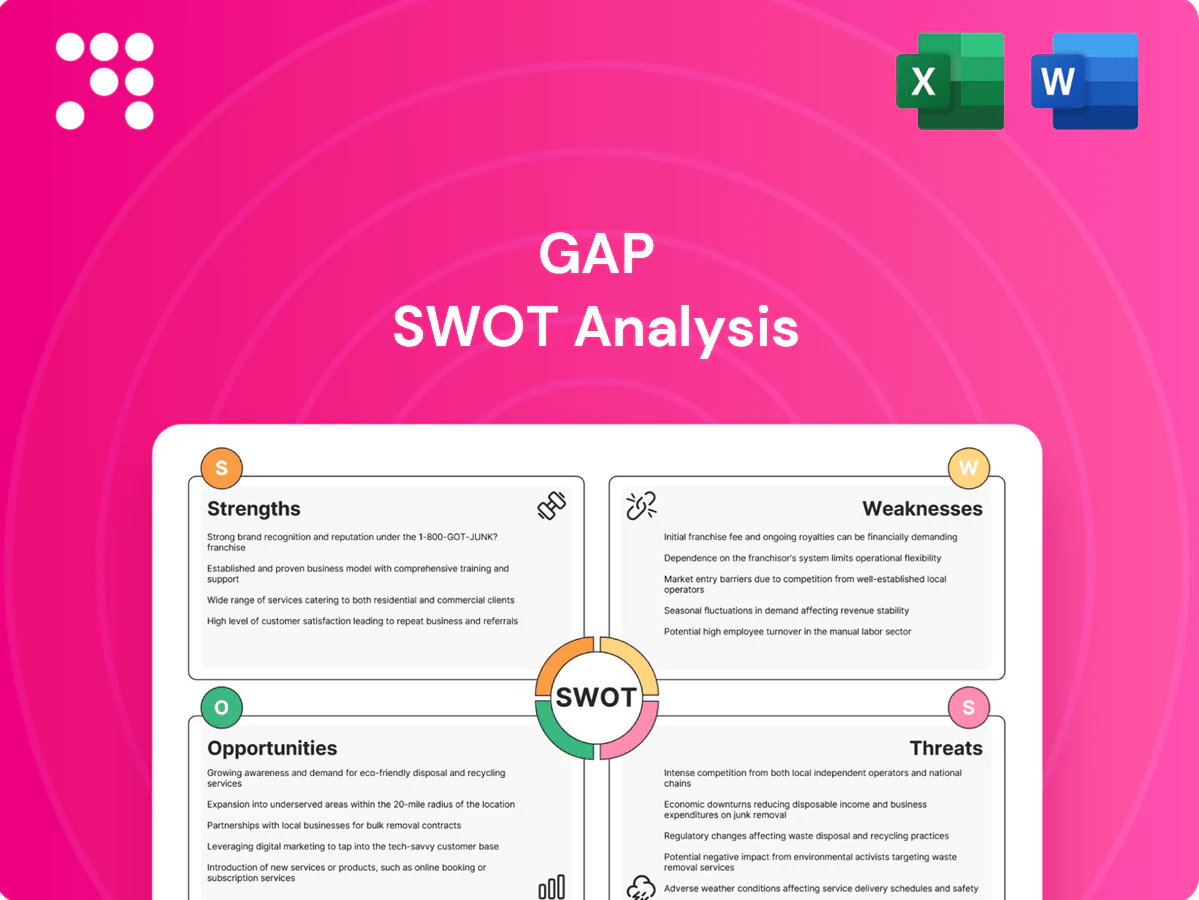
Gap SWOT Analysis

Your Strategic Toolkit Starts Here
Gap’s SWOT snapshot highlights strong brand recognition and omnichannel strengths, but also exposure to shifting fashion trends and margin pressure from promotions. Our full SWOT unpacks competitive threats, supply-chain risks, and concrete growth levers with financial context. Purchase the complete, editable report to plan strategies, present findings, or inform investment decisions.
Strengths

Multi-brand portfolio breadth
Gap Inc. spans Gap, Old Navy, Banana Republic and Athleta, covering value to premium and performance niches; Old Navy contributes roughly half of company sales while Athleta surpassed $1.5 billion in annual revenue, diversifying revenue streams. This brand mix spreads demand risk and captures varied consumer segments and occasions. Cross-brand insights drive merchandising synergies and assortment optimization, and shared corporate services improve capital efficiency and lower per-unit overhead.
Omnichannel scale and reach
Gap Inc operates company-owned stores, franchises and robust e-commerce across 40+ countries and four core brands, giving it significant omnichannel scale. Buy-online-pickup-in-store, ship-from-store and flexible returns improve conversion rates and reduce fulfillment costs. A broad physical footprint boosts brand visibility and consumer trust. Integrated digital and store data enhances personalization and inventory productivity.

Operational know-how in apparel
Gap's operational know-how stems from over 55 years since founding in 1969, underpinning sourcing, quality control and durable vendor relationships. Institutional strengths in seasonal planning, allocation and size-curve management support the three core private-label brands Old Navy, Gap and Banana Republic. Private-label control and scale purchasing across these brands improve margins versus wholesale and strengthen cost and lead-time negotiation.

Athleta and activewear positioning
Athleta provides Gap exposure to the resilient athleisure/performance category with strong brand equity among women; the brand surpassed $1 billion in annual sales in 2019 and has been Gap Inc.’s strategic growth engine. Higher full-price sell-through and community engagement improve unit economics, and product positioning taps wellness and sustainability trends while diversifying away from cyclical basics.
- Resilient category exposure
- Over $1B sales (2019)
- Higher full-price sell-through
- Wellness & sustainability aligned
Brand recognition and loyalty
Gap and Old Navy retain high North American awareness across generations; Gap Inc. reported about 13.7 billion USD in net sales in FY2023, funding broad marketing reach. Loyalty programs exceed 30 million members, enabling precise, targeted promotions. Iconic basics—denim, tees, kids—drive frequent repeat purchases and uniform supply contracts.
- High multi‑generational awareness
- ~13.7B USD FY2023 sales
- >30M loyalty members
- Iconic basics → repeat buys
- Marketing scale across channels
Multi-brand apparel group: ~13.7B sales, 50% share, 30M members
Gap Inc.’s multi‑brand portfolio (Gap, Old Navy, Banana Republic, Athleta) spans value to premium, with Old Navy ~50% of sales and Athleta driving growth. Omnichannel scale across 40+ countries and >30M loyalty members boosts conversion and inventory efficiency. Longstanding sourcing, private‑label scale and ~$13.7B FY2023 sales underpin margin and negotiating strength.
| Metric | Value |
|---|---|
| FY2023 Net Sales | ~13.7B USD |
| Old Navy share | ~50% |
| Athleta revenue | >1.5B USD |
| Loyalty members | >30M |
What is included in the product
 Detailed Word Document
Delivers a strategic overview of Gap’s internal and external business factors, outlining strengths, weaknesses, opportunities, and threats that shape its competitive position and future growth.

 Customizable Excel Spreadsheet
Highlights strategic gaps with a concise SWOT matrix to prioritize corrective actions and resource allocation quickly, speeding alignment across teams.
Weaknesses

Brand dilution at core Gap
Inconsistent fashion direction and logo overexposure have eroded Gap’s pricing power, contributing to softer full-year net sales of about $14.2 billion in FY2024 and lower sell-through versus peers. Frequent promotions have trained customers to wait for discounts, pressuring margins and driving higher clearance inventory. Rebuilding brand identity will require significant time and elevated marketing spend, weighing on gross margins relative to stronger-margin rivals.
Inventory and fashion missteps
Historically Gap's misses in color, fit and trend timing have driven frequent markdowns and inventory write-downs, reflecting a slow response to shifting demand. Long lead times of traditional retail development—commonly 3–9 months versus ultra-fast players like Shein (7–14 days) or Zara (2–4 weeks)—limit agility. Imbalanced size and pack assortments increase simultaneous stock-outs and overstock across channels. This volatility strains working capital and compresses cash flow.

U.S.-centric revenue base
Heavy dependence on North America leaves Gap excessively exposed to a single macro cycle, with the bulk of sales generated domestically. International operations remain smaller and inconsistent, reducing revenue stability. Under-penetration abroad limits diversification benefits and growth optionality. Scaling internationally requires localized assortments and higher SG&A, pressuring margins during expansion.

Store productivity variability
Legacy mall locations show sustained foot-traffic declines versus pre‑pandemic levels, keeping occupancy cost burdens high per industry footfall and leasing reports.
Ongoing fleet optimization and targeted closures have triggered restructuring charges and lease exit costs in recent fiscal cycles.
Wide four‑wall economics variance complicates capital allocation as store remodel budgets compete directly with digital and omnichannel investments.
- mall traffic below 2019 benchmarks per industry trackers
- store closures incur restructuring/lease exit costs
- top stores drive majority profitability, many underperform
- capex tradeoff: remodels vs digital
Margin sensitivity to promotions
Gap's reliance on frequent discounts to match competitive traffic compresses gross margins, with retail promo intensity rising to about 40% industry-wide in 2024, increasing markdown pressure during downturns.
High promotional dependence can erode brand perception over time and dilute full-price sales, while marketing efficiency falls when offers dominate messaging and acquisition costs rise.
- Margin squeeze: promo-driven gross margin decline of several percentage points
- Brand risk: repeated discounts weaken premium positioning
- Marketing drag: higher CAC when promotions lead communications
Apparel retailer’s weak design and heavy promos erode pricing; sales $14.2B
Inconsistent fashion direction and logo overexposure weakened Gap’s pricing power, contributing to FY2024 net sales of about $14.2 billion and lower sell‑through versus peers. Heavy promotional intensity (around 40% industrywide in 2024) squeezed gross margins and trained customers to wait for discounts. Dependence on North America and legacy mall footprint limit diversification and keep occupancy costs high.
| Metric | Value (2024) |
|---|---|
| Net sales | $14.2B |
| Promo intensity (industry) | ~40% |
| Mall foot traffic | Below 2019 benchmarks (industry trackers) |
Same Document Delivered
Gap SWOT Analysis
This is the actual Gap SWOT analysis document you’ll receive upon purchase—no surprises, just professional quality. The preview below is taken directly from the full report you'll get; purchase unlocks the complete, editable version. You’re viewing a live preview of the real file—buy to download the full, detailed analysis immediately.

Your Strategic Toolkit Starts Here
Gap’s SWOT snapshot highlights strong brand recognition and omnichannel strengths, but also exposure to shifting fashion trends and margin pressure from promotions. Our full SWOT unpacks competitive threats, supply-chain risks, and concrete growth levers with financial context. Purchase the complete, editable report to plan strategies, present findings, or inform investment decisions.
Strengths
Multi-brand portfolio breadth
Gap Inc. spans Gap, Old Navy, Banana Republic and Athleta, covering value to premium and performance niches; Old Navy contributes roughly half of company sales while Athleta surpassed $1.5 billion in annual revenue, diversifying revenue streams. This brand mix spreads demand risk and captures varied consumer segments and occasions. Cross-brand insights drive merchandising synergies and assortment optimization, and shared corporate services improve capital efficiency and lower per-unit overhead.
Omnichannel scale and reach
Gap Inc operates company-owned stores, franchises and robust e-commerce across 40+ countries and four core brands, giving it significant omnichannel scale. Buy-online-pickup-in-store, ship-from-store and flexible returns improve conversion rates and reduce fulfillment costs. A broad physical footprint boosts brand visibility and consumer trust. Integrated digital and store data enhances personalization and inventory productivity.
Operational know-how in apparel
Gap's operational know-how stems from over 55 years since founding in 1969, underpinning sourcing, quality control and durable vendor relationships. Institutional strengths in seasonal planning, allocation and size-curve management support the three core private-label brands Old Navy, Gap and Banana Republic. Private-label control and scale purchasing across these brands improve margins versus wholesale and strengthen cost and lead-time negotiation.
Athleta and activewear positioning
Athleta provides Gap exposure to the resilient athleisure/performance category with strong brand equity among women; the brand surpassed $1 billion in annual sales in 2019 and has been Gap Inc.’s strategic growth engine. Higher full-price sell-through and community engagement improve unit economics, and product positioning taps wellness and sustainability trends while diversifying away from cyclical basics.
- Resilient category exposure
- Over $1B sales (2019)
- Higher full-price sell-through
- Wellness & sustainability aligned
Brand recognition and loyalty
Gap and Old Navy retain high North American awareness across generations; Gap Inc. reported about 13.7 billion USD in net sales in FY2023, funding broad marketing reach. Loyalty programs exceed 30 million members, enabling precise, targeted promotions. Iconic basics—denim, tees, kids—drive frequent repeat purchases and uniform supply contracts.
- High multi‑generational awareness
- ~13.7B USD FY2023 sales
- >30M loyalty members
- Iconic basics → repeat buys
- Marketing scale across channels
Multi-brand apparel group: ~13.7B sales, 50% share, 30M members
Gap Inc.’s multi‑brand portfolio (Gap, Old Navy, Banana Republic, Athleta) spans value to premium, with Old Navy ~50% of sales and Athleta driving growth. Omnichannel scale across 40+ countries and >30M loyalty members boosts conversion and inventory efficiency. Longstanding sourcing, private‑label scale and ~$13.7B FY2023 sales underpin margin and negotiating strength.
| Metric | Value |
|---|---|
| FY2023 Net Sales | ~13.7B USD |
| Old Navy share | ~50% |
| Athleta revenue | >1.5B USD |
| Loyalty members | >30M |
What is included in the product
Detailed Word Document
Delivers a strategic overview of Gap’s internal and external business factors, outlining strengths, weaknesses, opportunities, and threats that shape its competitive position and future growth.
Customizable Excel Spreadsheet
Highlights strategic gaps with a concise SWOT matrix to prioritize corrective actions and resource allocation quickly, speeding alignment across teams.
Weaknesses
Brand dilution at core Gap
Inconsistent fashion direction and logo overexposure have eroded Gap’s pricing power, contributing to softer full-year net sales of about $14.2 billion in FY2024 and lower sell-through versus peers. Frequent promotions have trained customers to wait for discounts, pressuring margins and driving higher clearance inventory. Rebuilding brand identity will require significant time and elevated marketing spend, weighing on gross margins relative to stronger-margin rivals.
Inventory and fashion missteps
Historically Gap's misses in color, fit and trend timing have driven frequent markdowns and inventory write-downs, reflecting a slow response to shifting demand. Long lead times of traditional retail development—commonly 3–9 months versus ultra-fast players like Shein (7–14 days) or Zara (2–4 weeks)—limit agility. Imbalanced size and pack assortments increase simultaneous stock-outs and overstock across channels. This volatility strains working capital and compresses cash flow.
U.S.-centric revenue base
Heavy dependence on North America leaves Gap excessively exposed to a single macro cycle, with the bulk of sales generated domestically. International operations remain smaller and inconsistent, reducing revenue stability. Under-penetration abroad limits diversification benefits and growth optionality. Scaling internationally requires localized assortments and higher SG&A, pressuring margins during expansion.
Store productivity variability
Legacy mall locations show sustained foot-traffic declines versus pre‑pandemic levels, keeping occupancy cost burdens high per industry footfall and leasing reports.
Ongoing fleet optimization and targeted closures have triggered restructuring charges and lease exit costs in recent fiscal cycles.
Wide four‑wall economics variance complicates capital allocation as store remodel budgets compete directly with digital and omnichannel investments.
- mall traffic below 2019 benchmarks per industry trackers
- store closures incur restructuring/lease exit costs
- top stores drive majority profitability, many underperform
- capex tradeoff: remodels vs digital
Margin sensitivity to promotions
Gap's reliance on frequent discounts to match competitive traffic compresses gross margins, with retail promo intensity rising to about 40% industry-wide in 2024, increasing markdown pressure during downturns.
High promotional dependence can erode brand perception over time and dilute full-price sales, while marketing efficiency falls when offers dominate messaging and acquisition costs rise.
- Margin squeeze: promo-driven gross margin decline of several percentage points
- Brand risk: repeated discounts weaken premium positioning
- Marketing drag: higher CAC when promotions lead communications
Apparel retailer’s weak design and heavy promos erode pricing; sales $14.2B
Inconsistent fashion direction and logo overexposure weakened Gap’s pricing power, contributing to FY2024 net sales of about $14.2 billion and lower sell‑through versus peers. Heavy promotional intensity (around 40% industrywide in 2024) squeezed gross margins and trained customers to wait for discounts. Dependence on North America and legacy mall footprint limit diversification and keep occupancy costs high.
| Metric | Value (2024) |
|---|---|
| Net sales | $14.2B |
| Promo intensity (industry) | ~40% |
| Mall foot traffic | Below 2019 benchmarks (industry trackers) |
Same Document Delivered
Gap SWOT Analysis
This is the actual Gap SWOT analysis document you’ll receive upon purchase—no surprises, just professional quality. The preview below is taken directly from the full report you'll get; purchase unlocks the complete, editable version. You’re viewing a live preview of the real file—buy to download the full, detailed analysis immediately.
Description
Your Strategic Toolkit Starts Here
Gap’s SWOT snapshot highlights strong brand recognition and omnichannel strengths, but also exposure to shifting fashion trends and margin pressure from promotions. Our full SWOT unpacks competitive threats, supply-chain risks, and concrete growth levers with financial context. Purchase the complete, editable report to plan strategies, present findings, or inform investment decisions.
Strengths
Multi-brand portfolio breadth
Gap Inc. spans Gap, Old Navy, Banana Republic and Athleta, covering value to premium and performance niches; Old Navy contributes roughly half of company sales while Athleta surpassed $1.5 billion in annual revenue, diversifying revenue streams. This brand mix spreads demand risk and captures varied consumer segments and occasions. Cross-brand insights drive merchandising synergies and assortment optimization, and shared corporate services improve capital efficiency and lower per-unit overhead.
Omnichannel scale and reach
Gap Inc operates company-owned stores, franchises and robust e-commerce across 40+ countries and four core brands, giving it significant omnichannel scale. Buy-online-pickup-in-store, ship-from-store and flexible returns improve conversion rates and reduce fulfillment costs. A broad physical footprint boosts brand visibility and consumer trust. Integrated digital and store data enhances personalization and inventory productivity.
Operational know-how in apparel
Gap's operational know-how stems from over 55 years since founding in 1969, underpinning sourcing, quality control and durable vendor relationships. Institutional strengths in seasonal planning, allocation and size-curve management support the three core private-label brands Old Navy, Gap and Banana Republic. Private-label control and scale purchasing across these brands improve margins versus wholesale and strengthen cost and lead-time negotiation.
Athleta and activewear positioning
Athleta provides Gap exposure to the resilient athleisure/performance category with strong brand equity among women; the brand surpassed $1 billion in annual sales in 2019 and has been Gap Inc.’s strategic growth engine. Higher full-price sell-through and community engagement improve unit economics, and product positioning taps wellness and sustainability trends while diversifying away from cyclical basics.
- Resilient category exposure
- Over $1B sales (2019)
- Higher full-price sell-through
- Wellness & sustainability aligned
Brand recognition and loyalty
Gap and Old Navy retain high North American awareness across generations; Gap Inc. reported about 13.7 billion USD in net sales in FY2023, funding broad marketing reach. Loyalty programs exceed 30 million members, enabling precise, targeted promotions. Iconic basics—denim, tees, kids—drive frequent repeat purchases and uniform supply contracts.
- High multi‑generational awareness
- ~13.7B USD FY2023 sales
- >30M loyalty members
- Iconic basics → repeat buys
- Marketing scale across channels
Multi-brand apparel group: ~13.7B sales, 50% share, 30M members
Gap Inc.’s multi‑brand portfolio (Gap, Old Navy, Banana Republic, Athleta) spans value to premium, with Old Navy ~50% of sales and Athleta driving growth. Omnichannel scale across 40+ countries and >30M loyalty members boosts conversion and inventory efficiency. Longstanding sourcing, private‑label scale and ~$13.7B FY2023 sales underpin margin and negotiating strength.
| Metric | Value |
|---|---|
| FY2023 Net Sales | ~13.7B USD |
| Old Navy share | ~50% |
| Athleta revenue | >1.5B USD |
| Loyalty members | >30M |
What is included in the product
Detailed Word Document
Delivers a strategic overview of Gap’s internal and external business factors, outlining strengths, weaknesses, opportunities, and threats that shape its competitive position and future growth.
Customizable Excel Spreadsheet
Highlights strategic gaps with a concise SWOT matrix to prioritize corrective actions and resource allocation quickly, speeding alignment across teams.
Weaknesses
Brand dilution at core Gap
Inconsistent fashion direction and logo overexposure have eroded Gap’s pricing power, contributing to softer full-year net sales of about $14.2 billion in FY2024 and lower sell-through versus peers. Frequent promotions have trained customers to wait for discounts, pressuring margins and driving higher clearance inventory. Rebuilding brand identity will require significant time and elevated marketing spend, weighing on gross margins relative to stronger-margin rivals.
Inventory and fashion missteps
Historically Gap's misses in color, fit and trend timing have driven frequent markdowns and inventory write-downs, reflecting a slow response to shifting demand. Long lead times of traditional retail development—commonly 3–9 months versus ultra-fast players like Shein (7–14 days) or Zara (2–4 weeks)—limit agility. Imbalanced size and pack assortments increase simultaneous stock-outs and overstock across channels. This volatility strains working capital and compresses cash flow.
U.S.-centric revenue base
Heavy dependence on North America leaves Gap excessively exposed to a single macro cycle, with the bulk of sales generated domestically. International operations remain smaller and inconsistent, reducing revenue stability. Under-penetration abroad limits diversification benefits and growth optionality. Scaling internationally requires localized assortments and higher SG&A, pressuring margins during expansion.
Store productivity variability
Legacy mall locations show sustained foot-traffic declines versus pre‑pandemic levels, keeping occupancy cost burdens high per industry footfall and leasing reports.
Ongoing fleet optimization and targeted closures have triggered restructuring charges and lease exit costs in recent fiscal cycles.
Wide four‑wall economics variance complicates capital allocation as store remodel budgets compete directly with digital and omnichannel investments.
- mall traffic below 2019 benchmarks per industry trackers
- store closures incur restructuring/lease exit costs
- top stores drive majority profitability, many underperform
- capex tradeoff: remodels vs digital
Margin sensitivity to promotions
Gap's reliance on frequent discounts to match competitive traffic compresses gross margins, with retail promo intensity rising to about 40% industry-wide in 2024, increasing markdown pressure during downturns.
High promotional dependence can erode brand perception over time and dilute full-price sales, while marketing efficiency falls when offers dominate messaging and acquisition costs rise.
- Margin squeeze: promo-driven gross margin decline of several percentage points
- Brand risk: repeated discounts weaken premium positioning
- Marketing drag: higher CAC when promotions lead communications
Apparel retailer’s weak design and heavy promos erode pricing; sales $14.2B
Inconsistent fashion direction and logo overexposure weakened Gap’s pricing power, contributing to FY2024 net sales of about $14.2 billion and lower sell‑through versus peers. Heavy promotional intensity (around 40% industrywide in 2024) squeezed gross margins and trained customers to wait for discounts. Dependence on North America and legacy mall footprint limit diversification and keep occupancy costs high.
| Metric | Value (2024) |
|---|---|
| Net sales | $14.2B |
| Promo intensity (industry) | ~40% |
| Mall foot traffic | Below 2019 benchmarks (industry trackers) |
Same Document Delivered
Gap SWOT Analysis
This is the actual Gap SWOT analysis document you’ll receive upon purchase—no surprises, just professional quality. The preview below is taken directly from the full report you'll get; purchase unlocks the complete, editable version. You’re viewing a live preview of the real file—buy to download the full, detailed analysis immediately.











