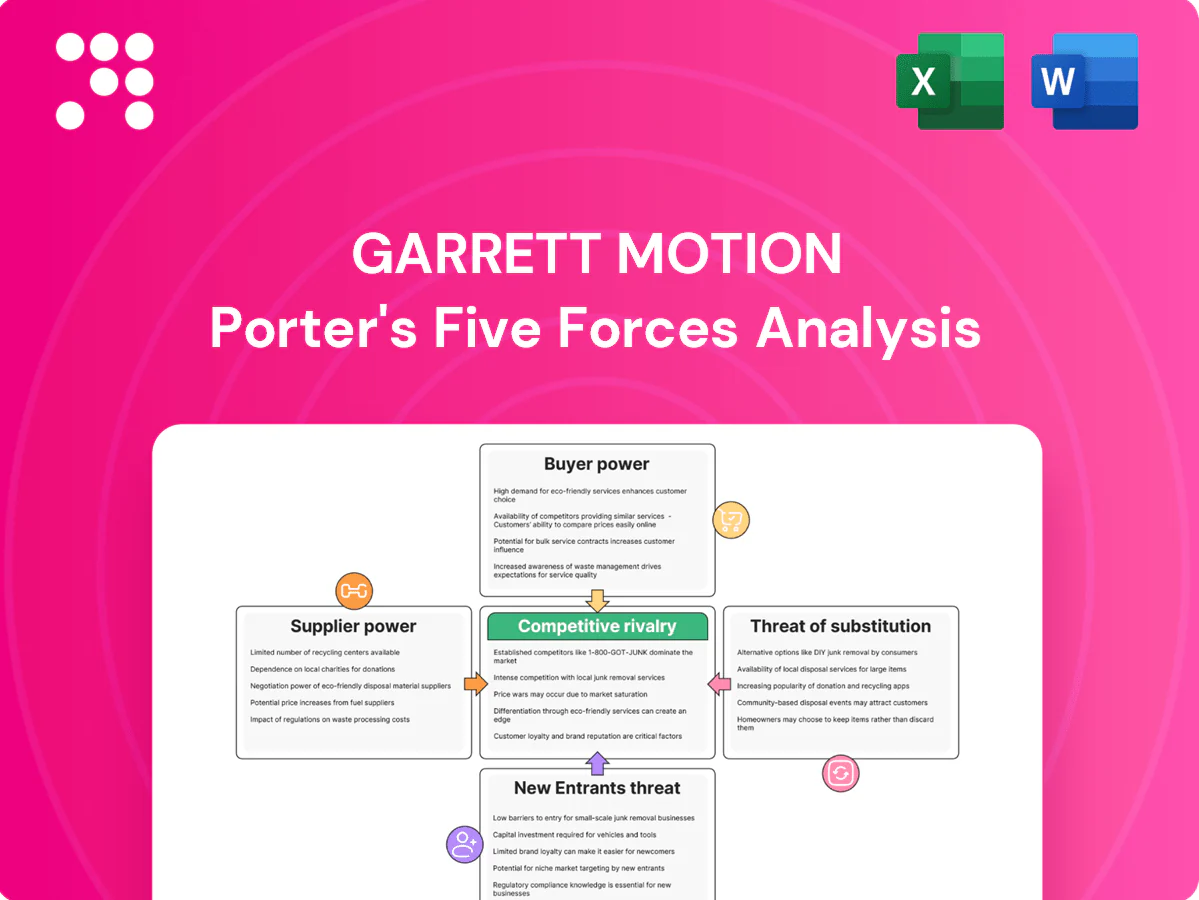
Garrett Motion Porter's Five Forces Analysis

Don't Miss the Bigger Picture
Garrett Motion’s Porter's Five Forces snapshot highlights supplier leverage, buyer pressure, and competitive rivalry shaping its turbocharger and electrification pivot; this teaser outlines key tensions but not the nuanced ratings or data. Ready for deeper strategic clarity? Unlock the full Porter's Five Forces Analysis for force-by-force ratings, visuals, and actionable recommendations.
Suppliers Bargaining Power

Concentrated specialty materials
High-temperature superalloys, titanium, advanced ceramics and precision castings are sourced from a small, specialized supplier pool, elevating pricing power and lead times for Garrett. Qualification and PPAP cycles typically take 6–18 months, making rapid switching costly and slow. Garrett mitigates this via dual-sourcing and a diversified global supplier base to reduce disruption risk.
Critical electronics and semiconductors
E-boost systems rely on power electronics, controllers and rare-earth magnets, with the global semiconductor market at about $600B in 2024 and the automotive chip segment near $70B, concentrating supply risk. Semiconductor cycle volatility and geopolitics drive price swings of 20-30% and strained availability, while China controls over 80% of rare-earth processing. Long-term 3–5 year contracts and design-for-multi-vendor reduce exposure, but requalification for AEC-Q standards can take 12–24 months.

Switching costs and validation
Automotive-grade validation, endurance testing and regulatory compliance create high switching costs, frequently involving 12–36 month qualification cycles and programs lasting 5–7 years (industry standard in 2024). Suppliers embedded in platform programs therefore gain leverage during contract terms. Garrett’s engineering depth and standardized modules temper that bargaining power. Any supplier change still risks program delays and warranty exposure.

Logistics and regionalization
Global manufacturing for Garrett Motion demands resilient logistics and local content alignment; the Suez Canal still carries about 12% of seaborne trade (2024), making chokepoints material to turbocharger supply. Regionalization near OEM plants cuts freight risk but narrows supplier options, and disruptions (ports, pandemics, conflicts) can temporarily amplify supplier leverage. Industry inventory buffers of roughly 30–60 days and dual-region sourcing are common mitigants.
- Region proximity reduces freight risk
- Narrower supplier base increases supplier power
- Chokepoints (Suez ~12% trade) raise leverage
- Buffers 30–60 days and dual sourcing stabilize supply
Long-term contracts and cost-downs
Automotive contracts with Garrett Motion commonly embed 2-3% annual cost-down roadmaps and indexation clauses, capping supplier upside while locking Garrett into predefined price paths; joint value-engineering programs split savings and align incentives across suppliers and OEMs. Commodity spikes, however, such as sharp rare-metal or steel moves, can trigger renegotiations that favor suppliers of unique inputs.
- Contracts: 2-3% annual cost-downs
- Mechanism: indexation limits upside
- Mitigation: joint value engineering
- Risk: commodity-triggered renegotiations
Rare-earth dominance and semiconductor scale strain suppliers; dual-sourcing limits exposure
Specialized inputs (superalloys, rare-earth magnets) and long 6–24 month qualification cycles give suppliers high leverage, amplified by 80%+ rare-earth processing concentration in China and semiconductor market ~$600B (auto chips ~$70B in 2024). Garrett uses dual-sourcing, 30–60 day buffers and 2–3% annual cost-down contracts to contain risk.
| Factor | Impact | 2024 Metric |
|---|---|---|
| Rare-earths | High leverage | China >80% |
| Semiconductors | Supply risk | $600B total, $70B auto |
What is included in the product
 Detailed Word Document
Uncovers key competitive drivers, supplier and buyer power, entry barriers, substitutes, and rivalry specific to Garrett Motion, highlighting disruptive threats and strategic levers that shape pricing, profitability, and market position.

 Customizable Excel Spreadsheet
A compact Porter's Five Forces snapshot for Garrett Motion—quickly pinpoint supplier, buyer, rivalry, entrant and substitute pressures to prioritize strategic moves and relieve analysis bottlenecks.
Customers Bargaining Power

Highly concentrated OEM customers
Global automakers and tier-1 integrators are few and large, running platform-level competitive sourcing that grants them strong negotiating power over suppliers like Garrett Motion. In 2024 global light vehicle production was about 76 million units, concentrating volume leverage with top OEMs and driving standard annual price-down expectations. High customer concentration elevates pricing pressure and stringent compliance demands.
Pre-award price pressure, post-award lock-in
Before award, aggressive bidding and design bake-offs amplify buyer power as OEMs pit suppliers against each other; RFPs routinely solicit double-digit supplier counts and aggressive cost targets. After nomination, switching is costly—validation and tooling cycles of 12–24 months and tooling/qualification costs often run into millions—so lock-in rises. OEMs still enforce continuous cost-downs via value engineering, commonly targeting 3–5% annual reductions, while strict performance and warranty terms preserve OEM leverage.

Performance, emissions, and reliability demands
Buyers prioritize emissions compliance, fuel efficiency, transient response and durability, with failures triggering penalties, recalls or lost awards; in the EU non‑compliance penalties can reach €95 per g/km per vehicle. Higher qualification hurdles and testing shift program risk and warranty exposure onto suppliers. Meeting OEM KPIs can secure multi‑year (typically 3–5 year) volumes that partially offset price pressure.

Aftermarket vs OEM mix
Garrett’s aftermarket mix provides margin diversification and reduces OEM dependence, but OEM volumes continue to dominate and largely set core pricing dynamics; service parts demand is tied to the installed base and component durability profiles. Digitally enabled aftermarket channels (e-commerce, telemetry-driven service) can gradually soften buyer power by improving price transparency and direct-to-shop/service access. Aftermarket resilience helps stabilize margins when OEM production cycles slow.
- Aftermarket reduces OEM concentration risk
- OEM volumes drive pricing leverage
- Service parts linked to installed base/durability
- Digital channels can erode buyer bargaining power
Platform cycles and forecast volatility
Program lifecycles run 5–7+ years, but volumes swing with macro cycles and mix; OEMs can cut take-rates or accelerate BEV shifts—global EV share reached about 14% in 2024—adding near-term demand volatility that pressures suppliers. Flexible manufacturing and shared architectures reduce exposure, yet volume-based rebates and contractual clauses preserve strong OEM leverage.
- Program life: 5–7+ years
- Global EV share 2024: ~14%
- Flexible architectures lower single-program risk
- Volume rebates/clauses = continued OEM negotiating power
OEM concentration forces 3–5% annual cost-downs and higher switching costs
Global OEMs (76M light vehicles 2024) concentrate volume and exert strong price pressure, targeting 3–5% annual cost-downs. Long nomination/validation (12–24 months) and program lives (5–7+ years) raise switching costs but OEM clauses maintain leverage. EU emission fines up to €95/g·km shift warranty/risk to suppliers; aftermarket and digital channels (EV share ~14% 2024) partially diversify margins.
| Metric | 2024/Range |
|---|---|
| Global LV production | ~76M |
| EV share | ~14% |
| OEM cost-down | 3–5% p.a. |
| Nomination lead | 12–24 months |
What You See Is What You Get
Garrett Motion Porter's Five Forces Analysis
This preview shows the exact Garrett Motion Porter's Five Forces analysis you'll receive after purchase—no placeholders or excerpts. The file is fully formatted, professional, and ready for immediate download and use. Purchase grants instant access to this same complete document.

Don't Miss the Bigger Picture
Garrett Motion’s Porter's Five Forces snapshot highlights supplier leverage, buyer pressure, and competitive rivalry shaping its turbocharger and electrification pivot; this teaser outlines key tensions but not the nuanced ratings or data. Ready for deeper strategic clarity? Unlock the full Porter's Five Forces Analysis for force-by-force ratings, visuals, and actionable recommendations.
Suppliers Bargaining Power
Concentrated specialty materials
High-temperature superalloys, titanium, advanced ceramics and precision castings are sourced from a small, specialized supplier pool, elevating pricing power and lead times for Garrett. Qualification and PPAP cycles typically take 6–18 months, making rapid switching costly and slow. Garrett mitigates this via dual-sourcing and a diversified global supplier base to reduce disruption risk.
Critical electronics and semiconductors
E-boost systems rely on power electronics, controllers and rare-earth magnets, with the global semiconductor market at about $600B in 2024 and the automotive chip segment near $70B, concentrating supply risk. Semiconductor cycle volatility and geopolitics drive price swings of 20-30% and strained availability, while China controls over 80% of rare-earth processing. Long-term 3–5 year contracts and design-for-multi-vendor reduce exposure, but requalification for AEC-Q standards can take 12–24 months.
Switching costs and validation
Automotive-grade validation, endurance testing and regulatory compliance create high switching costs, frequently involving 12–36 month qualification cycles and programs lasting 5–7 years (industry standard in 2024). Suppliers embedded in platform programs therefore gain leverage during contract terms. Garrett’s engineering depth and standardized modules temper that bargaining power. Any supplier change still risks program delays and warranty exposure.
Logistics and regionalization
Global manufacturing for Garrett Motion demands resilient logistics and local content alignment; the Suez Canal still carries about 12% of seaborne trade (2024), making chokepoints material to turbocharger supply. Regionalization near OEM plants cuts freight risk but narrows supplier options, and disruptions (ports, pandemics, conflicts) can temporarily amplify supplier leverage. Industry inventory buffers of roughly 30–60 days and dual-region sourcing are common mitigants.
- Region proximity reduces freight risk
- Narrower supplier base increases supplier power
- Chokepoints (Suez ~12% trade) raise leverage
- Buffers 30–60 days and dual sourcing stabilize supply
Long-term contracts and cost-downs
Automotive contracts with Garrett Motion commonly embed 2-3% annual cost-down roadmaps and indexation clauses, capping supplier upside while locking Garrett into predefined price paths; joint value-engineering programs split savings and align incentives across suppliers and OEMs. Commodity spikes, however, such as sharp rare-metal or steel moves, can trigger renegotiations that favor suppliers of unique inputs.
- Contracts: 2-3% annual cost-downs
- Mechanism: indexation limits upside
- Mitigation: joint value engineering
- Risk: commodity-triggered renegotiations
Rare-earth dominance and semiconductor scale strain suppliers; dual-sourcing limits exposure
Specialized inputs (superalloys, rare-earth magnets) and long 6–24 month qualification cycles give suppliers high leverage, amplified by 80%+ rare-earth processing concentration in China and semiconductor market ~$600B (auto chips ~$70B in 2024). Garrett uses dual-sourcing, 30–60 day buffers and 2–3% annual cost-down contracts to contain risk.
| Factor | Impact | 2024 Metric |
|---|---|---|
| Rare-earths | High leverage | China >80% |
| Semiconductors | Supply risk | $600B total, $70B auto |
What is included in the product
Detailed Word Document
Uncovers key competitive drivers, supplier and buyer power, entry barriers, substitutes, and rivalry specific to Garrett Motion, highlighting disruptive threats and strategic levers that shape pricing, profitability, and market position.
Customizable Excel Spreadsheet
A compact Porter's Five Forces snapshot for Garrett Motion—quickly pinpoint supplier, buyer, rivalry, entrant and substitute pressures to prioritize strategic moves and relieve analysis bottlenecks.
Customers Bargaining Power
Highly concentrated OEM customers
Global automakers and tier-1 integrators are few and large, running platform-level competitive sourcing that grants them strong negotiating power over suppliers like Garrett Motion. In 2024 global light vehicle production was about 76 million units, concentrating volume leverage with top OEMs and driving standard annual price-down expectations. High customer concentration elevates pricing pressure and stringent compliance demands.
Pre-award price pressure, post-award lock-in
Before award, aggressive bidding and design bake-offs amplify buyer power as OEMs pit suppliers against each other; RFPs routinely solicit double-digit supplier counts and aggressive cost targets. After nomination, switching is costly—validation and tooling cycles of 12–24 months and tooling/qualification costs often run into millions—so lock-in rises. OEMs still enforce continuous cost-downs via value engineering, commonly targeting 3–5% annual reductions, while strict performance and warranty terms preserve OEM leverage.
Performance, emissions, and reliability demands
Buyers prioritize emissions compliance, fuel efficiency, transient response and durability, with failures triggering penalties, recalls or lost awards; in the EU non‑compliance penalties can reach €95 per g/km per vehicle. Higher qualification hurdles and testing shift program risk and warranty exposure onto suppliers. Meeting OEM KPIs can secure multi‑year (typically 3–5 year) volumes that partially offset price pressure.
Aftermarket vs OEM mix
Garrett’s aftermarket mix provides margin diversification and reduces OEM dependence, but OEM volumes continue to dominate and largely set core pricing dynamics; service parts demand is tied to the installed base and component durability profiles. Digitally enabled aftermarket channels (e-commerce, telemetry-driven service) can gradually soften buyer power by improving price transparency and direct-to-shop/service access. Aftermarket resilience helps stabilize margins when OEM production cycles slow.
- Aftermarket reduces OEM concentration risk
- OEM volumes drive pricing leverage
- Service parts linked to installed base/durability
- Digital channels can erode buyer bargaining power
Platform cycles and forecast volatility
Program lifecycles run 5–7+ years, but volumes swing with macro cycles and mix; OEMs can cut take-rates or accelerate BEV shifts—global EV share reached about 14% in 2024—adding near-term demand volatility that pressures suppliers. Flexible manufacturing and shared architectures reduce exposure, yet volume-based rebates and contractual clauses preserve strong OEM leverage.
- Program life: 5–7+ years
- Global EV share 2024: ~14%
- Flexible architectures lower single-program risk
- Volume rebates/clauses = continued OEM negotiating power
OEM concentration forces 3–5% annual cost-downs and higher switching costs
Global OEMs (76M light vehicles 2024) concentrate volume and exert strong price pressure, targeting 3–5% annual cost-downs. Long nomination/validation (12–24 months) and program lives (5–7+ years) raise switching costs but OEM clauses maintain leverage. EU emission fines up to €95/g·km shift warranty/risk to suppliers; aftermarket and digital channels (EV share ~14% 2024) partially diversify margins.
| Metric | 2024/Range |
|---|---|
| Global LV production | ~76M |
| EV share | ~14% |
| OEM cost-down | 3–5% p.a. |
| Nomination lead | 12–24 months |
What You See Is What You Get
Garrett Motion Porter's Five Forces Analysis
This preview shows the exact Garrett Motion Porter's Five Forces analysis you'll receive after purchase—no placeholders or excerpts. The file is fully formatted, professional, and ready for immediate download and use. Purchase grants instant access to this same complete document.
Original: $10.00
-65%$10.00
$3.50Description
Don't Miss the Bigger Picture
Garrett Motion’s Porter's Five Forces snapshot highlights supplier leverage, buyer pressure, and competitive rivalry shaping its turbocharger and electrification pivot; this teaser outlines key tensions but not the nuanced ratings or data. Ready for deeper strategic clarity? Unlock the full Porter's Five Forces Analysis for force-by-force ratings, visuals, and actionable recommendations.
Suppliers Bargaining Power
Concentrated specialty materials
High-temperature superalloys, titanium, advanced ceramics and precision castings are sourced from a small, specialized supplier pool, elevating pricing power and lead times for Garrett. Qualification and PPAP cycles typically take 6–18 months, making rapid switching costly and slow. Garrett mitigates this via dual-sourcing and a diversified global supplier base to reduce disruption risk.
Critical electronics and semiconductors
E-boost systems rely on power electronics, controllers and rare-earth magnets, with the global semiconductor market at about $600B in 2024 and the automotive chip segment near $70B, concentrating supply risk. Semiconductor cycle volatility and geopolitics drive price swings of 20-30% and strained availability, while China controls over 80% of rare-earth processing. Long-term 3–5 year contracts and design-for-multi-vendor reduce exposure, but requalification for AEC-Q standards can take 12–24 months.
Switching costs and validation
Automotive-grade validation, endurance testing and regulatory compliance create high switching costs, frequently involving 12–36 month qualification cycles and programs lasting 5–7 years (industry standard in 2024). Suppliers embedded in platform programs therefore gain leverage during contract terms. Garrett’s engineering depth and standardized modules temper that bargaining power. Any supplier change still risks program delays and warranty exposure.
Logistics and regionalization
Global manufacturing for Garrett Motion demands resilient logistics and local content alignment; the Suez Canal still carries about 12% of seaborne trade (2024), making chokepoints material to turbocharger supply. Regionalization near OEM plants cuts freight risk but narrows supplier options, and disruptions (ports, pandemics, conflicts) can temporarily amplify supplier leverage. Industry inventory buffers of roughly 30–60 days and dual-region sourcing are common mitigants.
- Region proximity reduces freight risk
- Narrower supplier base increases supplier power
- Chokepoints (Suez ~12% trade) raise leverage
- Buffers 30–60 days and dual sourcing stabilize supply
Long-term contracts and cost-downs
Automotive contracts with Garrett Motion commonly embed 2-3% annual cost-down roadmaps and indexation clauses, capping supplier upside while locking Garrett into predefined price paths; joint value-engineering programs split savings and align incentives across suppliers and OEMs. Commodity spikes, however, such as sharp rare-metal or steel moves, can trigger renegotiations that favor suppliers of unique inputs.
- Contracts: 2-3% annual cost-downs
- Mechanism: indexation limits upside
- Mitigation: joint value engineering
- Risk: commodity-triggered renegotiations
Rare-earth dominance and semiconductor scale strain suppliers; dual-sourcing limits exposure
Specialized inputs (superalloys, rare-earth magnets) and long 6–24 month qualification cycles give suppliers high leverage, amplified by 80%+ rare-earth processing concentration in China and semiconductor market ~$600B (auto chips ~$70B in 2024). Garrett uses dual-sourcing, 30–60 day buffers and 2–3% annual cost-down contracts to contain risk.
| Factor | Impact | 2024 Metric |
|---|---|---|
| Rare-earths | High leverage | China >80% |
| Semiconductors | Supply risk | $600B total, $70B auto |
What is included in the product
Detailed Word Document
Uncovers key competitive drivers, supplier and buyer power, entry barriers, substitutes, and rivalry specific to Garrett Motion, highlighting disruptive threats and strategic levers that shape pricing, profitability, and market position.
Customizable Excel Spreadsheet
A compact Porter's Five Forces snapshot for Garrett Motion—quickly pinpoint supplier, buyer, rivalry, entrant and substitute pressures to prioritize strategic moves and relieve analysis bottlenecks.
Customers Bargaining Power
Highly concentrated OEM customers
Global automakers and tier-1 integrators are few and large, running platform-level competitive sourcing that grants them strong negotiating power over suppliers like Garrett Motion. In 2024 global light vehicle production was about 76 million units, concentrating volume leverage with top OEMs and driving standard annual price-down expectations. High customer concentration elevates pricing pressure and stringent compliance demands.
Pre-award price pressure, post-award lock-in
Before award, aggressive bidding and design bake-offs amplify buyer power as OEMs pit suppliers against each other; RFPs routinely solicit double-digit supplier counts and aggressive cost targets. After nomination, switching is costly—validation and tooling cycles of 12–24 months and tooling/qualification costs often run into millions—so lock-in rises. OEMs still enforce continuous cost-downs via value engineering, commonly targeting 3–5% annual reductions, while strict performance and warranty terms preserve OEM leverage.
Performance, emissions, and reliability demands
Buyers prioritize emissions compliance, fuel efficiency, transient response and durability, with failures triggering penalties, recalls or lost awards; in the EU non‑compliance penalties can reach €95 per g/km per vehicle. Higher qualification hurdles and testing shift program risk and warranty exposure onto suppliers. Meeting OEM KPIs can secure multi‑year (typically 3–5 year) volumes that partially offset price pressure.
Aftermarket vs OEM mix
Garrett’s aftermarket mix provides margin diversification and reduces OEM dependence, but OEM volumes continue to dominate and largely set core pricing dynamics; service parts demand is tied to the installed base and component durability profiles. Digitally enabled aftermarket channels (e-commerce, telemetry-driven service) can gradually soften buyer power by improving price transparency and direct-to-shop/service access. Aftermarket resilience helps stabilize margins when OEM production cycles slow.
- Aftermarket reduces OEM concentration risk
- OEM volumes drive pricing leverage
- Service parts linked to installed base/durability
- Digital channels can erode buyer bargaining power
Platform cycles and forecast volatility
Program lifecycles run 5–7+ years, but volumes swing with macro cycles and mix; OEMs can cut take-rates or accelerate BEV shifts—global EV share reached about 14% in 2024—adding near-term demand volatility that pressures suppliers. Flexible manufacturing and shared architectures reduce exposure, yet volume-based rebates and contractual clauses preserve strong OEM leverage.
- Program life: 5–7+ years
- Global EV share 2024: ~14%
- Flexible architectures lower single-program risk
- Volume rebates/clauses = continued OEM negotiating power
OEM concentration forces 3–5% annual cost-downs and higher switching costs
Global OEMs (76M light vehicles 2024) concentrate volume and exert strong price pressure, targeting 3–5% annual cost-downs. Long nomination/validation (12–24 months) and program lives (5–7+ years) raise switching costs but OEM clauses maintain leverage. EU emission fines up to €95/g·km shift warranty/risk to suppliers; aftermarket and digital channels (EV share ~14% 2024) partially diversify margins.
| Metric | 2024/Range |
|---|---|
| Global LV production | ~76M |
| EV share | ~14% |
| OEM cost-down | 3–5% p.a. |
| Nomination lead | 12–24 months |
What You See Is What You Get
Garrett Motion Porter's Five Forces Analysis
This preview shows the exact Garrett Motion Porter's Five Forces analysis you'll receive after purchase—no placeholders or excerpts. The file is fully formatted, professional, and ready for immediate download and use. Purchase grants instant access to this same complete document.











