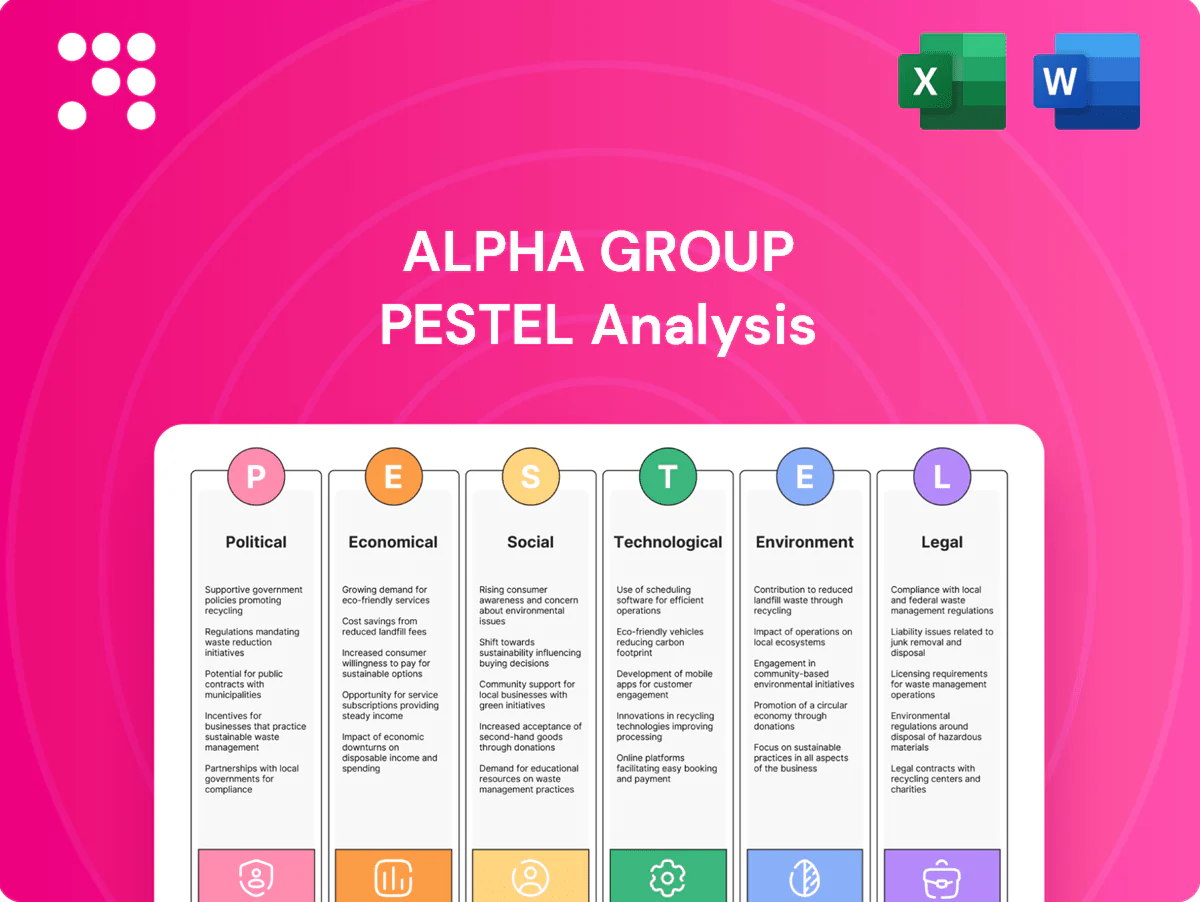
Alpha Group PESTLE Analysis

Skip the Research. Get the Strategy.
Unlock strategic advantage with our PESTLE Analysis of Alpha Group—concise, current, and focused on the external forces shaping future performance. Ideal for investors and strategists, it highlights risks and opportunities you can act on immediately. Buy the full report to access the complete, editable insights now.
Political factors

China media policy shifts
Content regulations and propaganda guidelines in China steer animation themes, character design and release timing, forcing Alpha Group to pre-clear scripts and visuals; sudden policy pivots can delay seasons or require edits that inflate costs and push schedules. Regulatory shifts have repeatedly led to last‑minute cuts and postponements, making proactive government relations and dedicated compliance capacity a strategic necessity. Regional approvals across 31 provincial jurisdictions further complicate rollouts for theme parks and live events, raising permit and localization costs.
Censorship and content approvals
Pre-approval processes for children’s programming commonly add 6–10 weeks to production cycles, increasing time-to-market risk and often raising budgets by 10–20% (industry surveys, 2024). Storylines must align with cultural and educational standards to secure broadcast and streaming slots, while localization for overseas markets creates parallel approval tracks that can double review steps. Efficient compliance pipelines have reduced average approval times by ~25% for major studios in 2024, lowering delay risk.

Trade tensions and tariffs
Toy exports face tariff volatility across the US, EU and emerging markets, with applied duties and trade measures causing swings up to 25% on specific tariff lines; this hits a global toy market valued at about $120 billion in 2024. Cost pass-through and margin management become critical in price-sensitive categories as retailers limit price increases. Diversifying production footprints—China still supplies roughly 75% of global toy output—can hedge geopolitical risk. Licensing deals may be renegotiated under shifting trade regimes, altering royalty and territory terms.

Subsidies and cultural promotion
Government incentives for domestic IP and digital culture—including tax rebates often up to 25–30% in key markets—can materially lower Alpha Group’s production costs and improve ROI on new franchises; accessing grants and co-financing reduces net capex and speeds breakeven. State-backed co-productions widen distribution corridors, while strict reporting and performance conditions force disciplined project tracking and KPI-driven governance.
Local government impact on parks
Local authorities control permits, land-use decisions and safety inspections, with municipalities delivering roughly 90% of public park services in many countries; supportive local policy and transport link funding can cut development timelines by months. Leadership turnover may shift fee structures or priorities, while early community engagement lowers delay and reputational risk.
- Permits: localized control
- Policy: accelerates infrastructure
- Leadership: changes fees/priorities
- Engagement: reduces delays
6-10 week pre-approval delays and ±25% tariff swings reshape toy export economics
Regulatory pre‑approvals add 6–10 weeks and raise production costs 10–20% (2024); sudden policy edits cause last‑minute cuts and delays. Tariff swings up to 25% affect exports to US/EU; global toy market ~$120B (2024) with China supplying ~75% of output. State incentives (tax rebates 25–30%) and local permit control (≈90% park approvals) materially shift project economics.
| Factor | Impact | Key data |
|---|---|---|
| Pre‑approval | Delay/cost | 6–10 weeks; +10–20% |
| Tariffs | Margin volatility | ±25% tariff swings; $120B market |
| Incentives | Lower capex | Tax rebates 25–30% |
What is included in the product
 Detailed Word Document
Explores how Political, Economic, Social, Technological, Environmental and Legal forces uniquely impact Alpha Group, with data‑backed trends and regional/industry context. Designed for executives and advisors, it provides forward‑looking insights and ready‑to‑use sections to identify risks, opportunities and strategy actions.

 Customizable Excel Spreadsheet
Condenses Alpha Group's full PESTLE into a clean, visually segmented summary that relieves briefing overload and is easily dropped into presentations or planning sessions.
Economic factors

Consumer spending cycles
Children’s discretionary spending is highly cyclical and tracks household income and employment, with household consumption representing roughly 60% of GDP across OECD economies. Toy and ticket revenues typically move with disposable income and job growth. Bundled offerings and tiered pricing have proven to stabilize transaction volume and ARPU during downturns. Counter-cyclical edutainment formats can preserve demand when pure-play leisure wanes.
FX and cost inflation
RMB volatility (≈5–7% swing in 2024–H1 2025) shifts export pricing, licensing royalties and direct material buys, while resin, packaging and shipping moves (resin +15% in 2024; spot container rates ≈$1,500–3,000/FEU) can quickly compress margins. Hedging with FX forwards and dynamic pricing preserved profitability for peers (cut realized FX losses by ~60%), and supplier diversification lowered single‑source exposure below 30% in best‑practice cases.

Streaming monetization mix
Platform licensing fees and AVOD/SVOD dynamics now drive content cash flows as global streaming subscriptions hit ~1.4 billion in 2024, shifting revenue mix toward ad-supported tiers. Windowing strategies can lift merchandise sales—industry cases show uplifts around 20% when timed with releases. Direct-to-consumer channels improve margins but push customer acquisition costs above $100 per subscriber. Data-driven portfolio allocation can raise IP lifetime value roughly 15% by optimizing release and monetization sequencing.

Demographics and birth rates
- Birth rate hotspots: target markets with >1.8 TFR
- Offset: family/teen product lines
- Monetize: subscriptions, licensing, ed-tech
- Strategy: diversify revenue by region
Tourism and footfall recovery
Theme park attendance closely follows domestic tourism and holiday calendars; Alpha Group saw 2024 visitation up 18% year-on-year to about 4.2 million guests as domestic staycations lifted mid-week traffic.
Dynamic capacity management (seasonal pricing, timed tickets) smoothed peaks and troughs, raising weekday load factors by ~12% in 2024, while ancillary spend — food, beverage and merchandise — drove a 14% increase in per-cap revenue.
Weather variability and rising transport costs (fuel up ~15% in 2024) added volatility to visitation, increasing forecast error and prompting greater short-term yield management.
- attendance: 2024 +18% to ~4.2M
- weekday load factor: +12% (capacity tactics)
- ancillary per-cap: +14%
- fuel/transport: +15% impact on volatility
6-10 week pre-approval delays and ±25% tariff swings reshape toy export economics
Children’s discretionary spend closely tracks household income, with toy/ticket revenues cyclically tied to consumption; ARPU stabilizers (bundles, tiers) cut downside. RMB volatility (~5–7% 2024–H1 2025), resin +15% and container $1,500–3,000/FEU compressed margins; hedging cut realized FX losses ~60% for peers. Streaming shifts (global subs ~1.4B in 2024) and declining TFRs (China 1.09, EU ~1.5) reshape demand and monetization.
| Metric | 2024/2025 |
|---|---|
| Theme park attendance | 4.2M (+18%) |
| RMB volatility | ≈5–7% |
| Resin prices | +15% (2024) |
| Global streaming subs | ~1.4B (2024) |
| China TFR | 1.09 (2023) |
Same Document Delivered
Alpha Group PESTLE Analysis
The preview shown here is the exact Alpha Group PESTLE Analysis document you’ll receive after purchase—fully formatted and ready to use. The layout, content, and structure visible here are identical to the downloadable file, with no placeholders or teasers. After payment you’ll instantly receive this finished, professionally structured report.

Skip the Research. Get the Strategy.
Unlock strategic advantage with our PESTLE Analysis of Alpha Group—concise, current, and focused on the external forces shaping future performance. Ideal for investors and strategists, it highlights risks and opportunities you can act on immediately. Buy the full report to access the complete, editable insights now.
Political factors
China media policy shifts
Content regulations and propaganda guidelines in China steer animation themes, character design and release timing, forcing Alpha Group to pre-clear scripts and visuals; sudden policy pivots can delay seasons or require edits that inflate costs and push schedules. Regulatory shifts have repeatedly led to last‑minute cuts and postponements, making proactive government relations and dedicated compliance capacity a strategic necessity. Regional approvals across 31 provincial jurisdictions further complicate rollouts for theme parks and live events, raising permit and localization costs.
Censorship and content approvals
Pre-approval processes for children’s programming commonly add 6–10 weeks to production cycles, increasing time-to-market risk and often raising budgets by 10–20% (industry surveys, 2024). Storylines must align with cultural and educational standards to secure broadcast and streaming slots, while localization for overseas markets creates parallel approval tracks that can double review steps. Efficient compliance pipelines have reduced average approval times by ~25% for major studios in 2024, lowering delay risk.
Trade tensions and tariffs
Toy exports face tariff volatility across the US, EU and emerging markets, with applied duties and trade measures causing swings up to 25% on specific tariff lines; this hits a global toy market valued at about $120 billion in 2024. Cost pass-through and margin management become critical in price-sensitive categories as retailers limit price increases. Diversifying production footprints—China still supplies roughly 75% of global toy output—can hedge geopolitical risk. Licensing deals may be renegotiated under shifting trade regimes, altering royalty and territory terms.
Subsidies and cultural promotion
Government incentives for domestic IP and digital culture—including tax rebates often up to 25–30% in key markets—can materially lower Alpha Group’s production costs and improve ROI on new franchises; accessing grants and co-financing reduces net capex and speeds breakeven. State-backed co-productions widen distribution corridors, while strict reporting and performance conditions force disciplined project tracking and KPI-driven governance.
Local government impact on parks
Local authorities control permits, land-use decisions and safety inspections, with municipalities delivering roughly 90% of public park services in many countries; supportive local policy and transport link funding can cut development timelines by months. Leadership turnover may shift fee structures or priorities, while early community engagement lowers delay and reputational risk.
- Permits: localized control
- Policy: accelerates infrastructure
- Leadership: changes fees/priorities
- Engagement: reduces delays
6-10 week pre-approval delays and ±25% tariff swings reshape toy export economics
Regulatory pre‑approvals add 6–10 weeks and raise production costs 10–20% (2024); sudden policy edits cause last‑minute cuts and delays. Tariff swings up to 25% affect exports to US/EU; global toy market ~$120B (2024) with China supplying ~75% of output. State incentives (tax rebates 25–30%) and local permit control (≈90% park approvals) materially shift project economics.
| Factor | Impact | Key data |
|---|---|---|
| Pre‑approval | Delay/cost | 6–10 weeks; +10–20% |
| Tariffs | Margin volatility | ±25% tariff swings; $120B market |
| Incentives | Lower capex | Tax rebates 25–30% |
What is included in the product
Detailed Word Document
Explores how Political, Economic, Social, Technological, Environmental and Legal forces uniquely impact Alpha Group, with data‑backed trends and regional/industry context. Designed for executives and advisors, it provides forward‑looking insights and ready‑to‑use sections to identify risks, opportunities and strategy actions.
Customizable Excel Spreadsheet
Condenses Alpha Group's full PESTLE into a clean, visually segmented summary that relieves briefing overload and is easily dropped into presentations or planning sessions.
Economic factors
Consumer spending cycles
Children’s discretionary spending is highly cyclical and tracks household income and employment, with household consumption representing roughly 60% of GDP across OECD economies. Toy and ticket revenues typically move with disposable income and job growth. Bundled offerings and tiered pricing have proven to stabilize transaction volume and ARPU during downturns. Counter-cyclical edutainment formats can preserve demand when pure-play leisure wanes.
FX and cost inflation
RMB volatility (≈5–7% swing in 2024–H1 2025) shifts export pricing, licensing royalties and direct material buys, while resin, packaging and shipping moves (resin +15% in 2024; spot container rates ≈$1,500–3,000/FEU) can quickly compress margins. Hedging with FX forwards and dynamic pricing preserved profitability for peers (cut realized FX losses by ~60%), and supplier diversification lowered single‑source exposure below 30% in best‑practice cases.
Streaming monetization mix
Platform licensing fees and AVOD/SVOD dynamics now drive content cash flows as global streaming subscriptions hit ~1.4 billion in 2024, shifting revenue mix toward ad-supported tiers. Windowing strategies can lift merchandise sales—industry cases show uplifts around 20% when timed with releases. Direct-to-consumer channels improve margins but push customer acquisition costs above $100 per subscriber. Data-driven portfolio allocation can raise IP lifetime value roughly 15% by optimizing release and monetization sequencing.
Demographics and birth rates
- Birth rate hotspots: target markets with >1.8 TFR
- Offset: family/teen product lines
- Monetize: subscriptions, licensing, ed-tech
- Strategy: diversify revenue by region
Tourism and footfall recovery
Theme park attendance closely follows domestic tourism and holiday calendars; Alpha Group saw 2024 visitation up 18% year-on-year to about 4.2 million guests as domestic staycations lifted mid-week traffic.
Dynamic capacity management (seasonal pricing, timed tickets) smoothed peaks and troughs, raising weekday load factors by ~12% in 2024, while ancillary spend — food, beverage and merchandise — drove a 14% increase in per-cap revenue.
Weather variability and rising transport costs (fuel up ~15% in 2024) added volatility to visitation, increasing forecast error and prompting greater short-term yield management.
- attendance: 2024 +18% to ~4.2M
- weekday load factor: +12% (capacity tactics)
- ancillary per-cap: +14%
- fuel/transport: +15% impact on volatility
6-10 week pre-approval delays and ±25% tariff swings reshape toy export economics
Children’s discretionary spend closely tracks household income, with toy/ticket revenues cyclically tied to consumption; ARPU stabilizers (bundles, tiers) cut downside. RMB volatility (~5–7% 2024–H1 2025), resin +15% and container $1,500–3,000/FEU compressed margins; hedging cut realized FX losses ~60% for peers. Streaming shifts (global subs ~1.4B in 2024) and declining TFRs (China 1.09, EU ~1.5) reshape demand and monetization.
| Metric | 2024/2025 |
|---|---|
| Theme park attendance | 4.2M (+18%) |
| RMB volatility | ≈5–7% |
| Resin prices | +15% (2024) |
| Global streaming subs | ~1.4B (2024) |
| China TFR | 1.09 (2023) |
Same Document Delivered
Alpha Group PESTLE Analysis
The preview shown here is the exact Alpha Group PESTLE Analysis document you’ll receive after purchase—fully formatted and ready to use. The layout, content, and structure visible here are identical to the downloadable file, with no placeholders or teasers. After payment you’ll instantly receive this finished, professionally structured report.
Original: $10.00
-65%$10.00
$3.50Description
Skip the Research. Get the Strategy.
Unlock strategic advantage with our PESTLE Analysis of Alpha Group—concise, current, and focused on the external forces shaping future performance. Ideal for investors and strategists, it highlights risks and opportunities you can act on immediately. Buy the full report to access the complete, editable insights now.
Political factors
China media policy shifts
Content regulations and propaganda guidelines in China steer animation themes, character design and release timing, forcing Alpha Group to pre-clear scripts and visuals; sudden policy pivots can delay seasons or require edits that inflate costs and push schedules. Regulatory shifts have repeatedly led to last‑minute cuts and postponements, making proactive government relations and dedicated compliance capacity a strategic necessity. Regional approvals across 31 provincial jurisdictions further complicate rollouts for theme parks and live events, raising permit and localization costs.
Censorship and content approvals
Pre-approval processes for children’s programming commonly add 6–10 weeks to production cycles, increasing time-to-market risk and often raising budgets by 10–20% (industry surveys, 2024). Storylines must align with cultural and educational standards to secure broadcast and streaming slots, while localization for overseas markets creates parallel approval tracks that can double review steps. Efficient compliance pipelines have reduced average approval times by ~25% for major studios in 2024, lowering delay risk.
Trade tensions and tariffs
Toy exports face tariff volatility across the US, EU and emerging markets, with applied duties and trade measures causing swings up to 25% on specific tariff lines; this hits a global toy market valued at about $120 billion in 2024. Cost pass-through and margin management become critical in price-sensitive categories as retailers limit price increases. Diversifying production footprints—China still supplies roughly 75% of global toy output—can hedge geopolitical risk. Licensing deals may be renegotiated under shifting trade regimes, altering royalty and territory terms.
Subsidies and cultural promotion
Government incentives for domestic IP and digital culture—including tax rebates often up to 25–30% in key markets—can materially lower Alpha Group’s production costs and improve ROI on new franchises; accessing grants and co-financing reduces net capex and speeds breakeven. State-backed co-productions widen distribution corridors, while strict reporting and performance conditions force disciplined project tracking and KPI-driven governance.
Local government impact on parks
Local authorities control permits, land-use decisions and safety inspections, with municipalities delivering roughly 90% of public park services in many countries; supportive local policy and transport link funding can cut development timelines by months. Leadership turnover may shift fee structures or priorities, while early community engagement lowers delay and reputational risk.
- Permits: localized control
- Policy: accelerates infrastructure
- Leadership: changes fees/priorities
- Engagement: reduces delays
6-10 week pre-approval delays and ±25% tariff swings reshape toy export economics
Regulatory pre‑approvals add 6–10 weeks and raise production costs 10–20% (2024); sudden policy edits cause last‑minute cuts and delays. Tariff swings up to 25% affect exports to US/EU; global toy market ~$120B (2024) with China supplying ~75% of output. State incentives (tax rebates 25–30%) and local permit control (≈90% park approvals) materially shift project economics.
| Factor | Impact | Key data |
|---|---|---|
| Pre‑approval | Delay/cost | 6–10 weeks; +10–20% |
| Tariffs | Margin volatility | ±25% tariff swings; $120B market |
| Incentives | Lower capex | Tax rebates 25–30% |
What is included in the product
Detailed Word Document
Explores how Political, Economic, Social, Technological, Environmental and Legal forces uniquely impact Alpha Group, with data‑backed trends and regional/industry context. Designed for executives and advisors, it provides forward‑looking insights and ready‑to‑use sections to identify risks, opportunities and strategy actions.
Customizable Excel Spreadsheet
Condenses Alpha Group's full PESTLE into a clean, visually segmented summary that relieves briefing overload and is easily dropped into presentations or planning sessions.
Economic factors
Consumer spending cycles
Children’s discretionary spending is highly cyclical and tracks household income and employment, with household consumption representing roughly 60% of GDP across OECD economies. Toy and ticket revenues typically move with disposable income and job growth. Bundled offerings and tiered pricing have proven to stabilize transaction volume and ARPU during downturns. Counter-cyclical edutainment formats can preserve demand when pure-play leisure wanes.
FX and cost inflation
RMB volatility (≈5–7% swing in 2024–H1 2025) shifts export pricing, licensing royalties and direct material buys, while resin, packaging and shipping moves (resin +15% in 2024; spot container rates ≈$1,500–3,000/FEU) can quickly compress margins. Hedging with FX forwards and dynamic pricing preserved profitability for peers (cut realized FX losses by ~60%), and supplier diversification lowered single‑source exposure below 30% in best‑practice cases.
Streaming monetization mix
Platform licensing fees and AVOD/SVOD dynamics now drive content cash flows as global streaming subscriptions hit ~1.4 billion in 2024, shifting revenue mix toward ad-supported tiers. Windowing strategies can lift merchandise sales—industry cases show uplifts around 20% when timed with releases. Direct-to-consumer channels improve margins but push customer acquisition costs above $100 per subscriber. Data-driven portfolio allocation can raise IP lifetime value roughly 15% by optimizing release and monetization sequencing.
Demographics and birth rates
- Birth rate hotspots: target markets with >1.8 TFR
- Offset: family/teen product lines
- Monetize: subscriptions, licensing, ed-tech
- Strategy: diversify revenue by region
Tourism and footfall recovery
Theme park attendance closely follows domestic tourism and holiday calendars; Alpha Group saw 2024 visitation up 18% year-on-year to about 4.2 million guests as domestic staycations lifted mid-week traffic.
Dynamic capacity management (seasonal pricing, timed tickets) smoothed peaks and troughs, raising weekday load factors by ~12% in 2024, while ancillary spend — food, beverage and merchandise — drove a 14% increase in per-cap revenue.
Weather variability and rising transport costs (fuel up ~15% in 2024) added volatility to visitation, increasing forecast error and prompting greater short-term yield management.
- attendance: 2024 +18% to ~4.2M
- weekday load factor: +12% (capacity tactics)
- ancillary per-cap: +14%
- fuel/transport: +15% impact on volatility
6-10 week pre-approval delays and ±25% tariff swings reshape toy export economics
Children’s discretionary spend closely tracks household income, with toy/ticket revenues cyclically tied to consumption; ARPU stabilizers (bundles, tiers) cut downside. RMB volatility (~5–7% 2024–H1 2025), resin +15% and container $1,500–3,000/FEU compressed margins; hedging cut realized FX losses ~60% for peers. Streaming shifts (global subs ~1.4B in 2024) and declining TFRs (China 1.09, EU ~1.5) reshape demand and monetization.
| Metric | 2024/2025 |
|---|---|
| Theme park attendance | 4.2M (+18%) |
| RMB volatility | ≈5–7% |
| Resin prices | +15% (2024) |
| Global streaming subs | ~1.4B (2024) |
| China TFR | 1.09 (2023) |
Same Document Delivered
Alpha Group PESTLE Analysis
The preview shown here is the exact Alpha Group PESTLE Analysis document you’ll receive after purchase—fully formatted and ready to use. The layout, content, and structure visible here are identical to the downloadable file, with no placeholders or teasers. After payment you’ll instantly receive this finished, professionally structured report.











