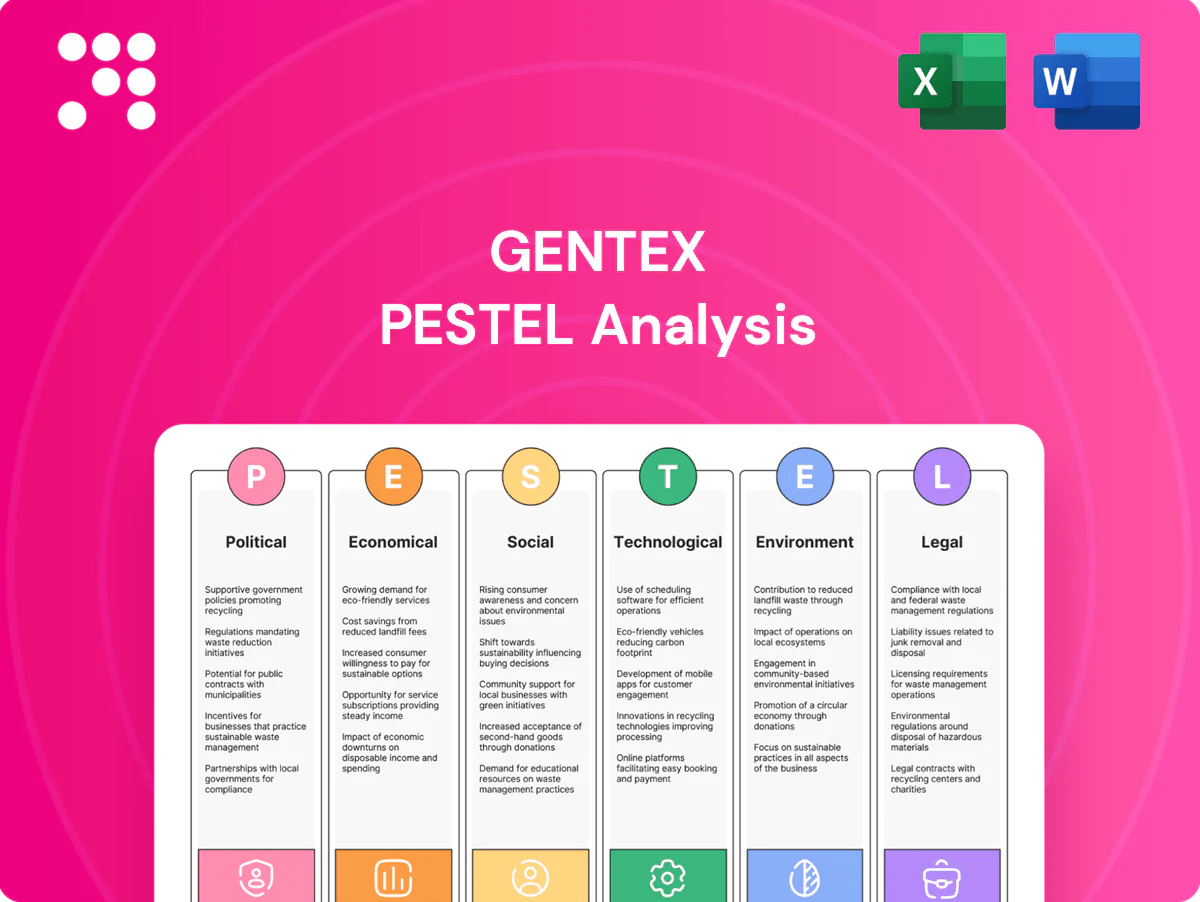
Gentex PESTLE Analysis

Your Competitive Advantage Starts with This Report
Gain a strategic edge with our PESTLE Analysis of Gentex. We dissect political, economic, social, technological, legal and environmental forces shaping growth and risk. Ideal for investors and strategists, this ready-to-use report saves research time. Purchase the full version for actionable, exportable insights now.
Political factors

Auto safety mandates
Government safety regulations drive wider adoption of auto-dimming mirrors and integrated vision systems, expanding Gentex’s content per vehicle as regulators press for glare reduction and improved visibility; Gentex supplies products to over 20 automakers.
NHTSA and UNECE rulemaking in 2023–2024 increasingly targeted glare mitigation and driver-assistance performance, creating new compliance markets for mirror- and camera-based solutions.
Changes in timelines or test protocols can alter specs and costs, so Gentex’s participation in standards bodies and lobbying shapes compliant, manufacturable designs.
Trade policy & tariffs
Tariffs on electronics, glass, chemicals and semiconductors—including US Section 301 duties of 7.5–25% covering roughly $360 billion of Chinese goods—raise Gentex input costs and compress margins. Trade disputes between North America, the EU and China can disrupt parts flows and delivery timing. USMCA’s 75% regional auto-content rule affects plant and supplier location decisions. Diversifying the supply base reduces exposure to policy shocks.

Industrial incentives
Subsidies for EVs and advanced manufacturing—driven by the US Inflation Reduction Act (about $369 billion for energy/climate) and EV tax credits up to $7,500—support Gentex’s tech investments. Grants and R&D tax credits (federal credit often 6–14% of qualified research expenses) and production incentives lower unit costs. Competing jurisdictions (EU, China) offer rival packages, creating site-selection leverage. Policy reversals can threaten decade-scale capital plans.

Geopolitical supply risks
Regional conflicts and sanctions can constrain access to rare earths (China ~62% of production, USGS 2023) and semiconductors (global sales ~600B USD in 2023), while export controls and disrupted shipping lanes have extended optics/electronics lead times by up to ~30% in recent disruptions; OEMs increasingly favor suppliers with multi-region capacity and scenario planning to absorb abrupt shocks.
- Supply concentration: rare earths 62% China
- Chip market: ~600B USD (2023)
- Lead-time impact: up to ~30%
- Mitigation: multi-region capacity + scenario planning
Aerospace certification politics
National aviation authorities may tighten certification of dimmable windows after incident reviews, increasing scrutiny that can slow adoption; FAA and EASA remain the primary regulators whose alignment or divergence directly affects Gentex time-to-market and compliance costs, with a global in-service commercial fleet >25,000 aircraft (2024) raising exposure.
- Regulatory focus: post-incident tightening
- FAA/EASA split: affects approvals and costs
- Political scrutiny: slows adoption cycles
- Mitigation: early regulator engagement reduces approval risk
Regulation, tariffs and supply risks reshape auto optics; IRA EV credits spur investment
Regulatory safety rules (NHTSA/UNECE 2023–24) drive auto-dimming and camera adoption, expanding Gentex content per vehicle. Tariffs (US Sec.301 7.5–25% on ~$360B Chinese goods) and supply risks (rare earths: China ~62%; semis market ~$600B in 2023) raise input costs. IRA ~$369B and EV tax credits up to $7,500 subsidize tech investment but create site-selection competition.
| Factor | Key data | Impact |
|---|---|---|
| Regulation | NHTSA/UNECE 2023–24 | Higher content |
| Trade | Sec.301 7.5–25%; $360B | Cost pressure |
| Supply | Rare earths 62% China; $600B chips | Disruption risk |
| Incentives | IRA ~$369B; $7.5k EV credit | Investment support |
What is included in the product
 Detailed Word Document
Explores how external macro-environmental factors uniquely affect Gentex across Political, Economic, Social, Technological, Environmental and Legal dimensions, with evidence-based trends and metrics; designed for executives and investors to identify risks, opportunities and forward-looking strategic actions tailored to Gentex's automotive and electronics markets.

 Customizable Excel Spreadsheet
Gentex PESTLE Analysis delivers a concise, visually segmented summary of political, economic, social, technological, legal and environmental drivers, easily editable for region- or product-specific notes and ready to drop into presentations to streamline risk discussions and align teams quickly.
Economic factors

Auto production cycles
Light-vehicle build volumes directly drive demand for mirrors and in-cabin electronics; production shocks (eg 2020 pandemic, ~20% global drop) and inventory corrections trim orders, while launches of premium trims raise per-vehicle content by roughly 15–30% on optioned features. Regional mix shifts change option take-rates, and flexible manufacturing footprints allow Gentex to reallocate capacity and better absorb cyclicality.
Input cost volatility
Input cost volatility—glass, specialty chemicals, optics and semiconductors—directly sways Gentex margins; the global semiconductor market was about $600 billion in 2024, affecting component availability and pricing. Energy costs drive furnace and coating OPEX, while indexing, hedging and design-to-cost mitigate profit swings; supplier consolidation tightens bargaining leverage.

OEM pricing pressure
Automakers typically push 2–4% annual cost-downs and aggressive value engineering; with global light-vehicle production near 80 million units in 2024, OEM pricing pressure is persistent. Gentex must offset through innovation, scale economies and differentiated features to protect ASPs. Multi-year supply contracts (commonly 3–5 years) smooth revenue but cap upside. Consistent performance and quality help limit price erosion risk.

FX and global footprint
Gentex's global footprint exposes revenue to translation and transaction risk as significant sales are booked in multiple currencies; FY2024 net sales were about $1.93 billion, amplifying FX impact on reported results. Localizing production in Europe and Asia creates natural hedges, while currency swings drive sourcing and pricing choices. Active treasury hedging preserves cash flow and margins.
- FX exposure: multi-currency revenues
- Natural hedges: localized production
- Competitiveness: sourcing shifts with FX
- Treasury: active hedging to protect cash
Aviation and building cycles
Aviation build rates and 2024 retrofit budgets—with global aircraft deliveries returning near pre‑pandemic levels—directly drive demand for Gentex dimmable windows, while airline profitability and narrow carrier margins make backlog visibility sensitive to cash flow swings.
Commercial construction recovery in 2023–24 lifted orders for fire‑protection products, and Gentex diversification across automotive, aerospace and buildings helps blunt sector‑specific downturns.
- Deliveries near pre‑COVID levels 2024
- Backlogs provide visibility but linked to airline margins
- Construction upturn supports fire‑safety sales
- Diversification reduces concentration risk
Regulation, tariffs and supply risks reshape auto optics; IRA EV credits spur investment
Light-vehicle volumes (~80M units in 2024) and premium optioning raise per-vehicle content 15–30% while production shocks cut orders ~20% (2020). Input costs (glass, chemicals, semis; global semis ~$600B in 2024) and OEM 2–4% annual cost-downs pressure margins; FY2024 sales $1.93B; FX and localized production mitigate risk.
| Metric | 2024 |
|---|---|
| LV production | ~80M |
| Net sales | $1.93B |
| Semiconductor market | $600B |
Preview the Actual Deliverable
Gentex PESTLE Analysis
The preview shown here is the exact Gentex PESTLE Analysis document you’ll receive after purchase—fully formatted and ready to use. The layout, content, and structure visible are identical to the downloadable file, with no placeholders or teasers. After payment you’ll instantly receive this exact, professionally structured report.

Your Competitive Advantage Starts with This Report
Gain a strategic edge with our PESTLE Analysis of Gentex. We dissect political, economic, social, technological, legal and environmental forces shaping growth and risk. Ideal for investors and strategists, this ready-to-use report saves research time. Purchase the full version for actionable, exportable insights now.
Political factors
Auto safety mandates
Government safety regulations drive wider adoption of auto-dimming mirrors and integrated vision systems, expanding Gentex’s content per vehicle as regulators press for glare reduction and improved visibility; Gentex supplies products to over 20 automakers.
NHTSA and UNECE rulemaking in 2023–2024 increasingly targeted glare mitigation and driver-assistance performance, creating new compliance markets for mirror- and camera-based solutions.
Changes in timelines or test protocols can alter specs and costs, so Gentex’s participation in standards bodies and lobbying shapes compliant, manufacturable designs.
Trade policy & tariffs
Tariffs on electronics, glass, chemicals and semiconductors—including US Section 301 duties of 7.5–25% covering roughly $360 billion of Chinese goods—raise Gentex input costs and compress margins. Trade disputes between North America, the EU and China can disrupt parts flows and delivery timing. USMCA’s 75% regional auto-content rule affects plant and supplier location decisions. Diversifying the supply base reduces exposure to policy shocks.
Industrial incentives
Subsidies for EVs and advanced manufacturing—driven by the US Inflation Reduction Act (about $369 billion for energy/climate) and EV tax credits up to $7,500—support Gentex’s tech investments. Grants and R&D tax credits (federal credit often 6–14% of qualified research expenses) and production incentives lower unit costs. Competing jurisdictions (EU, China) offer rival packages, creating site-selection leverage. Policy reversals can threaten decade-scale capital plans.
Geopolitical supply risks
Regional conflicts and sanctions can constrain access to rare earths (China ~62% of production, USGS 2023) and semiconductors (global sales ~600B USD in 2023), while export controls and disrupted shipping lanes have extended optics/electronics lead times by up to ~30% in recent disruptions; OEMs increasingly favor suppliers with multi-region capacity and scenario planning to absorb abrupt shocks.
- Supply concentration: rare earths 62% China
- Chip market: ~600B USD (2023)
- Lead-time impact: up to ~30%
- Mitigation: multi-region capacity + scenario planning
Aerospace certification politics
National aviation authorities may tighten certification of dimmable windows after incident reviews, increasing scrutiny that can slow adoption; FAA and EASA remain the primary regulators whose alignment or divergence directly affects Gentex time-to-market and compliance costs, with a global in-service commercial fleet >25,000 aircraft (2024) raising exposure.
- Regulatory focus: post-incident tightening
- FAA/EASA split: affects approvals and costs
- Political scrutiny: slows adoption cycles
- Mitigation: early regulator engagement reduces approval risk
Regulation, tariffs and supply risks reshape auto optics; IRA EV credits spur investment
Regulatory safety rules (NHTSA/UNECE 2023–24) drive auto-dimming and camera adoption, expanding Gentex content per vehicle. Tariffs (US Sec.301 7.5–25% on ~$360B Chinese goods) and supply risks (rare earths: China ~62%; semis market ~$600B in 2023) raise input costs. IRA ~$369B and EV tax credits up to $7,500 subsidize tech investment but create site-selection competition.
| Factor | Key data | Impact |
|---|---|---|
| Regulation | NHTSA/UNECE 2023–24 | Higher content |
| Trade | Sec.301 7.5–25%; $360B | Cost pressure |
| Supply | Rare earths 62% China; $600B chips | Disruption risk |
| Incentives | IRA ~$369B; $7.5k EV credit | Investment support |
What is included in the product
Detailed Word Document
Explores how external macro-environmental factors uniquely affect Gentex across Political, Economic, Social, Technological, Environmental and Legal dimensions, with evidence-based trends and metrics; designed for executives and investors to identify risks, opportunities and forward-looking strategic actions tailored to Gentex's automotive and electronics markets.
Customizable Excel Spreadsheet
Gentex PESTLE Analysis delivers a concise, visually segmented summary of political, economic, social, technological, legal and environmental drivers, easily editable for region- or product-specific notes and ready to drop into presentations to streamline risk discussions and align teams quickly.
Economic factors
Auto production cycles
Light-vehicle build volumes directly drive demand for mirrors and in-cabin electronics; production shocks (eg 2020 pandemic, ~20% global drop) and inventory corrections trim orders, while launches of premium trims raise per-vehicle content by roughly 15–30% on optioned features. Regional mix shifts change option take-rates, and flexible manufacturing footprints allow Gentex to reallocate capacity and better absorb cyclicality.
Input cost volatility
Input cost volatility—glass, specialty chemicals, optics and semiconductors—directly sways Gentex margins; the global semiconductor market was about $600 billion in 2024, affecting component availability and pricing. Energy costs drive furnace and coating OPEX, while indexing, hedging and design-to-cost mitigate profit swings; supplier consolidation tightens bargaining leverage.
OEM pricing pressure
Automakers typically push 2–4% annual cost-downs and aggressive value engineering; with global light-vehicle production near 80 million units in 2024, OEM pricing pressure is persistent. Gentex must offset through innovation, scale economies and differentiated features to protect ASPs. Multi-year supply contracts (commonly 3–5 years) smooth revenue but cap upside. Consistent performance and quality help limit price erosion risk.
FX and global footprint
Gentex's global footprint exposes revenue to translation and transaction risk as significant sales are booked in multiple currencies; FY2024 net sales were about $1.93 billion, amplifying FX impact on reported results. Localizing production in Europe and Asia creates natural hedges, while currency swings drive sourcing and pricing choices. Active treasury hedging preserves cash flow and margins.
- FX exposure: multi-currency revenues
- Natural hedges: localized production
- Competitiveness: sourcing shifts with FX
- Treasury: active hedging to protect cash
Aviation and building cycles
Aviation build rates and 2024 retrofit budgets—with global aircraft deliveries returning near pre‑pandemic levels—directly drive demand for Gentex dimmable windows, while airline profitability and narrow carrier margins make backlog visibility sensitive to cash flow swings.
Commercial construction recovery in 2023–24 lifted orders for fire‑protection products, and Gentex diversification across automotive, aerospace and buildings helps blunt sector‑specific downturns.
- Deliveries near pre‑COVID levels 2024
- Backlogs provide visibility but linked to airline margins
- Construction upturn supports fire‑safety sales
- Diversification reduces concentration risk
Regulation, tariffs and supply risks reshape auto optics; IRA EV credits spur investment
Light-vehicle volumes (~80M units in 2024) and premium optioning raise per-vehicle content 15–30% while production shocks cut orders ~20% (2020). Input costs (glass, chemicals, semis; global semis ~$600B in 2024) and OEM 2–4% annual cost-downs pressure margins; FY2024 sales $1.93B; FX and localized production mitigate risk.
| Metric | 2024 |
|---|---|
| LV production | ~80M |
| Net sales | $1.93B |
| Semiconductor market | $600B |
Preview the Actual Deliverable
Gentex PESTLE Analysis
The preview shown here is the exact Gentex PESTLE Analysis document you’ll receive after purchase—fully formatted and ready to use. The layout, content, and structure visible are identical to the downloadable file, with no placeholders or teasers. After payment you’ll instantly receive this exact, professionally structured report.
Original: $10.00
-65%$10.00
$3.50Description
Your Competitive Advantage Starts with This Report
Gain a strategic edge with our PESTLE Analysis of Gentex. We dissect political, economic, social, technological, legal and environmental forces shaping growth and risk. Ideal for investors and strategists, this ready-to-use report saves research time. Purchase the full version for actionable, exportable insights now.
Political factors
Auto safety mandates
Government safety regulations drive wider adoption of auto-dimming mirrors and integrated vision systems, expanding Gentex’s content per vehicle as regulators press for glare reduction and improved visibility; Gentex supplies products to over 20 automakers.
NHTSA and UNECE rulemaking in 2023–2024 increasingly targeted glare mitigation and driver-assistance performance, creating new compliance markets for mirror- and camera-based solutions.
Changes in timelines or test protocols can alter specs and costs, so Gentex’s participation in standards bodies and lobbying shapes compliant, manufacturable designs.
Trade policy & tariffs
Tariffs on electronics, glass, chemicals and semiconductors—including US Section 301 duties of 7.5–25% covering roughly $360 billion of Chinese goods—raise Gentex input costs and compress margins. Trade disputes between North America, the EU and China can disrupt parts flows and delivery timing. USMCA’s 75% regional auto-content rule affects plant and supplier location decisions. Diversifying the supply base reduces exposure to policy shocks.
Industrial incentives
Subsidies for EVs and advanced manufacturing—driven by the US Inflation Reduction Act (about $369 billion for energy/climate) and EV tax credits up to $7,500—support Gentex’s tech investments. Grants and R&D tax credits (federal credit often 6–14% of qualified research expenses) and production incentives lower unit costs. Competing jurisdictions (EU, China) offer rival packages, creating site-selection leverage. Policy reversals can threaten decade-scale capital plans.
Geopolitical supply risks
Regional conflicts and sanctions can constrain access to rare earths (China ~62% of production, USGS 2023) and semiconductors (global sales ~600B USD in 2023), while export controls and disrupted shipping lanes have extended optics/electronics lead times by up to ~30% in recent disruptions; OEMs increasingly favor suppliers with multi-region capacity and scenario planning to absorb abrupt shocks.
- Supply concentration: rare earths 62% China
- Chip market: ~600B USD (2023)
- Lead-time impact: up to ~30%
- Mitigation: multi-region capacity + scenario planning
Aerospace certification politics
National aviation authorities may tighten certification of dimmable windows after incident reviews, increasing scrutiny that can slow adoption; FAA and EASA remain the primary regulators whose alignment or divergence directly affects Gentex time-to-market and compliance costs, with a global in-service commercial fleet >25,000 aircraft (2024) raising exposure.
- Regulatory focus: post-incident tightening
- FAA/EASA split: affects approvals and costs
- Political scrutiny: slows adoption cycles
- Mitigation: early regulator engagement reduces approval risk
Regulation, tariffs and supply risks reshape auto optics; IRA EV credits spur investment
Regulatory safety rules (NHTSA/UNECE 2023–24) drive auto-dimming and camera adoption, expanding Gentex content per vehicle. Tariffs (US Sec.301 7.5–25% on ~$360B Chinese goods) and supply risks (rare earths: China ~62%; semis market ~$600B in 2023) raise input costs. IRA ~$369B and EV tax credits up to $7,500 subsidize tech investment but create site-selection competition.
| Factor | Key data | Impact |
|---|---|---|
| Regulation | NHTSA/UNECE 2023–24 | Higher content |
| Trade | Sec.301 7.5–25%; $360B | Cost pressure |
| Supply | Rare earths 62% China; $600B chips | Disruption risk |
| Incentives | IRA ~$369B; $7.5k EV credit | Investment support |
What is included in the product
Detailed Word Document
Explores how external macro-environmental factors uniquely affect Gentex across Political, Economic, Social, Technological, Environmental and Legal dimensions, with evidence-based trends and metrics; designed for executives and investors to identify risks, opportunities and forward-looking strategic actions tailored to Gentex's automotive and electronics markets.
Customizable Excel Spreadsheet
Gentex PESTLE Analysis delivers a concise, visually segmented summary of political, economic, social, technological, legal and environmental drivers, easily editable for region- or product-specific notes and ready to drop into presentations to streamline risk discussions and align teams quickly.
Economic factors
Auto production cycles
Light-vehicle build volumes directly drive demand for mirrors and in-cabin electronics; production shocks (eg 2020 pandemic, ~20% global drop) and inventory corrections trim orders, while launches of premium trims raise per-vehicle content by roughly 15–30% on optioned features. Regional mix shifts change option take-rates, and flexible manufacturing footprints allow Gentex to reallocate capacity and better absorb cyclicality.
Input cost volatility
Input cost volatility—glass, specialty chemicals, optics and semiconductors—directly sways Gentex margins; the global semiconductor market was about $600 billion in 2024, affecting component availability and pricing. Energy costs drive furnace and coating OPEX, while indexing, hedging and design-to-cost mitigate profit swings; supplier consolidation tightens bargaining leverage.
OEM pricing pressure
Automakers typically push 2–4% annual cost-downs and aggressive value engineering; with global light-vehicle production near 80 million units in 2024, OEM pricing pressure is persistent. Gentex must offset through innovation, scale economies and differentiated features to protect ASPs. Multi-year supply contracts (commonly 3–5 years) smooth revenue but cap upside. Consistent performance and quality help limit price erosion risk.
FX and global footprint
Gentex's global footprint exposes revenue to translation and transaction risk as significant sales are booked in multiple currencies; FY2024 net sales were about $1.93 billion, amplifying FX impact on reported results. Localizing production in Europe and Asia creates natural hedges, while currency swings drive sourcing and pricing choices. Active treasury hedging preserves cash flow and margins.
- FX exposure: multi-currency revenues
- Natural hedges: localized production
- Competitiveness: sourcing shifts with FX
- Treasury: active hedging to protect cash
Aviation and building cycles
Aviation build rates and 2024 retrofit budgets—with global aircraft deliveries returning near pre‑pandemic levels—directly drive demand for Gentex dimmable windows, while airline profitability and narrow carrier margins make backlog visibility sensitive to cash flow swings.
Commercial construction recovery in 2023–24 lifted orders for fire‑protection products, and Gentex diversification across automotive, aerospace and buildings helps blunt sector‑specific downturns.
- Deliveries near pre‑COVID levels 2024
- Backlogs provide visibility but linked to airline margins
- Construction upturn supports fire‑safety sales
- Diversification reduces concentration risk
Regulation, tariffs and supply risks reshape auto optics; IRA EV credits spur investment
Light-vehicle volumes (~80M units in 2024) and premium optioning raise per-vehicle content 15–30% while production shocks cut orders ~20% (2020). Input costs (glass, chemicals, semis; global semis ~$600B in 2024) and OEM 2–4% annual cost-downs pressure margins; FY2024 sales $1.93B; FX and localized production mitigate risk.
| Metric | 2024 |
|---|---|
| LV production | ~80M |
| Net sales | $1.93B |
| Semiconductor market | $600B |
Preview the Actual Deliverable
Gentex PESTLE Analysis
The preview shown here is the exact Gentex PESTLE Analysis document you’ll receive after purchase—fully formatted and ready to use. The layout, content, and structure visible are identical to the downloadable file, with no placeholders or teasers. After payment you’ll instantly receive this exact, professionally structured report.











