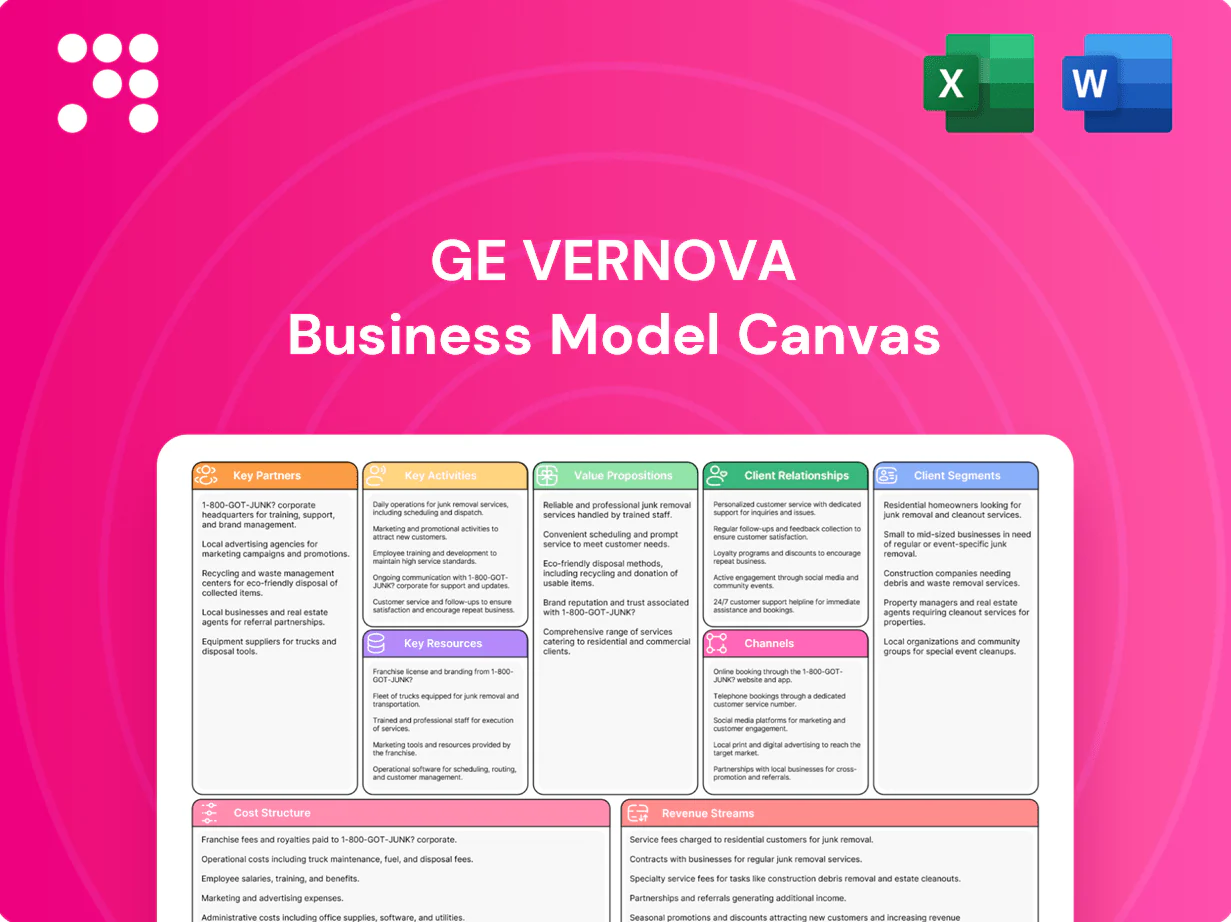
GE Vernova Business Model Canvas

Business Model Canvas for power, grid and renewable segments
Explore GE Vernova's Business Model Canvas to see how it creates value across power, grid, and renewable segments. This concise snapshot highlights customer segments, key partners, revenue streams and cost drivers. Purchase the full, editable Canvas to access detailed insights, financial implications, and ready-to-use templates for strategy or investor work.
Partnerships

Utilities and IPP alliances
Partnerships with utilities and independent power producers align GE Vernova on grid needs and long-term capacity plans, often anchored by 15–25 year power purchase agreements that provide offtake certainty. These partners co-develop projects and share engineering and interconnection planning, reducing integration risk for new generation assets. Multi-year frameworks translate into predictable project pipelines and services pull-through for maintenance and upgrades.
Turbomachinery and blade suppliers
Strategic vendors supply critical components for GE Vernova gas turbines, wind nacelles and blades, with co-engineering projects in 2024 focused on thermal efficiency and blade aerodynamics to raise reliability and manufacturability.
Dual-sourcing and formal qualification programs cut single-source exposure and supply disruptions, while multi-year supplier agreements (typically 5+ years) stabilize costs and lead times.

EPCs and project developers
EPCs and project developers accelerate GE Vernova project execution by bundling GE Vernova equipment with balance-of-plant and civil works, enabling coordinated schedules that reduce commissioning delays and improve cash conversion. Shared risk models with EPCs align incentives and increase delivery certainty; in 2024 GE Vernova continued cross-contract integration with major EPC partners to streamline scope and handover.

Digital and software ecosystems
Alliances with Microsoft Azure and AWS plus cybersecurity and OT platform partners expand GE Vernova digital offerings, enabling integrated analytics, predictive maintenance and automated grid orchestration. APIs and common data models drive interoperability with customer systems, while joint go-to-market efforts broaden reach and speed adoption; global cloud infrastructure spend rose roughly 30% in 2024 (IDC).
- Cloud partners: Azure, AWS
- Outcomes: analytics, predictive maintenance, grid orchestration
- Enablers: open APIs, shared data models, joint GTM
Governments and financing institutions
Governments and multilateral financing institutions in 2024 expanded support for energy transition projects, providing incentives and concessional loans that help GE Vernova scale grid, storage and generation deployments while de-risking investments in emerging markets and novel technologies.
PPAs 15–25 yrs, supplier pacts 5+ yrs, cloud spend +30%
Key partnerships with utilities/IPPs anchor 15–25 year PPAs that secure offtake and predictable pipelines. Strategic suppliers use 5+ year agreements and co-engineering to raise turbine and blade reliability. EPCs, cloud partners and multilaterals (cloud spend +30% in 2024) shorten delivery cycles, enable digital services and de-risk projects via concessional finance.
| Partner | Role | 2024 metric |
|---|---|---|
| Utilities/IPPs | Offtake, co-development | PPAs 15–25 yrs |
| Suppliers | Components, co‑engineering | Agreements 5+ yrs |
| Cloud | Analytics, OT | Infra spend +30% |
What is included in the product
 Detailed Word Document
A comprehensive Business Model Canvas tailored to GE Vernova’s energy-focused strategy, organized into the 9 classic BMC blocks with detailed customer segments, channels, value propositions and operations. Includes SWOT, competitive-advantage analysis and investor-ready insights for validation and planning.

 Customizable Excel Spreadsheet
Condenses GE Vernova’s complex energy and services portfolio into a one‑page, editable canvas to quickly pinpoint strategic gaps and streamline decision-making for teams and boards.
Activities

Design and manufacturing of equipment
Design and manufacturing of gas and wind turbines plus grid hardware are core to GE Vernova, with advanced engineering targeting efficiency, durability, and modularity to meet utility and industrial needs. GE's HA-class gas turbines reached about 64% combined-cycle efficiency in 2024, reflecting efficiency gains. Manufacturing excellence and global production lines prioritize quality and cost competitiveness. Continuous improvement programs cut cycle times and defect rates year-over-year.
Project delivery and commissioning
End-to-end project delivery brings plants and wind farms online safely, coordinating site management, logistics and installation to meet timelines and HSE targets. Commissioning validates performance and compliance against contract specs and regulatory standards, with post-commission testing and documentation. Lessons learned are fed into standards and playbooks to reduce turnaround time and rework for future projects.

Lifecycle services and upgrades
Maintenance, parts and performance upgrades extend asset life, with condition-based repairs from remote monitoring shown to cut unplanned downtime by up to 30% and reduce maintenance costs. Service agreements deliver uptime guarantees and cost predictability, often backing availability targets above 95%. Lifecycle upgrades capture efficiency gains of roughly 3–8% and emissions reductions in the range of 5–12%.

Digital development and analytics
Building software for asset performance, grid management, and market optimization creates clear differentiation for GE Vernova, a company with about 50,000 employees in 2024. Data ingestion and modeling underpin predictive insights across fleets and grids. Cybersecurity and compliance are embedded by design. Continuous customer feedback loops drive roadmap prioritization and feature deployment.
- Asset software differentiation
- Predictive data modeling
- Security and compliance by design
- Customer-driven roadmap
Policy, partnerships, and market shaping
Engaging stakeholders accelerates grid modernization and decarbonization pathways, supporting deployment where 139 countries had net-zero targets by 2024 covering over 90% of global emissions; thought leadership shapes standards and incentives to mobilize capital and policy. Strategic partnerships unlock scale in priority regions, while proactive risk management aligns offerings with evolving regulatory and market dynamics.
- Stakeholders: grid operators, regulators, utilities
- Thought leadership: standards, incentives, policy
- Partnerships: regional scale-up, market entry
- Risk: regulatory alignment, market hedging
HA-class turbines ~64% efficiency; services cut downtime up to 30%, >95% availability
Design/manufacture of gas and wind turbines and grid hardware; HA-class gas turbines ~64% combined-cycle efficiency in 2024 and global CI programs.
End-to-end project delivery, commissioning and HSE with playbooks to reduce rework and cycle time.
Services and remote monitoring cut unplanned downtime up to 30%, availability targets >95%; software/data across ~50,000 employees (2024).
| Metric | 2024 |
|---|---|
| HA-class efficiency | ~64% |
| Employees | ~50,000 |
| Unplanned downtime reduction | up to 30% |
| Availability targets | >95% |
Full Version Awaits
Business Model Canvas
The GE Vernova Business Model Canvas you’re previewing is the actual deliverable, not a mockup. When you purchase, you’ll receive this same complete document—fully formatted and editable. The file is delivered exactly as shown, ready to download and use.

Business Model Canvas for power, grid and renewable segments
Explore GE Vernova's Business Model Canvas to see how it creates value across power, grid, and renewable segments. This concise snapshot highlights customer segments, key partners, revenue streams and cost drivers. Purchase the full, editable Canvas to access detailed insights, financial implications, and ready-to-use templates for strategy or investor work.
Partnerships
Utilities and IPP alliances
Partnerships with utilities and independent power producers align GE Vernova on grid needs and long-term capacity plans, often anchored by 15–25 year power purchase agreements that provide offtake certainty. These partners co-develop projects and share engineering and interconnection planning, reducing integration risk for new generation assets. Multi-year frameworks translate into predictable project pipelines and services pull-through for maintenance and upgrades.
Turbomachinery and blade suppliers
Strategic vendors supply critical components for GE Vernova gas turbines, wind nacelles and blades, with co-engineering projects in 2024 focused on thermal efficiency and blade aerodynamics to raise reliability and manufacturability.
Dual-sourcing and formal qualification programs cut single-source exposure and supply disruptions, while multi-year supplier agreements (typically 5+ years) stabilize costs and lead times.
EPCs and project developers
EPCs and project developers accelerate GE Vernova project execution by bundling GE Vernova equipment with balance-of-plant and civil works, enabling coordinated schedules that reduce commissioning delays and improve cash conversion. Shared risk models with EPCs align incentives and increase delivery certainty; in 2024 GE Vernova continued cross-contract integration with major EPC partners to streamline scope and handover.
Digital and software ecosystems
Alliances with Microsoft Azure and AWS plus cybersecurity and OT platform partners expand GE Vernova digital offerings, enabling integrated analytics, predictive maintenance and automated grid orchestration. APIs and common data models drive interoperability with customer systems, while joint go-to-market efforts broaden reach and speed adoption; global cloud infrastructure spend rose roughly 30% in 2024 (IDC).
- Cloud partners: Azure, AWS
- Outcomes: analytics, predictive maintenance, grid orchestration
- Enablers: open APIs, shared data models, joint GTM
Governments and financing institutions
Governments and multilateral financing institutions in 2024 expanded support for energy transition projects, providing incentives and concessional loans that help GE Vernova scale grid, storage and generation deployments while de-risking investments in emerging markets and novel technologies.
PPAs 15–25 yrs, supplier pacts 5+ yrs, cloud spend +30%
Key partnerships with utilities/IPPs anchor 15–25 year PPAs that secure offtake and predictable pipelines. Strategic suppliers use 5+ year agreements and co-engineering to raise turbine and blade reliability. EPCs, cloud partners and multilaterals (cloud spend +30% in 2024) shorten delivery cycles, enable digital services and de-risk projects via concessional finance.
| Partner | Role | 2024 metric |
|---|---|---|
| Utilities/IPPs | Offtake, co-development | PPAs 15–25 yrs |
| Suppliers | Components, co‑engineering | Agreements 5+ yrs |
| Cloud | Analytics, OT | Infra spend +30% |
What is included in the product
Detailed Word Document
A comprehensive Business Model Canvas tailored to GE Vernova’s energy-focused strategy, organized into the 9 classic BMC blocks with detailed customer segments, channels, value propositions and operations. Includes SWOT, competitive-advantage analysis and investor-ready insights for validation and planning.
Customizable Excel Spreadsheet
Condenses GE Vernova’s complex energy and services portfolio into a one‑page, editable canvas to quickly pinpoint strategic gaps and streamline decision-making for teams and boards.
Activities
Design and manufacturing of equipment
Design and manufacturing of gas and wind turbines plus grid hardware are core to GE Vernova, with advanced engineering targeting efficiency, durability, and modularity to meet utility and industrial needs. GE's HA-class gas turbines reached about 64% combined-cycle efficiency in 2024, reflecting efficiency gains. Manufacturing excellence and global production lines prioritize quality and cost competitiveness. Continuous improvement programs cut cycle times and defect rates year-over-year.
Project delivery and commissioning
End-to-end project delivery brings plants and wind farms online safely, coordinating site management, logistics and installation to meet timelines and HSE targets. Commissioning validates performance and compliance against contract specs and regulatory standards, with post-commission testing and documentation. Lessons learned are fed into standards and playbooks to reduce turnaround time and rework for future projects.
Lifecycle services and upgrades
Maintenance, parts and performance upgrades extend asset life, with condition-based repairs from remote monitoring shown to cut unplanned downtime by up to 30% and reduce maintenance costs. Service agreements deliver uptime guarantees and cost predictability, often backing availability targets above 95%. Lifecycle upgrades capture efficiency gains of roughly 3–8% and emissions reductions in the range of 5–12%.
Digital development and analytics
Building software for asset performance, grid management, and market optimization creates clear differentiation for GE Vernova, a company with about 50,000 employees in 2024. Data ingestion and modeling underpin predictive insights across fleets and grids. Cybersecurity and compliance are embedded by design. Continuous customer feedback loops drive roadmap prioritization and feature deployment.
- Asset software differentiation
- Predictive data modeling
- Security and compliance by design
- Customer-driven roadmap
Policy, partnerships, and market shaping
Engaging stakeholders accelerates grid modernization and decarbonization pathways, supporting deployment where 139 countries had net-zero targets by 2024 covering over 90% of global emissions; thought leadership shapes standards and incentives to mobilize capital and policy. Strategic partnerships unlock scale in priority regions, while proactive risk management aligns offerings with evolving regulatory and market dynamics.
- Stakeholders: grid operators, regulators, utilities
- Thought leadership: standards, incentives, policy
- Partnerships: regional scale-up, market entry
- Risk: regulatory alignment, market hedging
HA-class turbines ~64% efficiency; services cut downtime up to 30%, >95% availability
Design/manufacture of gas and wind turbines and grid hardware; HA-class gas turbines ~64% combined-cycle efficiency in 2024 and global CI programs.
End-to-end project delivery, commissioning and HSE with playbooks to reduce rework and cycle time.
Services and remote monitoring cut unplanned downtime up to 30%, availability targets >95%; software/data across ~50,000 employees (2024).
| Metric | 2024 |
|---|---|
| HA-class efficiency | ~64% |
| Employees | ~50,000 |
| Unplanned downtime reduction | up to 30% |
| Availability targets | >95% |
Full Version Awaits
Business Model Canvas
The GE Vernova Business Model Canvas you’re previewing is the actual deliverable, not a mockup. When you purchase, you’ll receive this same complete document—fully formatted and editable. The file is delivered exactly as shown, ready to download and use.
Original: $10.00
-65%$10.00
$3.50Description
Business Model Canvas for power, grid and renewable segments
Explore GE Vernova's Business Model Canvas to see how it creates value across power, grid, and renewable segments. This concise snapshot highlights customer segments, key partners, revenue streams and cost drivers. Purchase the full, editable Canvas to access detailed insights, financial implications, and ready-to-use templates for strategy or investor work.
Partnerships
Utilities and IPP alliances
Partnerships with utilities and independent power producers align GE Vernova on grid needs and long-term capacity plans, often anchored by 15–25 year power purchase agreements that provide offtake certainty. These partners co-develop projects and share engineering and interconnection planning, reducing integration risk for new generation assets. Multi-year frameworks translate into predictable project pipelines and services pull-through for maintenance and upgrades.
Turbomachinery and blade suppliers
Strategic vendors supply critical components for GE Vernova gas turbines, wind nacelles and blades, with co-engineering projects in 2024 focused on thermal efficiency and blade aerodynamics to raise reliability and manufacturability.
Dual-sourcing and formal qualification programs cut single-source exposure and supply disruptions, while multi-year supplier agreements (typically 5+ years) stabilize costs and lead times.
EPCs and project developers
EPCs and project developers accelerate GE Vernova project execution by bundling GE Vernova equipment with balance-of-plant and civil works, enabling coordinated schedules that reduce commissioning delays and improve cash conversion. Shared risk models with EPCs align incentives and increase delivery certainty; in 2024 GE Vernova continued cross-contract integration with major EPC partners to streamline scope and handover.
Digital and software ecosystems
Alliances with Microsoft Azure and AWS plus cybersecurity and OT platform partners expand GE Vernova digital offerings, enabling integrated analytics, predictive maintenance and automated grid orchestration. APIs and common data models drive interoperability with customer systems, while joint go-to-market efforts broaden reach and speed adoption; global cloud infrastructure spend rose roughly 30% in 2024 (IDC).
- Cloud partners: Azure, AWS
- Outcomes: analytics, predictive maintenance, grid orchestration
- Enablers: open APIs, shared data models, joint GTM
Governments and financing institutions
Governments and multilateral financing institutions in 2024 expanded support for energy transition projects, providing incentives and concessional loans that help GE Vernova scale grid, storage and generation deployments while de-risking investments in emerging markets and novel technologies.
PPAs 15–25 yrs, supplier pacts 5+ yrs, cloud spend +30%
Key partnerships with utilities/IPPs anchor 15–25 year PPAs that secure offtake and predictable pipelines. Strategic suppliers use 5+ year agreements and co-engineering to raise turbine and blade reliability. EPCs, cloud partners and multilaterals (cloud spend +30% in 2024) shorten delivery cycles, enable digital services and de-risk projects via concessional finance.
| Partner | Role | 2024 metric |
|---|---|---|
| Utilities/IPPs | Offtake, co-development | PPAs 15–25 yrs |
| Suppliers | Components, co‑engineering | Agreements 5+ yrs |
| Cloud | Analytics, OT | Infra spend +30% |
What is included in the product
Detailed Word Document
A comprehensive Business Model Canvas tailored to GE Vernova’s energy-focused strategy, organized into the 9 classic BMC blocks with detailed customer segments, channels, value propositions and operations. Includes SWOT, competitive-advantage analysis and investor-ready insights for validation and planning.
Customizable Excel Spreadsheet
Condenses GE Vernova’s complex energy and services portfolio into a one‑page, editable canvas to quickly pinpoint strategic gaps and streamline decision-making for teams and boards.
Activities
Design and manufacturing of equipment
Design and manufacturing of gas and wind turbines plus grid hardware are core to GE Vernova, with advanced engineering targeting efficiency, durability, and modularity to meet utility and industrial needs. GE's HA-class gas turbines reached about 64% combined-cycle efficiency in 2024, reflecting efficiency gains. Manufacturing excellence and global production lines prioritize quality and cost competitiveness. Continuous improvement programs cut cycle times and defect rates year-over-year.
Project delivery and commissioning
End-to-end project delivery brings plants and wind farms online safely, coordinating site management, logistics and installation to meet timelines and HSE targets. Commissioning validates performance and compliance against contract specs and regulatory standards, with post-commission testing and documentation. Lessons learned are fed into standards and playbooks to reduce turnaround time and rework for future projects.
Lifecycle services and upgrades
Maintenance, parts and performance upgrades extend asset life, with condition-based repairs from remote monitoring shown to cut unplanned downtime by up to 30% and reduce maintenance costs. Service agreements deliver uptime guarantees and cost predictability, often backing availability targets above 95%. Lifecycle upgrades capture efficiency gains of roughly 3–8% and emissions reductions in the range of 5–12%.
Digital development and analytics
Building software for asset performance, grid management, and market optimization creates clear differentiation for GE Vernova, a company with about 50,000 employees in 2024. Data ingestion and modeling underpin predictive insights across fleets and grids. Cybersecurity and compliance are embedded by design. Continuous customer feedback loops drive roadmap prioritization and feature deployment.
- Asset software differentiation
- Predictive data modeling
- Security and compliance by design
- Customer-driven roadmap
Policy, partnerships, and market shaping
Engaging stakeholders accelerates grid modernization and decarbonization pathways, supporting deployment where 139 countries had net-zero targets by 2024 covering over 90% of global emissions; thought leadership shapes standards and incentives to mobilize capital and policy. Strategic partnerships unlock scale in priority regions, while proactive risk management aligns offerings with evolving regulatory and market dynamics.
- Stakeholders: grid operators, regulators, utilities
- Thought leadership: standards, incentives, policy
- Partnerships: regional scale-up, market entry
- Risk: regulatory alignment, market hedging
HA-class turbines ~64% efficiency; services cut downtime up to 30%, >95% availability
Design/manufacture of gas and wind turbines and grid hardware; HA-class gas turbines ~64% combined-cycle efficiency in 2024 and global CI programs.
End-to-end project delivery, commissioning and HSE with playbooks to reduce rework and cycle time.
Services and remote monitoring cut unplanned downtime up to 30%, availability targets >95%; software/data across ~50,000 employees (2024).
| Metric | 2024 |
|---|---|
| HA-class efficiency | ~64% |
| Employees | ~50,000 |
| Unplanned downtime reduction | up to 30% |
| Availability targets | >95% |
Full Version Awaits
Business Model Canvas
The GE Vernova Business Model Canvas you’re previewing is the actual deliverable, not a mockup. When you purchase, you’ll receive this same complete document—fully formatted and editable. The file is delivered exactly as shown, ready to download and use.











