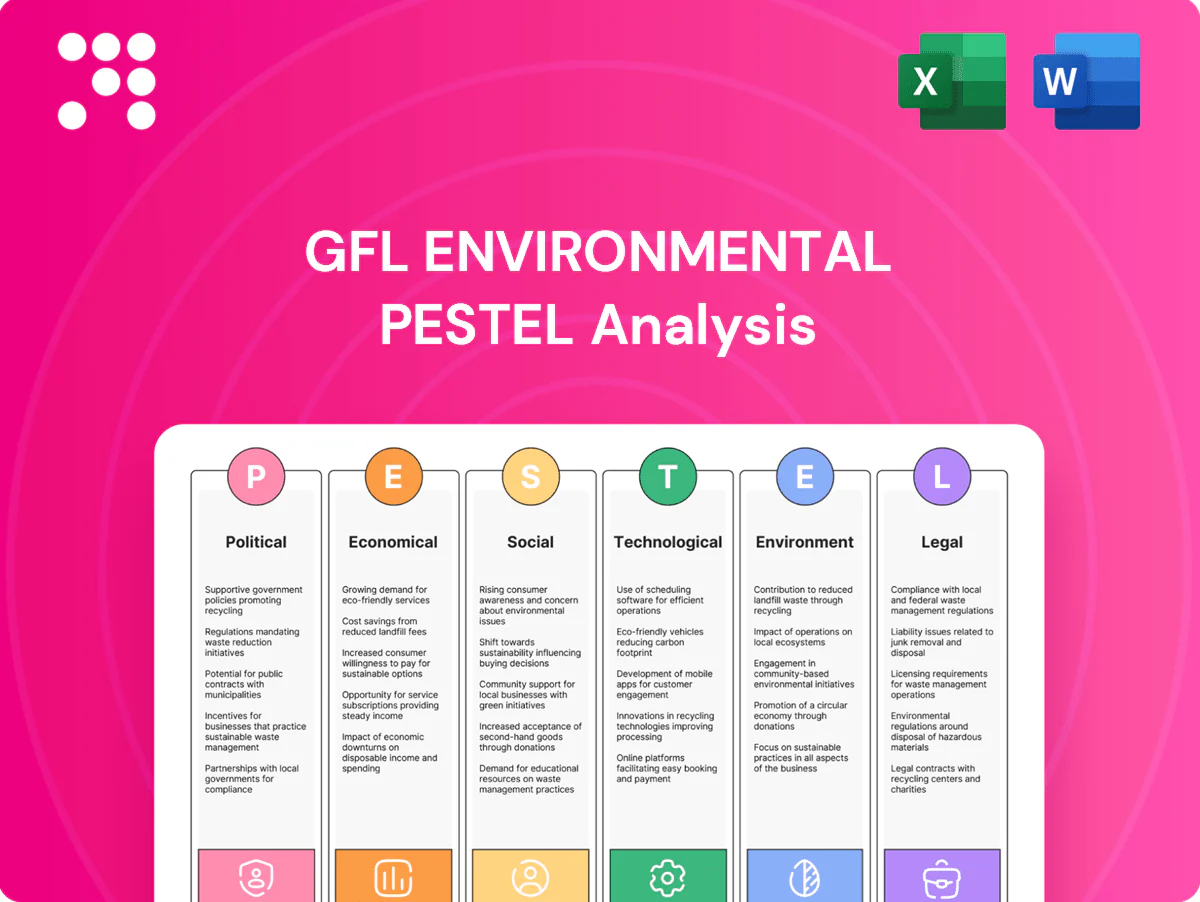
GFL Environmental PESTLE Analysis

Your Competitive Advantage Starts with This Report
Discover how political shifts, environmental policy, and technological innovation are reshaping GFL Environmental’s prospects in our concise PESTLE snapshot. Use these insights to de-risk decisions and spot growth opportunities—purchase the full PESTLE for the detailed, downloadable analysis.
Political factors

Municipal contract dynamics
Local governments control most collection and disposal contracts, typically awarded for 3–10 year terms, directly shaping GFL’s pricing, service standards and renewal risk.
Competitive bidding cycles create revenue volatility but also expansion opportunities when municipalities reprocure services.
Policy priorities such as curbside organics rollout and municipal diversion targets (many set for 2030) can materially change contract scope and cost structures, while stable relationships and measurable performance metrics strongly influence rebid outcomes.
Cross-border policy alignment
GFL operates across Canada and the US, so differing federal, state and provincial rules directly affect compliance costs and permitted technologies. Cross‑border waste movement and customs controls shape routing and disposal options. Shifts in US EPA and Environment and Climate Change Canada priorities (eg PFAS, methane) change monitoring and reporting requirements. Harmonization eases operations, while divergence — notably the US not being party to the Basel Convention while Canada is — raises administrative burden.

Infrastructure funding agendas
Government programs such as the US Infrastructure Investment and Jobs Act (total package ~$1.2 trillion, with ~$550 billion in new federal spending) and the Inflation Reduction Act (~$369 billion in climate investment) boost demand for roads, water and remediation services, catalyzing soil remediation and infrastructure work. Stimulus and green investment accelerate remediation and recycling projects, while budget cuts or project delays can reduce construction-linked volumes. Public incentives for RNG and landfill-gas projects under federal and state programs shift capital toward biogas capture and renewable fuel conversions.

Public–private partnership models
Public–private partnership frameworks set risk sharing for waste facilities, transfer stations and recycling plants; concession length and performance guarantees materially affect returns and capex recovery. Political shifts alter PPP appetite and renegotiation risk; GFL reported 2024 revenue ~US$7.9bn with capex ~US$770m, amplifying sensitivity to contract terms and pipeline visibility.
- Risk sharing: concession vs availability payments
- Returns: guarantees drive IRR and payback
- Political risk: renegotiation exposure
- Governance: transparency improves bid quality
Local permitting and siting politics
Regional permitting, zoning and community approval processes commonly drive 18–36 month timelines for landfills, MRFs and depots; local opposition can impose conditions, raise capital and operating costs, or delay projects into multi‑year timelines. Political leadership changes at municipal or provincial/state levels can tighten environmental conditions or accelerate approvals; proactive stakeholder engagement reduces NIMBY risk.
- Permitting timelines: 18–36 months
- Local opposition: multi‑year delays, higher costs
- Leadership shifts: regulatory tightening or fast‑tracking
- Mitigation: proactive stakeholder engagement
Municipal contracts and tightening regulations drive pricing risk and growth via federal funding
Municipal contract awards (3–10yr) drive pricing and renewal risk, while competitive rebids create revenue volatility and expansion opportunities. Divergent Canada–US rules (eg Basel Convention, PFAS) and rising EPA/ECCC standards increase compliance costs. Federal programs (IIJA ~$1.2T, IRA ~$369B) and RNG incentives boost remediation and biogas demand; GFL 2024 revenue ~US$7.9bn, capex ~US$770m; permitting 18–36 months.
| Metric | Impact | 2024/2025 datapoint |
|---|---|---|
| Revenue | Scale exposure to contracts | US$7.9bn (2024) |
| Capex | Growth & compliance spend | ~US$770m (2024) |
| Permitting | Project timing risk | 18–36 months |
| Federal programs | Stimulus for projects | IIJA ~$1.2T; IRA ~$369B |
What is included in the product
 Detailed Word Document
Explores how macro-environmental factors—Political, Economic, Social, Technological, Environmental, and Legal—uniquely affect GFL Environmental, with each category expanded into specific, actionable subpoints. Every section is data-backed, forward-looking, and formatted for executives, investors, and strategists to identify threats, opportunities, and scenario-driven responses.

 Customizable Excel Spreadsheet
A concise, visually segmented PESTLE summary for GFL Environmental that relieves prep pain by being slide-ready, easily shareable across teams, and simple to annotate with region- or business-line notes for faster risk discussions and strategy alignment.
Economic factors

Recyclable commodity price cycles
Revenue from paper, plastics and metals is highly sensitive to global commodity cycles; OCC prices slid about 40% from peak years to roughly USD 60–80/ton in 2024, while ferrous scrap recovered ~15% y/y and PCR polyethylene traded near USD 1,100–1,400/ton in 2024. Price swings compress MRF margins and complicate contractor risk-sharing, raising contamination penalties. Hedging and floor-price mechanisms have been adopted to stabilize cash flows and protect EBITDA. Market access and strict quality specs continue to drive realized pricing and recycle yields.
Interest rates and leverage
Waste services are capital intensive, so borrowing costs drive returns; with US policy rates near 5.25–5.50% in 2024–25, higher rates raise fleet, landfill cell and facility financing costs materially. Elevated rates increase refinancing risk and constrain MFLs debt capacity, limiting M&A-fueled growth—GFL reported leverage around mid-4x net debt/EBITDA in recent filings, heightening sensitivity. Strong cash generation and staggered maturities through 2024–25 improve resilience.

Fuel and energy costs
Diesel averaged about $3.90/gal in 2024–H1 2025, and CNG pricing volatility directly compresses route economics and margins for GFL; fuel typically represents a material portion of collection OPEX. Fuel surcharges and route-optimization tools have historically enabled pass-throughs that protect per-route margins. GFL’s growing RNG projects can hedge fuel exposure over time by replacing diesel in collection fleets, while rising electricity and natural gas prices increase costs for transfer stations and treatment processes.

Labor availability and wage inflation
Tight driver and technician markets persist in North America, with the American Trucking Associations estimating a driver shortfall near 80,000 in 2023, pressuring wages and turnover for GFL operations. Investment in training, safety, and retention programs sustains service quality and lowers overtime costs, while automation (route optimization, automated collection) eases labor constraints but increases demand for skilled maintenance technicians. Union dynamics, notably negotiations involving the Teamsters, can introduce wage and benefit volatility that affects cost stability.
- Labor shortage: ATA ~80,000 drivers (2023)
- Retention focus: training and safety reduce overtime
- Automation: lowers headcount but raises skilled-maintenance needs
- Union risk: collective bargaining affects wage predictability
Macro growth and construction cycles
Residential and commercial construction activity directly drives municipal waste volumes and container demand, while infrastructure and industrial cycles govern soil remediation and liquid waste services; downturns compress discretionary volumes but essential collection and environmental services provide downside protection. Diversification across regions and customer segments moderates cyclicality and stabilizes cash flows for GFL.
- Residential/commercial → container & MSW demand
- Infrastructure/industrial → soil remediation, liquid waste
- Downturns hit discretionary volumes; essentials defend revenue
- Regional and service diversification reduces volatility
Municipal contracts and tightening regulations drive pricing risk and growth via federal funding
Commodity swings: OCC ~$60–80/ton (2024), ferrous scrap +15% y/y (2024), PCR PE ~$1,100–1,400/ton (2024). Rates and leverage: US policy 5.25–5.50% (2024–25); GFL leverage ~4x net debt/EBITDA. Fuel and labor: diesel ~$3.90/gal (2024–H1 2025); driver shortfall ~80,000 (2023) pressuring wages and margins.
| Metric | 2024–25 |
|---|---|
| OCC | $60–80/ton |
| PCR PE | $1,100–1,400/ton |
| Policy rate | 5.25–5.50% |
| Net debt/EBITDA | ~4x |
| Diesel | $3.90/gal |
| Driver gap | ~80,000 |
Same Document Delivered
GFL Environmental PESTLE Analysis
This GFL Environmental PESTLE Analysis preview is the exact document you’ll receive after purchase—fully formatted and ready to use. The layout, content, and structure visible here are precisely what you’ll download immediately after buying. No placeholders, no teasers—this is the real, final file.

Your Competitive Advantage Starts with This Report
Discover how political shifts, environmental policy, and technological innovation are reshaping GFL Environmental’s prospects in our concise PESTLE snapshot. Use these insights to de-risk decisions and spot growth opportunities—purchase the full PESTLE for the detailed, downloadable analysis.
Political factors
Municipal contract dynamics
Local governments control most collection and disposal contracts, typically awarded for 3–10 year terms, directly shaping GFL’s pricing, service standards and renewal risk.
Competitive bidding cycles create revenue volatility but also expansion opportunities when municipalities reprocure services.
Policy priorities such as curbside organics rollout and municipal diversion targets (many set for 2030) can materially change contract scope and cost structures, while stable relationships and measurable performance metrics strongly influence rebid outcomes.
Cross-border policy alignment
GFL operates across Canada and the US, so differing federal, state and provincial rules directly affect compliance costs and permitted technologies. Cross‑border waste movement and customs controls shape routing and disposal options. Shifts in US EPA and Environment and Climate Change Canada priorities (eg PFAS, methane) change monitoring and reporting requirements. Harmonization eases operations, while divergence — notably the US not being party to the Basel Convention while Canada is — raises administrative burden.
Infrastructure funding agendas
Government programs such as the US Infrastructure Investment and Jobs Act (total package ~$1.2 trillion, with ~$550 billion in new federal spending) and the Inflation Reduction Act (~$369 billion in climate investment) boost demand for roads, water and remediation services, catalyzing soil remediation and infrastructure work. Stimulus and green investment accelerate remediation and recycling projects, while budget cuts or project delays can reduce construction-linked volumes. Public incentives for RNG and landfill-gas projects under federal and state programs shift capital toward biogas capture and renewable fuel conversions.
Public–private partnership models
Public–private partnership frameworks set risk sharing for waste facilities, transfer stations and recycling plants; concession length and performance guarantees materially affect returns and capex recovery. Political shifts alter PPP appetite and renegotiation risk; GFL reported 2024 revenue ~US$7.9bn with capex ~US$770m, amplifying sensitivity to contract terms and pipeline visibility.
- Risk sharing: concession vs availability payments
- Returns: guarantees drive IRR and payback
- Political risk: renegotiation exposure
- Governance: transparency improves bid quality
Local permitting and siting politics
Regional permitting, zoning and community approval processes commonly drive 18–36 month timelines for landfills, MRFs and depots; local opposition can impose conditions, raise capital and operating costs, or delay projects into multi‑year timelines. Political leadership changes at municipal or provincial/state levels can tighten environmental conditions or accelerate approvals; proactive stakeholder engagement reduces NIMBY risk.
- Permitting timelines: 18–36 months
- Local opposition: multi‑year delays, higher costs
- Leadership shifts: regulatory tightening or fast‑tracking
- Mitigation: proactive stakeholder engagement
Municipal contracts and tightening regulations drive pricing risk and growth via federal funding
Municipal contract awards (3–10yr) drive pricing and renewal risk, while competitive rebids create revenue volatility and expansion opportunities. Divergent Canada–US rules (eg Basel Convention, PFAS) and rising EPA/ECCC standards increase compliance costs. Federal programs (IIJA ~$1.2T, IRA ~$369B) and RNG incentives boost remediation and biogas demand; GFL 2024 revenue ~US$7.9bn, capex ~US$770m; permitting 18–36 months.
| Metric | Impact | 2024/2025 datapoint |
|---|---|---|
| Revenue | Scale exposure to contracts | US$7.9bn (2024) |
| Capex | Growth & compliance spend | ~US$770m (2024) |
| Permitting | Project timing risk | 18–36 months |
| Federal programs | Stimulus for projects | IIJA ~$1.2T; IRA ~$369B |
What is included in the product
Detailed Word Document
Explores how macro-environmental factors—Political, Economic, Social, Technological, Environmental, and Legal—uniquely affect GFL Environmental, with each category expanded into specific, actionable subpoints. Every section is data-backed, forward-looking, and formatted for executives, investors, and strategists to identify threats, opportunities, and scenario-driven responses.
Customizable Excel Spreadsheet
A concise, visually segmented PESTLE summary for GFL Environmental that relieves prep pain by being slide-ready, easily shareable across teams, and simple to annotate with region- or business-line notes for faster risk discussions and strategy alignment.
Economic factors
Recyclable commodity price cycles
Revenue from paper, plastics and metals is highly sensitive to global commodity cycles; OCC prices slid about 40% from peak years to roughly USD 60–80/ton in 2024, while ferrous scrap recovered ~15% y/y and PCR polyethylene traded near USD 1,100–1,400/ton in 2024. Price swings compress MRF margins and complicate contractor risk-sharing, raising contamination penalties. Hedging and floor-price mechanisms have been adopted to stabilize cash flows and protect EBITDA. Market access and strict quality specs continue to drive realized pricing and recycle yields.
Interest rates and leverage
Waste services are capital intensive, so borrowing costs drive returns; with US policy rates near 5.25–5.50% in 2024–25, higher rates raise fleet, landfill cell and facility financing costs materially. Elevated rates increase refinancing risk and constrain MFLs debt capacity, limiting M&A-fueled growth—GFL reported leverage around mid-4x net debt/EBITDA in recent filings, heightening sensitivity. Strong cash generation and staggered maturities through 2024–25 improve resilience.
Fuel and energy costs
Diesel averaged about $3.90/gal in 2024–H1 2025, and CNG pricing volatility directly compresses route economics and margins for GFL; fuel typically represents a material portion of collection OPEX. Fuel surcharges and route-optimization tools have historically enabled pass-throughs that protect per-route margins. GFL’s growing RNG projects can hedge fuel exposure over time by replacing diesel in collection fleets, while rising electricity and natural gas prices increase costs for transfer stations and treatment processes.
Labor availability and wage inflation
Tight driver and technician markets persist in North America, with the American Trucking Associations estimating a driver shortfall near 80,000 in 2023, pressuring wages and turnover for GFL operations. Investment in training, safety, and retention programs sustains service quality and lowers overtime costs, while automation (route optimization, automated collection) eases labor constraints but increases demand for skilled maintenance technicians. Union dynamics, notably negotiations involving the Teamsters, can introduce wage and benefit volatility that affects cost stability.
- Labor shortage: ATA ~80,000 drivers (2023)
- Retention focus: training and safety reduce overtime
- Automation: lowers headcount but raises skilled-maintenance needs
- Union risk: collective bargaining affects wage predictability
Macro growth and construction cycles
Residential and commercial construction activity directly drives municipal waste volumes and container demand, while infrastructure and industrial cycles govern soil remediation and liquid waste services; downturns compress discretionary volumes but essential collection and environmental services provide downside protection. Diversification across regions and customer segments moderates cyclicality and stabilizes cash flows for GFL.
- Residential/commercial → container & MSW demand
- Infrastructure/industrial → soil remediation, liquid waste
- Downturns hit discretionary volumes; essentials defend revenue
- Regional and service diversification reduces volatility
Municipal contracts and tightening regulations drive pricing risk and growth via federal funding
Commodity swings: OCC ~$60–80/ton (2024), ferrous scrap +15% y/y (2024), PCR PE ~$1,100–1,400/ton (2024). Rates and leverage: US policy 5.25–5.50% (2024–25); GFL leverage ~4x net debt/EBITDA. Fuel and labor: diesel ~$3.90/gal (2024–H1 2025); driver shortfall ~80,000 (2023) pressuring wages and margins.
| Metric | 2024–25 |
|---|---|
| OCC | $60–80/ton |
| PCR PE | $1,100–1,400/ton |
| Policy rate | 5.25–5.50% |
| Net debt/EBITDA | ~4x |
| Diesel | $3.90/gal |
| Driver gap | ~80,000 |
Same Document Delivered
GFL Environmental PESTLE Analysis
This GFL Environmental PESTLE Analysis preview is the exact document you’ll receive after purchase—fully formatted and ready to use. The layout, content, and structure visible here are precisely what you’ll download immediately after buying. No placeholders, no teasers—this is the real, final file.
Original: $10.00
-65%$10.00
$3.50Description
Your Competitive Advantage Starts with This Report
Discover how political shifts, environmental policy, and technological innovation are reshaping GFL Environmental’s prospects in our concise PESTLE snapshot. Use these insights to de-risk decisions and spot growth opportunities—purchase the full PESTLE for the detailed, downloadable analysis.
Political factors
Municipal contract dynamics
Local governments control most collection and disposal contracts, typically awarded for 3–10 year terms, directly shaping GFL’s pricing, service standards and renewal risk.
Competitive bidding cycles create revenue volatility but also expansion opportunities when municipalities reprocure services.
Policy priorities such as curbside organics rollout and municipal diversion targets (many set for 2030) can materially change contract scope and cost structures, while stable relationships and measurable performance metrics strongly influence rebid outcomes.
Cross-border policy alignment
GFL operates across Canada and the US, so differing federal, state and provincial rules directly affect compliance costs and permitted technologies. Cross‑border waste movement and customs controls shape routing and disposal options. Shifts in US EPA and Environment and Climate Change Canada priorities (eg PFAS, methane) change monitoring and reporting requirements. Harmonization eases operations, while divergence — notably the US not being party to the Basel Convention while Canada is — raises administrative burden.
Infrastructure funding agendas
Government programs such as the US Infrastructure Investment and Jobs Act (total package ~$1.2 trillion, with ~$550 billion in new federal spending) and the Inflation Reduction Act (~$369 billion in climate investment) boost demand for roads, water and remediation services, catalyzing soil remediation and infrastructure work. Stimulus and green investment accelerate remediation and recycling projects, while budget cuts or project delays can reduce construction-linked volumes. Public incentives for RNG and landfill-gas projects under federal and state programs shift capital toward biogas capture and renewable fuel conversions.
Public–private partnership models
Public–private partnership frameworks set risk sharing for waste facilities, transfer stations and recycling plants; concession length and performance guarantees materially affect returns and capex recovery. Political shifts alter PPP appetite and renegotiation risk; GFL reported 2024 revenue ~US$7.9bn with capex ~US$770m, amplifying sensitivity to contract terms and pipeline visibility.
- Risk sharing: concession vs availability payments
- Returns: guarantees drive IRR and payback
- Political risk: renegotiation exposure
- Governance: transparency improves bid quality
Local permitting and siting politics
Regional permitting, zoning and community approval processes commonly drive 18–36 month timelines for landfills, MRFs and depots; local opposition can impose conditions, raise capital and operating costs, or delay projects into multi‑year timelines. Political leadership changes at municipal or provincial/state levels can tighten environmental conditions or accelerate approvals; proactive stakeholder engagement reduces NIMBY risk.
- Permitting timelines: 18–36 months
- Local opposition: multi‑year delays, higher costs
- Leadership shifts: regulatory tightening or fast‑tracking
- Mitigation: proactive stakeholder engagement
Municipal contracts and tightening regulations drive pricing risk and growth via federal funding
Municipal contract awards (3–10yr) drive pricing and renewal risk, while competitive rebids create revenue volatility and expansion opportunities. Divergent Canada–US rules (eg Basel Convention, PFAS) and rising EPA/ECCC standards increase compliance costs. Federal programs (IIJA ~$1.2T, IRA ~$369B) and RNG incentives boost remediation and biogas demand; GFL 2024 revenue ~US$7.9bn, capex ~US$770m; permitting 18–36 months.
| Metric | Impact | 2024/2025 datapoint |
|---|---|---|
| Revenue | Scale exposure to contracts | US$7.9bn (2024) |
| Capex | Growth & compliance spend | ~US$770m (2024) |
| Permitting | Project timing risk | 18–36 months |
| Federal programs | Stimulus for projects | IIJA ~$1.2T; IRA ~$369B |
What is included in the product
Detailed Word Document
Explores how macro-environmental factors—Political, Economic, Social, Technological, Environmental, and Legal—uniquely affect GFL Environmental, with each category expanded into specific, actionable subpoints. Every section is data-backed, forward-looking, and formatted for executives, investors, and strategists to identify threats, opportunities, and scenario-driven responses.
Customizable Excel Spreadsheet
A concise, visually segmented PESTLE summary for GFL Environmental that relieves prep pain by being slide-ready, easily shareable across teams, and simple to annotate with region- or business-line notes for faster risk discussions and strategy alignment.
Economic factors
Recyclable commodity price cycles
Revenue from paper, plastics and metals is highly sensitive to global commodity cycles; OCC prices slid about 40% from peak years to roughly USD 60–80/ton in 2024, while ferrous scrap recovered ~15% y/y and PCR polyethylene traded near USD 1,100–1,400/ton in 2024. Price swings compress MRF margins and complicate contractor risk-sharing, raising contamination penalties. Hedging and floor-price mechanisms have been adopted to stabilize cash flows and protect EBITDA. Market access and strict quality specs continue to drive realized pricing and recycle yields.
Interest rates and leverage
Waste services are capital intensive, so borrowing costs drive returns; with US policy rates near 5.25–5.50% in 2024–25, higher rates raise fleet, landfill cell and facility financing costs materially. Elevated rates increase refinancing risk and constrain MFLs debt capacity, limiting M&A-fueled growth—GFL reported leverage around mid-4x net debt/EBITDA in recent filings, heightening sensitivity. Strong cash generation and staggered maturities through 2024–25 improve resilience.
Fuel and energy costs
Diesel averaged about $3.90/gal in 2024–H1 2025, and CNG pricing volatility directly compresses route economics and margins for GFL; fuel typically represents a material portion of collection OPEX. Fuel surcharges and route-optimization tools have historically enabled pass-throughs that protect per-route margins. GFL’s growing RNG projects can hedge fuel exposure over time by replacing diesel in collection fleets, while rising electricity and natural gas prices increase costs for transfer stations and treatment processes.
Labor availability and wage inflation
Tight driver and technician markets persist in North America, with the American Trucking Associations estimating a driver shortfall near 80,000 in 2023, pressuring wages and turnover for GFL operations. Investment in training, safety, and retention programs sustains service quality and lowers overtime costs, while automation (route optimization, automated collection) eases labor constraints but increases demand for skilled maintenance technicians. Union dynamics, notably negotiations involving the Teamsters, can introduce wage and benefit volatility that affects cost stability.
- Labor shortage: ATA ~80,000 drivers (2023)
- Retention focus: training and safety reduce overtime
- Automation: lowers headcount but raises skilled-maintenance needs
- Union risk: collective bargaining affects wage predictability
Macro growth and construction cycles
Residential and commercial construction activity directly drives municipal waste volumes and container demand, while infrastructure and industrial cycles govern soil remediation and liquid waste services; downturns compress discretionary volumes but essential collection and environmental services provide downside protection. Diversification across regions and customer segments moderates cyclicality and stabilizes cash flows for GFL.
- Residential/commercial → container & MSW demand
- Infrastructure/industrial → soil remediation, liquid waste
- Downturns hit discretionary volumes; essentials defend revenue
- Regional and service diversification reduces volatility
Municipal contracts and tightening regulations drive pricing risk and growth via federal funding
Commodity swings: OCC ~$60–80/ton (2024), ferrous scrap +15% y/y (2024), PCR PE ~$1,100–1,400/ton (2024). Rates and leverage: US policy 5.25–5.50% (2024–25); GFL leverage ~4x net debt/EBITDA. Fuel and labor: diesel ~$3.90/gal (2024–H1 2025); driver shortfall ~80,000 (2023) pressuring wages and margins.
| Metric | 2024–25 |
|---|---|
| OCC | $60–80/ton |
| PCR PE | $1,100–1,400/ton |
| Policy rate | 5.25–5.50% |
| Net debt/EBITDA | ~4x |
| Diesel | $3.90/gal |
| Driver gap | ~80,000 |
Same Document Delivered
GFL Environmental PESTLE Analysis
This GFL Environmental PESTLE Analysis preview is the exact document you’ll receive after purchase—fully formatted and ready to use. The layout, content, and structure visible here are precisely what you’ll download immediately after buying. No placeholders, no teasers—this is the real, final file.











