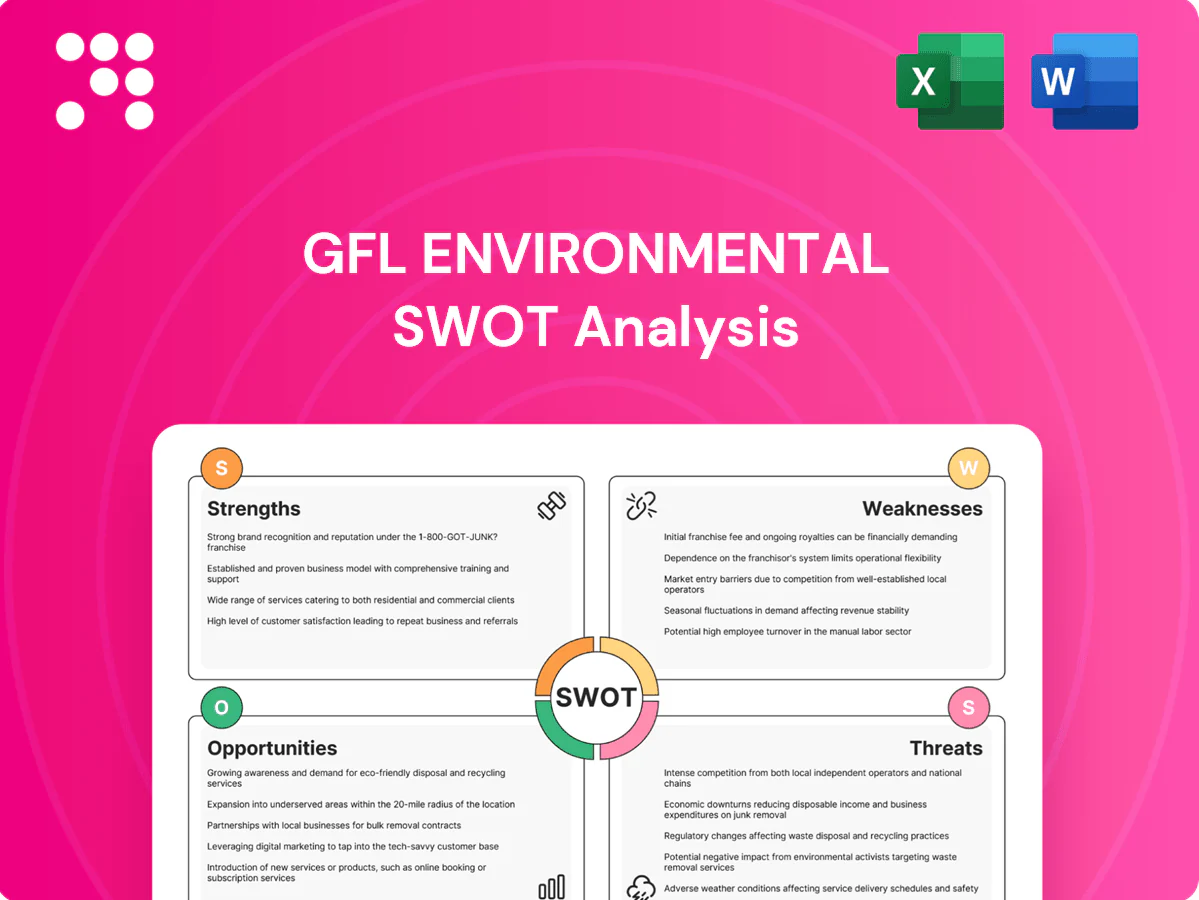
GFL Environmental SWOT Analysis

Make Insightful Decisions Backed by Expert Research
GFL Environmental's SWOT highlights robust waste-management scale and regulatory exposure, plus growth via M&A and sustainability tailwinds. Our full SWOT uncovers financial impacts, competitive dynamics, and execution risks with actionable recommendations. Purchase the complete, editable report (Word + Excel) to support investment theses, strategic planning, or stakeholder presentations.
Strengths

Diversified service portfolio
GFLs diversified offering across solid waste, liquid waste and soil remediation smooths revenue across cycles and end-markets, enabling customers to bundle services, cut churn and raise wallet share; this three-pronged model spreads regulatory and operational risk across segments and positions GFL as a one-stop environmental services provider.
Broad North American footprint
GFL’s operations across Canada and the U.S. deliver route density and scale efficiencies that lower per-stop costs and improve asset utilization. Serving over 5 million customers and completing 150+ tuck-in acquisitions since 2015 supports rapid network optimization and integration. The company’s cross-border footprint enhances bid competitiveness for municipal contracts and diversifies economic exposure.

Sticky municipal and contractual revenues
Long-term municipal and commercial agreements generate predictable recurring cash flows for GFL, supporting roughly CAD 6.5 billion revenue in FY2024 and stable free cash flow. CPI-linked escalators in many contracts help protect margins against inflationary pressure. High contract visibility aids capex planning and balance-sheet management, and renewal rates benefit from GFLs broad service offering and reliability.

Operational scale and vertical integration
Ownership and access to transfer, recycling and disposal assets give GFL direct control of the waste stream, minimizing reliance on third parties and reducing per-ton handling costs. Its integrated platform compresses collection and processing unit costs while verticality cuts external tipping and hauling fees, supporting stronger gross margins. This footprint also strengthens pricing power in key regional markets.
- Control of assets: reduces third-party dependencies
- Scale: lowers unit collection/processing costs
- Verticality: cuts fees, boosts margins
- Market power: improved pricing leverage
Sustainability and technology focus
GFL’s sustained investments in recycling, organics diversion and treatment technologies align with rising ESG demand and corporate procurement standards, while telematics and data-driven route optimization reduce fuel use and tailpipe emissions and improve margins. These sustainability credentials strengthen RFP wins and large corporate accounts, and ongoing innovation differentiates GFL from regional competitors.
- recycling & organics investment: ESG-aligned
- data-driven routing: lower fuel use & emissions
- sustainability aids RFPs & corporate wins
- innovation = competitive differentiation
Diversified waste platform, bundled services and stable cash flow—CAD 6.5B
GFL’s diversified mix—solid waste, liquid waste, soil remediation—smooths revenue and enables bundled sales, reducing churn and regulatory exposure.
Scale across Canada and the U.S. delivers route density and cost advantages; serves over 5 million customers and completed 150+ tuck-ins since 2015.
Long-term municipal/commercial contracts and CPI escalators supported ~CAD 6.5 billion revenue in FY2024 and predictable cash flows.
| Metric | Value |
|---|---|
| FY2024 revenue | CAD 6.5B |
| Customers | 5M+ |
| Acquisitions since 2015 | 150+ |
What is included in the product
 Detailed Word Document
Delivers a strategic overview of GFL Environmental’s internal and external business factors, outlining strengths, weaknesses, opportunities, and threats to map its competitive position, growth drivers, operational gaps, and market risks.

 Customizable Excel Spreadsheet
Provides a concise, editable SWOT matrix for GFL Environmental to rapidly align strategy, update assumptions, and present clear insights to stakeholders.
Weaknesses

High leverage from acquisitive growth
Debt-funded roll-ups have left GFL with leverage levels above 4x net debt/adjusted EBITDA in recent filings, constraining financial flexibility. Higher interest costs in 2024 pressured free cash flow amid a rate-tightening backdrop. Credit covenants can restrict strategic moves during downturns, and the sizable debt amplifies integration and execution risk across acquisitions.
Integration complexity and systems harmonization
Frequent M&A at GFL, which operates across Canada and the U.S., raises cultural and operational integration challenges that management cites in its public filings. Disparate IT systems and processes risk impairing service quality and realizing planned synergies. Integration delays can erode projected cost savings and ROI, and transitions increase customer disruption risk without rapid harmonization.

Exposure to recycling commodity volatility
Fluctuating OCC, metals and plastics prices—OCC swings of over $200/ton since 2021, PET resin down ~20% in 2024 and scrap metal prices down ~15%—have compressed GFL recycling margins. Contamination and shifting end‑market demand add unpredictable revenue swings and lower bale values. Many supply contracts lack full pass‑through mechanisms, exposing GFL to price moves. Volatility complicates capital allocation to MRFs, which typically require $10–50M each in capex.

Capital-intensive asset base
GFLs capital-intensive asset base—collection fleets, containers, facilities and landfill assets—requires ongoing capex running into hundreds of millions of CAD annually, compressing free cash flow through maintenance and replacement cycles. Scaling into new markets needs significant upfront investment before route density and margin benefits materialize, elevating hurdle rates for accretive growth and increasing sensitivity to interest rates and fuel costs.
- Ongoing capex: hundreds of millions CAD/year
- Fleet & asset replacement compresses FCF
- Market entry requires upfront capital
- Higher hurdle rates for growth
Regulatory and environmental liabilities
Compliance across Canada and the US increases operational complexity and cost; legacy site remediation and historic spills have in the past resulted in regulatory fines and litigation that can be material to earnings. Permitting delays frequently stall expansions and capital projects, while insurance often excludes certain pollution or long-tail liabilities.
- Multi-jurisdiction compliance: higher OPEX
- Legacy remediation: potential fines/litigation
- Permitting delays: project risk
- Insurance gaps: uncovered exposures
High leverage, rising interest and commodity swings squeeze FCF; capex and permitting risk rise
High leverage (net debt/adjusted EBITDA >4x) and rising 2024 interest costs have constrained FCF and strategic flexibility. Commodity volatility (OCC swings >$200/ton since 2021; PET -20% in 2024; scrap -15%) compresses recycling margins. Heavy annual capex (hundreds of M CAD) and multi‑jurisdictional permitting/remediation risks raise execution and legal exposure.
| Metric | 2024/Trend |
|---|---|
| Leverage | >4x |
| Interest costs | Up in 2024 |
| Commodities | OCC >$200/ton; PET -20%; scrap -15% |
| Capex | Hundreds of M CAD/year |
What You See Is What You Get
GFL Environmental SWOT Analysis
This is the actual SWOT analysis document you’ll receive upon purchase—no surprises, just professional quality. The preview below is taken directly from the full GFL Environmental report you'll get. Purchase unlocks the complete, editable file ready for use.

Make Insightful Decisions Backed by Expert Research
GFL Environmental's SWOT highlights robust waste-management scale and regulatory exposure, plus growth via M&A and sustainability tailwinds. Our full SWOT uncovers financial impacts, competitive dynamics, and execution risks with actionable recommendations. Purchase the complete, editable report (Word + Excel) to support investment theses, strategic planning, or stakeholder presentations.
Strengths
Diversified service portfolio
GFLs diversified offering across solid waste, liquid waste and soil remediation smooths revenue across cycles and end-markets, enabling customers to bundle services, cut churn and raise wallet share; this three-pronged model spreads regulatory and operational risk across segments and positions GFL as a one-stop environmental services provider.
Broad North American footprint
GFL’s operations across Canada and the U.S. deliver route density and scale efficiencies that lower per-stop costs and improve asset utilization. Serving over 5 million customers and completing 150+ tuck-in acquisitions since 2015 supports rapid network optimization and integration. The company’s cross-border footprint enhances bid competitiveness for municipal contracts and diversifies economic exposure.
Sticky municipal and contractual revenues
Long-term municipal and commercial agreements generate predictable recurring cash flows for GFL, supporting roughly CAD 6.5 billion revenue in FY2024 and stable free cash flow. CPI-linked escalators in many contracts help protect margins against inflationary pressure. High contract visibility aids capex planning and balance-sheet management, and renewal rates benefit from GFLs broad service offering and reliability.
Operational scale and vertical integration
Ownership and access to transfer, recycling and disposal assets give GFL direct control of the waste stream, minimizing reliance on third parties and reducing per-ton handling costs. Its integrated platform compresses collection and processing unit costs while verticality cuts external tipping and hauling fees, supporting stronger gross margins. This footprint also strengthens pricing power in key regional markets.
- Control of assets: reduces third-party dependencies
- Scale: lowers unit collection/processing costs
- Verticality: cuts fees, boosts margins
- Market power: improved pricing leverage
Sustainability and technology focus
GFL’s sustained investments in recycling, organics diversion and treatment technologies align with rising ESG demand and corporate procurement standards, while telematics and data-driven route optimization reduce fuel use and tailpipe emissions and improve margins. These sustainability credentials strengthen RFP wins and large corporate accounts, and ongoing innovation differentiates GFL from regional competitors.
- recycling & organics investment: ESG-aligned
- data-driven routing: lower fuel use & emissions
- sustainability aids RFPs & corporate wins
- innovation = competitive differentiation
Diversified waste platform, bundled services and stable cash flow—CAD 6.5B
GFL’s diversified mix—solid waste, liquid waste, soil remediation—smooths revenue and enables bundled sales, reducing churn and regulatory exposure.
Scale across Canada and the U.S. delivers route density and cost advantages; serves over 5 million customers and completed 150+ tuck-ins since 2015.
Long-term municipal/commercial contracts and CPI escalators supported ~CAD 6.5 billion revenue in FY2024 and predictable cash flows.
| Metric | Value |
|---|---|
| FY2024 revenue | CAD 6.5B |
| Customers | 5M+ |
| Acquisitions since 2015 | 150+ |
What is included in the product
Detailed Word Document
Delivers a strategic overview of GFL Environmental’s internal and external business factors, outlining strengths, weaknesses, opportunities, and threats to map its competitive position, growth drivers, operational gaps, and market risks.
Customizable Excel Spreadsheet
Provides a concise, editable SWOT matrix for GFL Environmental to rapidly align strategy, update assumptions, and present clear insights to stakeholders.
Weaknesses
High leverage from acquisitive growth
Debt-funded roll-ups have left GFL with leverage levels above 4x net debt/adjusted EBITDA in recent filings, constraining financial flexibility. Higher interest costs in 2024 pressured free cash flow amid a rate-tightening backdrop. Credit covenants can restrict strategic moves during downturns, and the sizable debt amplifies integration and execution risk across acquisitions.
Integration complexity and systems harmonization
Frequent M&A at GFL, which operates across Canada and the U.S., raises cultural and operational integration challenges that management cites in its public filings. Disparate IT systems and processes risk impairing service quality and realizing planned synergies. Integration delays can erode projected cost savings and ROI, and transitions increase customer disruption risk without rapid harmonization.
Exposure to recycling commodity volatility
Fluctuating OCC, metals and plastics prices—OCC swings of over $200/ton since 2021, PET resin down ~20% in 2024 and scrap metal prices down ~15%—have compressed GFL recycling margins. Contamination and shifting end‑market demand add unpredictable revenue swings and lower bale values. Many supply contracts lack full pass‑through mechanisms, exposing GFL to price moves. Volatility complicates capital allocation to MRFs, which typically require $10–50M each in capex.
Capital-intensive asset base
GFLs capital-intensive asset base—collection fleets, containers, facilities and landfill assets—requires ongoing capex running into hundreds of millions of CAD annually, compressing free cash flow through maintenance and replacement cycles. Scaling into new markets needs significant upfront investment before route density and margin benefits materialize, elevating hurdle rates for accretive growth and increasing sensitivity to interest rates and fuel costs.
- Ongoing capex: hundreds of millions CAD/year
- Fleet & asset replacement compresses FCF
- Market entry requires upfront capital
- Higher hurdle rates for growth
Regulatory and environmental liabilities
Compliance across Canada and the US increases operational complexity and cost; legacy site remediation and historic spills have in the past resulted in regulatory fines and litigation that can be material to earnings. Permitting delays frequently stall expansions and capital projects, while insurance often excludes certain pollution or long-tail liabilities.
- Multi-jurisdiction compliance: higher OPEX
- Legacy remediation: potential fines/litigation
- Permitting delays: project risk
- Insurance gaps: uncovered exposures
High leverage, rising interest and commodity swings squeeze FCF; capex and permitting risk rise
High leverage (net debt/adjusted EBITDA >4x) and rising 2024 interest costs have constrained FCF and strategic flexibility. Commodity volatility (OCC swings >$200/ton since 2021; PET -20% in 2024; scrap -15%) compresses recycling margins. Heavy annual capex (hundreds of M CAD) and multi‑jurisdictional permitting/remediation risks raise execution and legal exposure.
| Metric | 2024/Trend |
|---|---|
| Leverage | >4x |
| Interest costs | Up in 2024 |
| Commodities | OCC >$200/ton; PET -20%; scrap -15% |
| Capex | Hundreds of M CAD/year |
What You See Is What You Get
GFL Environmental SWOT Analysis
This is the actual SWOT analysis document you’ll receive upon purchase—no surprises, just professional quality. The preview below is taken directly from the full GFL Environmental report you'll get. Purchase unlocks the complete, editable file ready for use.
Description
Make Insightful Decisions Backed by Expert Research
GFL Environmental's SWOT highlights robust waste-management scale and regulatory exposure, plus growth via M&A and sustainability tailwinds. Our full SWOT uncovers financial impacts, competitive dynamics, and execution risks with actionable recommendations. Purchase the complete, editable report (Word + Excel) to support investment theses, strategic planning, or stakeholder presentations.
Strengths
Diversified service portfolio
GFLs diversified offering across solid waste, liquid waste and soil remediation smooths revenue across cycles and end-markets, enabling customers to bundle services, cut churn and raise wallet share; this three-pronged model spreads regulatory and operational risk across segments and positions GFL as a one-stop environmental services provider.
Broad North American footprint
GFL’s operations across Canada and the U.S. deliver route density and scale efficiencies that lower per-stop costs and improve asset utilization. Serving over 5 million customers and completing 150+ tuck-in acquisitions since 2015 supports rapid network optimization and integration. The company’s cross-border footprint enhances bid competitiveness for municipal contracts and diversifies economic exposure.
Sticky municipal and contractual revenues
Long-term municipal and commercial agreements generate predictable recurring cash flows for GFL, supporting roughly CAD 6.5 billion revenue in FY2024 and stable free cash flow. CPI-linked escalators in many contracts help protect margins against inflationary pressure. High contract visibility aids capex planning and balance-sheet management, and renewal rates benefit from GFLs broad service offering and reliability.
Operational scale and vertical integration
Ownership and access to transfer, recycling and disposal assets give GFL direct control of the waste stream, minimizing reliance on third parties and reducing per-ton handling costs. Its integrated platform compresses collection and processing unit costs while verticality cuts external tipping and hauling fees, supporting stronger gross margins. This footprint also strengthens pricing power in key regional markets.
- Control of assets: reduces third-party dependencies
- Scale: lowers unit collection/processing costs
- Verticality: cuts fees, boosts margins
- Market power: improved pricing leverage
Sustainability and technology focus
GFL’s sustained investments in recycling, organics diversion and treatment technologies align with rising ESG demand and corporate procurement standards, while telematics and data-driven route optimization reduce fuel use and tailpipe emissions and improve margins. These sustainability credentials strengthen RFP wins and large corporate accounts, and ongoing innovation differentiates GFL from regional competitors.
- recycling & organics investment: ESG-aligned
- data-driven routing: lower fuel use & emissions
- sustainability aids RFPs & corporate wins
- innovation = competitive differentiation
Diversified waste platform, bundled services and stable cash flow—CAD 6.5B
GFL’s diversified mix—solid waste, liquid waste, soil remediation—smooths revenue and enables bundled sales, reducing churn and regulatory exposure.
Scale across Canada and the U.S. delivers route density and cost advantages; serves over 5 million customers and completed 150+ tuck-ins since 2015.
Long-term municipal/commercial contracts and CPI escalators supported ~CAD 6.5 billion revenue in FY2024 and predictable cash flows.
| Metric | Value |
|---|---|
| FY2024 revenue | CAD 6.5B |
| Customers | 5M+ |
| Acquisitions since 2015 | 150+ |
What is included in the product
Detailed Word Document
Delivers a strategic overview of GFL Environmental’s internal and external business factors, outlining strengths, weaknesses, opportunities, and threats to map its competitive position, growth drivers, operational gaps, and market risks.
Customizable Excel Spreadsheet
Provides a concise, editable SWOT matrix for GFL Environmental to rapidly align strategy, update assumptions, and present clear insights to stakeholders.
Weaknesses
High leverage from acquisitive growth
Debt-funded roll-ups have left GFL with leverage levels above 4x net debt/adjusted EBITDA in recent filings, constraining financial flexibility. Higher interest costs in 2024 pressured free cash flow amid a rate-tightening backdrop. Credit covenants can restrict strategic moves during downturns, and the sizable debt amplifies integration and execution risk across acquisitions.
Integration complexity and systems harmonization
Frequent M&A at GFL, which operates across Canada and the U.S., raises cultural and operational integration challenges that management cites in its public filings. Disparate IT systems and processes risk impairing service quality and realizing planned synergies. Integration delays can erode projected cost savings and ROI, and transitions increase customer disruption risk without rapid harmonization.
Exposure to recycling commodity volatility
Fluctuating OCC, metals and plastics prices—OCC swings of over $200/ton since 2021, PET resin down ~20% in 2024 and scrap metal prices down ~15%—have compressed GFL recycling margins. Contamination and shifting end‑market demand add unpredictable revenue swings and lower bale values. Many supply contracts lack full pass‑through mechanisms, exposing GFL to price moves. Volatility complicates capital allocation to MRFs, which typically require $10–50M each in capex.
Capital-intensive asset base
GFLs capital-intensive asset base—collection fleets, containers, facilities and landfill assets—requires ongoing capex running into hundreds of millions of CAD annually, compressing free cash flow through maintenance and replacement cycles. Scaling into new markets needs significant upfront investment before route density and margin benefits materialize, elevating hurdle rates for accretive growth and increasing sensitivity to interest rates and fuel costs.
- Ongoing capex: hundreds of millions CAD/year
- Fleet & asset replacement compresses FCF
- Market entry requires upfront capital
- Higher hurdle rates for growth
Regulatory and environmental liabilities
Compliance across Canada and the US increases operational complexity and cost; legacy site remediation and historic spills have in the past resulted in regulatory fines and litigation that can be material to earnings. Permitting delays frequently stall expansions and capital projects, while insurance often excludes certain pollution or long-tail liabilities.
- Multi-jurisdiction compliance: higher OPEX
- Legacy remediation: potential fines/litigation
- Permitting delays: project risk
- Insurance gaps: uncovered exposures
High leverage, rising interest and commodity swings squeeze FCF; capex and permitting risk rise
High leverage (net debt/adjusted EBITDA >4x) and rising 2024 interest costs have constrained FCF and strategic flexibility. Commodity volatility (OCC swings >$200/ton since 2021; PET -20% in 2024; scrap -15%) compresses recycling margins. Heavy annual capex (hundreds of M CAD) and multi‑jurisdictional permitting/remediation risks raise execution and legal exposure.
| Metric | 2024/Trend |
|---|---|
| Leverage | >4x |
| Interest costs | Up in 2024 |
| Commodities | OCC >$200/ton; PET -20%; scrap -15% |
| Capex | Hundreds of M CAD/year |
What You See Is What You Get
GFL Environmental SWOT Analysis
This is the actual SWOT analysis document you’ll receive upon purchase—no surprises, just professional quality. The preview below is taken directly from the full GFL Environmental report you'll get. Purchase unlocks the complete, editable file ready for use.











