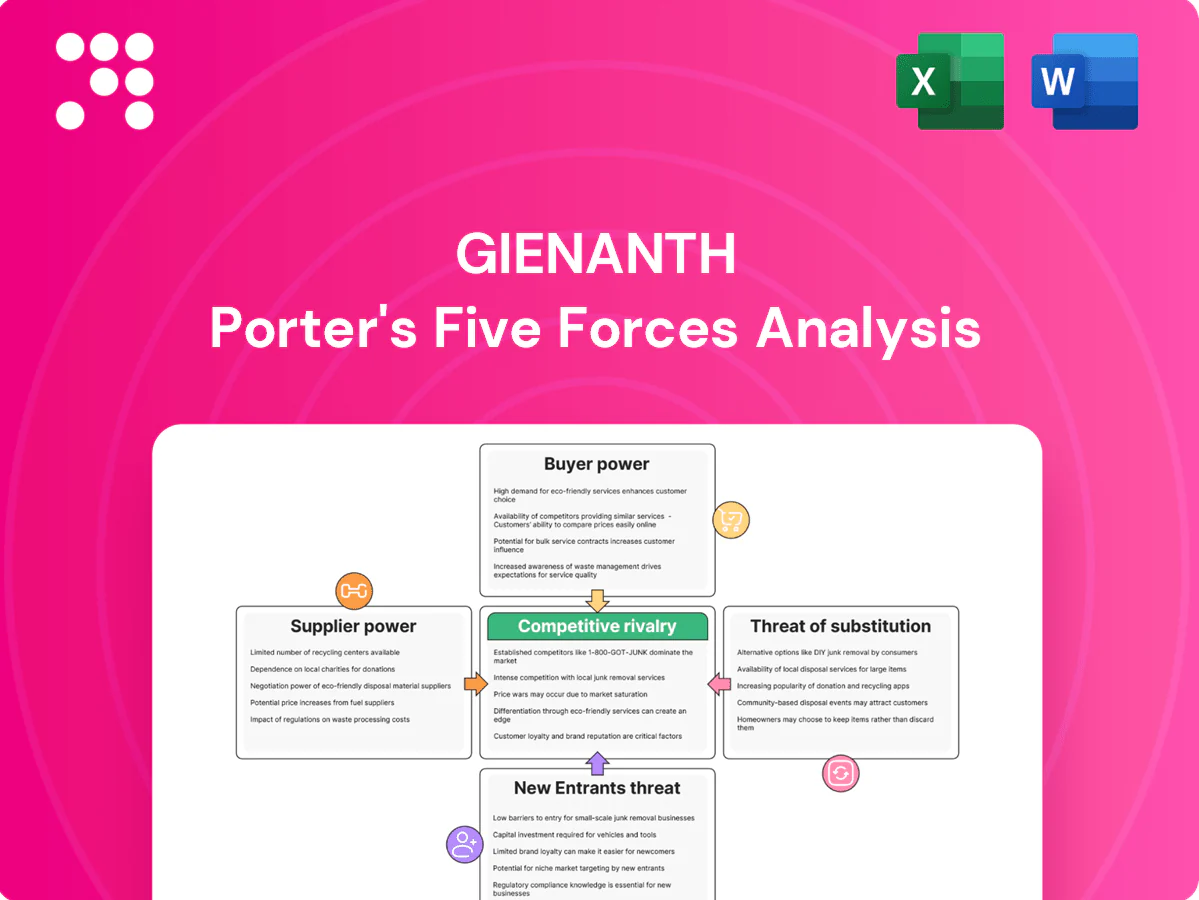
Gienanth Porter's Five Forces Analysis

Go Beyond the Preview—Access the Full Strategic Report
Gienanth faces moderate buyer power, concentrated suppliers for specialized castings, and steady rivalry from global foundries, while barriers to entry and substitutes remain manageable; these forces shape pricing, margins, and strategic moves. This brief snapshot only scratches the surface. Unlock the full Porter's Five Forces Analysis to explore Gienanth’s competitive dynamics and market pressures in detail.
Suppliers Bargaining Power

Energy and utilities concentration
Foundries are highly energy-intensive, with electricity and natural gas often accounting for roughly 10–25% of operating costs and supplied by a handful of regional providers, concentrating supplier power. European wholesale gas and power volatility in 2022–24 (TTF and NPS swings) shifted cost leverage to suppliers during tight markets. Long-term hedging reduces but does not remove exposure. Decarbonization-driven capacity constraints and grid rationing can further raise supplier leverage.
Raw metals and alloys sourcing
Gienanth relies on pig iron, steel scrap and alloying elements from global commodity markets and traders; world crude steel output in 2024 was about 1.8–1.9 billion tonnes, keeping raw-material markets tight. When low‑impurity grades are needed supplier options narrow and bargaining power rises, while 2024 price cycles and logistics bottlenecks compressed margins; multi‑sourcing and recycled inputs (40–60% mix for many foundries) moderate risk.

Molds, cores, and consumables
Core sand, resins, refractories and binders come from specialized chemical suppliers with differentiated formulations; qualification typically takes 6–12 months, raising switching costs and supplier influence. Just-in-time practices magnify disruption risk and can turn single-shift shortages into multi-week delays. Strategic inventories (commonly 2–4 weeks) and dual-approval supplier lists materially rebalance bargaining power.

Tooling and pattern makers
Complex castings require precision tooling from skilled pattern and die makers, a concentrated craft base where custom tooling lead times average 8–12 weeks and tool costs often range €20k–€150k per cavity in 2024; this specialization raises supplier leverage. During 2023–24 capacity crunches suppliers captured 10–25% premium on rush orders. Collaborative design and multi-year agreements secure priority and better pricing.
- Concentration: few specialized shops
- Lead time: 8–12 weeks
- Premiums: 10–25% in capacity crunches
- Mitigation: collaborative design, long-term contracts
ESG and compliance constraints
Environmental standards and traceability raise reliance on audited, compliant suppliers, tightening supplier leverage as fewer sources meet requirements; the EU Carbon Border Adjustment Mechanism entered transitional reporting in October 2023 with full application phased to 2026, affecting sectors like cement, iron and steel, aluminium, fertilisers and electricity.
Certifications and CBAM-like regimes enable cost pass-through to buyers, while targeted supplier development programs can enlarge the qualified supplier pool and mitigate dependency.
- TRACEABILITY: audited chains required for CBAM sectors (cement, steel, aluminium, fertilisers, electricity)
- REGULATION: CBAM transitional reporting started Oct 2023; full scope phased to 2026
- RISK: fewer compliant sources increase supplier bargaining power
- MITIGATION: supplier development programs expand qualified suppliers and reduce dependency
Rising supplier power: energy 10–25%, steel ~1.85bn t
Suppliers hold moderately high power: energy (10–25% of costs) and pig iron/steel tightness (global crude steel 2024 ~1.85bn t) concentrate leverage. Specialized binders and tooling (8–12w lead; €20k–€150k/cavity) plus CBAM compliance (phased to 2026) raise switching costs. Mitigants: multi‑sourcing, 2–4w inventories, long‑term contracts and supplier development.
| Item | Metric | 2024 | Impact |
|---|---|---|---|
| Energy | Share of costs | 10–25% | High |
| Crude steel | Output | ~1.85bn t | Tight |
| Tooling | Lead / Cost | 8–12w / €20k–€150k | High |
What is included in the product
 Detailed Word Document
Tailored Porter’s Five Forces for Gienanth, assessing competitive rivalry, supplier and buyer power, threat of entrants and substitutes, and strategic barriers protecting its market position.

 Customizable Excel Spreadsheet
A concise one-sheet Gienanth Porter’s Five Forces tool that visualizes competitive pressure with a spider chart, lets you customize force levels, swap in your data, and drop a clean slide-ready summary into decks—no code required.
Customers Bargaining Power

Concentrated automotive OEMs
Automotive customers are few, large and price-sensitive; the top 10 OEMs accounted for about 65% of global light-vehicle production in 2024, giving them heavy leverage to demand annual cost-downs typically of 3–5%. High volumes and dual-sourcing norms cap suppliers pricing power while OEMs impose strict quality, PPAP compliance and often >95% on-time delivery targets to retain contracts.
High switching costs via tooling
As of 2024 custom patterns, tooling and process know-how create switching costs that are costly and slow, with tooling investments often running into hundreds of thousands of euros and ramp-up measured in months. Once programs are launched this softens buyer leverage, though purchasers routinely use competitive quotes at renewal to press pricing. Long program lives, frequently exceeding seven years, raise the value of lifecycle cost management.

Engineering collaboration as lock-in
Engineering co-development from design to finished component embeds Gienanth in customer workflows; in 2024 early-stage involvement increased approval dependencies and tailored process steps, raising switching barriers. For complex parts this shifts bargaining power toward Gienanth as customers face requalification costs and supply continuity risks. Clear value-capture mechanisms are needed to monetize engineering input and convert technical lock-in into sustainable margins.

Demand cyclicality and scheduling
Quality and on-time delivery mandates
Nonconformance penalties and strict OTIF metrics (commonly 95–99% in 2024) significantly increase buyer leverage, with OEMs enforcing deductions and delisting risks. Approved vendor lists and supplier audits limit suppliers' ability to raise prices. Demonstrated zero-defect performance (often <50 PPM) can justify premium pricing, while digital traceability on critical parts strengthens negotiating leverage.
- OTIF targets 95–99% (2024)
- Zero-defect benchmark <50 PPM
- Audits/AVL restrict price hikes
- Traceability improves negotiating position
Concentrated OEMs force 3–5% annual cost-downs, €100k+ tooling and near-zero defects
Customers are few, large and price-sensitive (top 10 OEMs ≈65% global light-vehicle production in 2024), forcing annual cost-downs of 3–5% and heavy leverage on suppliers. High switching costs (tooling often €100k+) and >7-year program lives soften buyer power but OEMs enforce OTIF 95–99% and <50 PPM, using audits and AVL to constrain price increases.
| Metric (2024) | Value |
|---|---|
| Top‑10 OEM share | ≈65% |
| Annual cost‑down | 3–5% |
| OTIF | 95–99% |
| Zero‑defect | <50 PPM |
| Tooling cost | €100k+ |
Preview Before You Purchase
Gienanth Porter's Five Forces Analysis
This preview shows the exact Gienanth Porter’s Five Forces Analysis you’ll receive after purchase—no samples or placeholders. It’s the fully formatted, professionally written document ready for immediate download and use. What you see here is the complete deliverable available instantly upon payment.

Go Beyond the Preview—Access the Full Strategic Report
Gienanth faces moderate buyer power, concentrated suppliers for specialized castings, and steady rivalry from global foundries, while barriers to entry and substitutes remain manageable; these forces shape pricing, margins, and strategic moves. This brief snapshot only scratches the surface. Unlock the full Porter's Five Forces Analysis to explore Gienanth’s competitive dynamics and market pressures in detail.
Suppliers Bargaining Power
Energy and utilities concentration
Foundries are highly energy-intensive, with electricity and natural gas often accounting for roughly 10–25% of operating costs and supplied by a handful of regional providers, concentrating supplier power. European wholesale gas and power volatility in 2022–24 (TTF and NPS swings) shifted cost leverage to suppliers during tight markets. Long-term hedging reduces but does not remove exposure. Decarbonization-driven capacity constraints and grid rationing can further raise supplier leverage.
Raw metals and alloys sourcing
Gienanth relies on pig iron, steel scrap and alloying elements from global commodity markets and traders; world crude steel output in 2024 was about 1.8–1.9 billion tonnes, keeping raw-material markets tight. When low‑impurity grades are needed supplier options narrow and bargaining power rises, while 2024 price cycles and logistics bottlenecks compressed margins; multi‑sourcing and recycled inputs (40–60% mix for many foundries) moderate risk.
Molds, cores, and consumables
Core sand, resins, refractories and binders come from specialized chemical suppliers with differentiated formulations; qualification typically takes 6–12 months, raising switching costs and supplier influence. Just-in-time practices magnify disruption risk and can turn single-shift shortages into multi-week delays. Strategic inventories (commonly 2–4 weeks) and dual-approval supplier lists materially rebalance bargaining power.
Tooling and pattern makers
Complex castings require precision tooling from skilled pattern and die makers, a concentrated craft base where custom tooling lead times average 8–12 weeks and tool costs often range €20k–€150k per cavity in 2024; this specialization raises supplier leverage. During 2023–24 capacity crunches suppliers captured 10–25% premium on rush orders. Collaborative design and multi-year agreements secure priority and better pricing.
- Concentration: few specialized shops
- Lead time: 8–12 weeks
- Premiums: 10–25% in capacity crunches
- Mitigation: collaborative design, long-term contracts
ESG and compliance constraints
Environmental standards and traceability raise reliance on audited, compliant suppliers, tightening supplier leverage as fewer sources meet requirements; the EU Carbon Border Adjustment Mechanism entered transitional reporting in October 2023 with full application phased to 2026, affecting sectors like cement, iron and steel, aluminium, fertilisers and electricity.
Certifications and CBAM-like regimes enable cost pass-through to buyers, while targeted supplier development programs can enlarge the qualified supplier pool and mitigate dependency.
- TRACEABILITY: audited chains required for CBAM sectors (cement, steel, aluminium, fertilisers, electricity)
- REGULATION: CBAM transitional reporting started Oct 2023; full scope phased to 2026
- RISK: fewer compliant sources increase supplier bargaining power
- MITIGATION: supplier development programs expand qualified suppliers and reduce dependency
Rising supplier power: energy 10–25%, steel ~1.85bn t
Suppliers hold moderately high power: energy (10–25% of costs) and pig iron/steel tightness (global crude steel 2024 ~1.85bn t) concentrate leverage. Specialized binders and tooling (8–12w lead; €20k–€150k/cavity) plus CBAM compliance (phased to 2026) raise switching costs. Mitigants: multi‑sourcing, 2–4w inventories, long‑term contracts and supplier development.
| Item | Metric | 2024 | Impact |
|---|---|---|---|
| Energy | Share of costs | 10–25% | High |
| Crude steel | Output | ~1.85bn t | Tight |
| Tooling | Lead / Cost | 8–12w / €20k–€150k | High |
What is included in the product
Detailed Word Document
Tailored Porter’s Five Forces for Gienanth, assessing competitive rivalry, supplier and buyer power, threat of entrants and substitutes, and strategic barriers protecting its market position.
Customizable Excel Spreadsheet
A concise one-sheet Gienanth Porter’s Five Forces tool that visualizes competitive pressure with a spider chart, lets you customize force levels, swap in your data, and drop a clean slide-ready summary into decks—no code required.
Customers Bargaining Power
Concentrated automotive OEMs
Automotive customers are few, large and price-sensitive; the top 10 OEMs accounted for about 65% of global light-vehicle production in 2024, giving them heavy leverage to demand annual cost-downs typically of 3–5%. High volumes and dual-sourcing norms cap suppliers pricing power while OEMs impose strict quality, PPAP compliance and often >95% on-time delivery targets to retain contracts.
High switching costs via tooling
As of 2024 custom patterns, tooling and process know-how create switching costs that are costly and slow, with tooling investments often running into hundreds of thousands of euros and ramp-up measured in months. Once programs are launched this softens buyer leverage, though purchasers routinely use competitive quotes at renewal to press pricing. Long program lives, frequently exceeding seven years, raise the value of lifecycle cost management.
Engineering collaboration as lock-in
Engineering co-development from design to finished component embeds Gienanth in customer workflows; in 2024 early-stage involvement increased approval dependencies and tailored process steps, raising switching barriers. For complex parts this shifts bargaining power toward Gienanth as customers face requalification costs and supply continuity risks. Clear value-capture mechanisms are needed to monetize engineering input and convert technical lock-in into sustainable margins.
Demand cyclicality and scheduling
Quality and on-time delivery mandates
Nonconformance penalties and strict OTIF metrics (commonly 95–99% in 2024) significantly increase buyer leverage, with OEMs enforcing deductions and delisting risks. Approved vendor lists and supplier audits limit suppliers' ability to raise prices. Demonstrated zero-defect performance (often <50 PPM) can justify premium pricing, while digital traceability on critical parts strengthens negotiating leverage.
- OTIF targets 95–99% (2024)
- Zero-defect benchmark <50 PPM
- Audits/AVL restrict price hikes
- Traceability improves negotiating position
Concentrated OEMs force 3–5% annual cost-downs, €100k+ tooling and near-zero defects
Customers are few, large and price-sensitive (top 10 OEMs ≈65% global light-vehicle production in 2024), forcing annual cost-downs of 3–5% and heavy leverage on suppliers. High switching costs (tooling often €100k+) and >7-year program lives soften buyer power but OEMs enforce OTIF 95–99% and <50 PPM, using audits and AVL to constrain price increases.
| Metric (2024) | Value |
|---|---|
| Top‑10 OEM share | ≈65% |
| Annual cost‑down | 3–5% |
| OTIF | 95–99% |
| Zero‑defect | <50 PPM |
| Tooling cost | €100k+ |
Preview Before You Purchase
Gienanth Porter's Five Forces Analysis
This preview shows the exact Gienanth Porter’s Five Forces Analysis you’ll receive after purchase—no samples or placeholders. It’s the fully formatted, professionally written document ready for immediate download and use. What you see here is the complete deliverable available instantly upon payment.
Description
Go Beyond the Preview—Access the Full Strategic Report
Gienanth faces moderate buyer power, concentrated suppliers for specialized castings, and steady rivalry from global foundries, while barriers to entry and substitutes remain manageable; these forces shape pricing, margins, and strategic moves. This brief snapshot only scratches the surface. Unlock the full Porter's Five Forces Analysis to explore Gienanth’s competitive dynamics and market pressures in detail.
Suppliers Bargaining Power
Energy and utilities concentration
Foundries are highly energy-intensive, with electricity and natural gas often accounting for roughly 10–25% of operating costs and supplied by a handful of regional providers, concentrating supplier power. European wholesale gas and power volatility in 2022–24 (TTF and NPS swings) shifted cost leverage to suppliers during tight markets. Long-term hedging reduces but does not remove exposure. Decarbonization-driven capacity constraints and grid rationing can further raise supplier leverage.
Raw metals and alloys sourcing
Gienanth relies on pig iron, steel scrap and alloying elements from global commodity markets and traders; world crude steel output in 2024 was about 1.8–1.9 billion tonnes, keeping raw-material markets tight. When low‑impurity grades are needed supplier options narrow and bargaining power rises, while 2024 price cycles and logistics bottlenecks compressed margins; multi‑sourcing and recycled inputs (40–60% mix for many foundries) moderate risk.
Molds, cores, and consumables
Core sand, resins, refractories and binders come from specialized chemical suppliers with differentiated formulations; qualification typically takes 6–12 months, raising switching costs and supplier influence. Just-in-time practices magnify disruption risk and can turn single-shift shortages into multi-week delays. Strategic inventories (commonly 2–4 weeks) and dual-approval supplier lists materially rebalance bargaining power.
Tooling and pattern makers
Complex castings require precision tooling from skilled pattern and die makers, a concentrated craft base where custom tooling lead times average 8–12 weeks and tool costs often range €20k–€150k per cavity in 2024; this specialization raises supplier leverage. During 2023–24 capacity crunches suppliers captured 10–25% premium on rush orders. Collaborative design and multi-year agreements secure priority and better pricing.
- Concentration: few specialized shops
- Lead time: 8–12 weeks
- Premiums: 10–25% in capacity crunches
- Mitigation: collaborative design, long-term contracts
ESG and compliance constraints
Environmental standards and traceability raise reliance on audited, compliant suppliers, tightening supplier leverage as fewer sources meet requirements; the EU Carbon Border Adjustment Mechanism entered transitional reporting in October 2023 with full application phased to 2026, affecting sectors like cement, iron and steel, aluminium, fertilisers and electricity.
Certifications and CBAM-like regimes enable cost pass-through to buyers, while targeted supplier development programs can enlarge the qualified supplier pool and mitigate dependency.
- TRACEABILITY: audited chains required for CBAM sectors (cement, steel, aluminium, fertilisers, electricity)
- REGULATION: CBAM transitional reporting started Oct 2023; full scope phased to 2026
- RISK: fewer compliant sources increase supplier bargaining power
- MITIGATION: supplier development programs expand qualified suppliers and reduce dependency
Rising supplier power: energy 10–25%, steel ~1.85bn t
Suppliers hold moderately high power: energy (10–25% of costs) and pig iron/steel tightness (global crude steel 2024 ~1.85bn t) concentrate leverage. Specialized binders and tooling (8–12w lead; €20k–€150k/cavity) plus CBAM compliance (phased to 2026) raise switching costs. Mitigants: multi‑sourcing, 2–4w inventories, long‑term contracts and supplier development.
| Item | Metric | 2024 | Impact |
|---|---|---|---|
| Energy | Share of costs | 10–25% | High |
| Crude steel | Output | ~1.85bn t | Tight |
| Tooling | Lead / Cost | 8–12w / €20k–€150k | High |
What is included in the product
Detailed Word Document
Tailored Porter’s Five Forces for Gienanth, assessing competitive rivalry, supplier and buyer power, threat of entrants and substitutes, and strategic barriers protecting its market position.
Customizable Excel Spreadsheet
A concise one-sheet Gienanth Porter’s Five Forces tool that visualizes competitive pressure with a spider chart, lets you customize force levels, swap in your data, and drop a clean slide-ready summary into decks—no code required.
Customers Bargaining Power
Concentrated automotive OEMs
Automotive customers are few, large and price-sensitive; the top 10 OEMs accounted for about 65% of global light-vehicle production in 2024, giving them heavy leverage to demand annual cost-downs typically of 3–5%. High volumes and dual-sourcing norms cap suppliers pricing power while OEMs impose strict quality, PPAP compliance and often >95% on-time delivery targets to retain contracts.
High switching costs via tooling
As of 2024 custom patterns, tooling and process know-how create switching costs that are costly and slow, with tooling investments often running into hundreds of thousands of euros and ramp-up measured in months. Once programs are launched this softens buyer leverage, though purchasers routinely use competitive quotes at renewal to press pricing. Long program lives, frequently exceeding seven years, raise the value of lifecycle cost management.
Engineering collaboration as lock-in
Engineering co-development from design to finished component embeds Gienanth in customer workflows; in 2024 early-stage involvement increased approval dependencies and tailored process steps, raising switching barriers. For complex parts this shifts bargaining power toward Gienanth as customers face requalification costs and supply continuity risks. Clear value-capture mechanisms are needed to monetize engineering input and convert technical lock-in into sustainable margins.
Demand cyclicality and scheduling
Quality and on-time delivery mandates
Nonconformance penalties and strict OTIF metrics (commonly 95–99% in 2024) significantly increase buyer leverage, with OEMs enforcing deductions and delisting risks. Approved vendor lists and supplier audits limit suppliers' ability to raise prices. Demonstrated zero-defect performance (often <50 PPM) can justify premium pricing, while digital traceability on critical parts strengthens negotiating leverage.
- OTIF targets 95–99% (2024)
- Zero-defect benchmark <50 PPM
- Audits/AVL restrict price hikes
- Traceability improves negotiating position
Concentrated OEMs force 3–5% annual cost-downs, €100k+ tooling and near-zero defects
Customers are few, large and price-sensitive (top 10 OEMs ≈65% global light-vehicle production in 2024), forcing annual cost-downs of 3–5% and heavy leverage on suppliers. High switching costs (tooling often €100k+) and >7-year program lives soften buyer power but OEMs enforce OTIF 95–99% and <50 PPM, using audits and AVL to constrain price increases.
| Metric (2024) | Value |
|---|---|
| Top‑10 OEM share | ≈65% |
| Annual cost‑down | 3–5% |
| OTIF | 95–99% |
| Zero‑defect | <50 PPM |
| Tooling cost | €100k+ |
Preview Before You Purchase
Gienanth Porter's Five Forces Analysis
This preview shows the exact Gienanth Porter’s Five Forces Analysis you’ll receive after purchase—no samples or placeholders. It’s the fully formatted, professionally written document ready for immediate download and use. What you see here is the complete deliverable available instantly upon payment.











