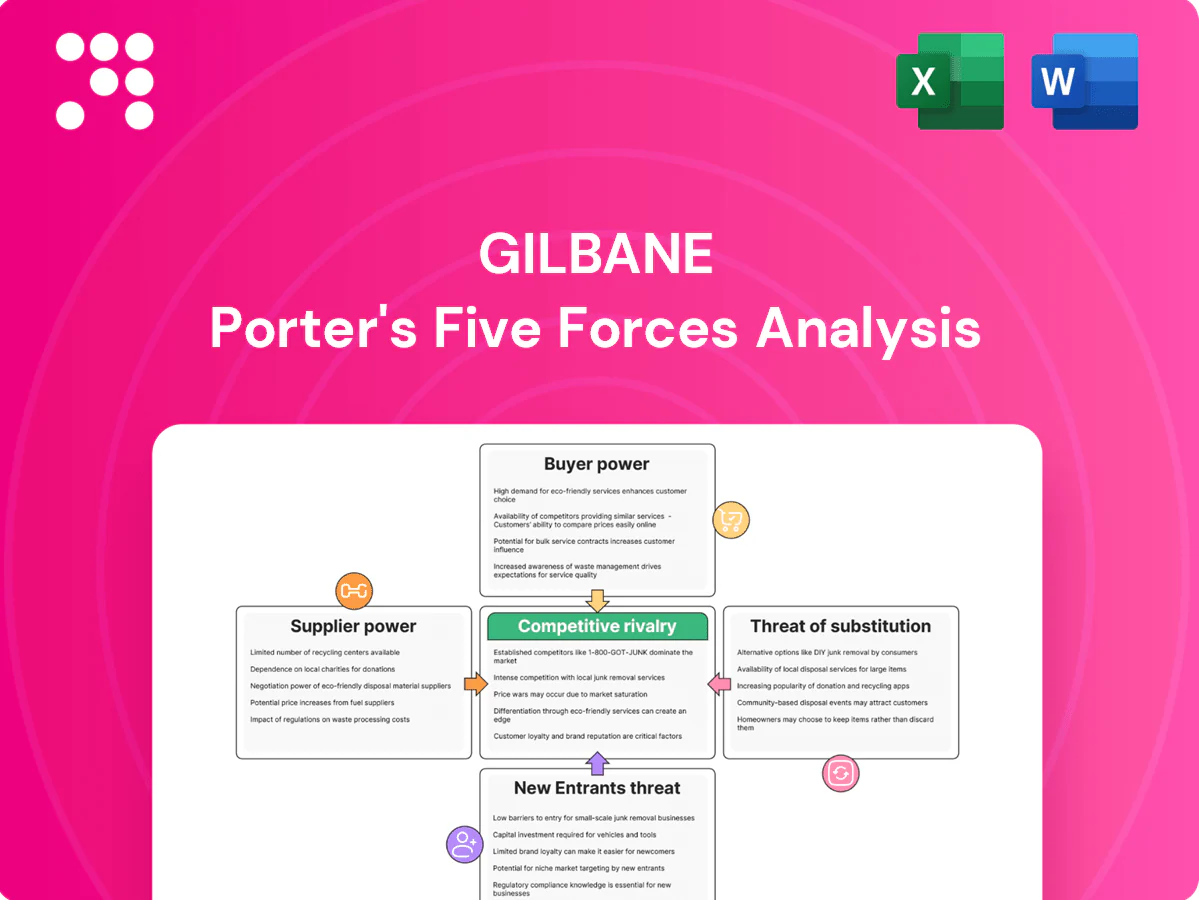
Gilbane Porter's Five Forces Analysis

Don't Miss the Bigger Picture
Gilbane’s Porter's Five Forces snapshot outlines competitive rivalry, buyer and supplier power, threat of new entrants and substitutes, and industry dynamics shaping margins and growth prospects. This concise view highlights key pressures but omits depth on trends, metrics, and strategic implications. Unlock the full Porter's Five Forces Analysis to get force-by-force ratings, visuals, and actionable recommendations for Gilbane.
Suppliers Bargaining Power

Critical materials concentration
Structural steel sourcing is highly concentrated—China produced about 56% of global crude steel in 2023—giving key suppliers leverage over price and lead times for Gilbane; cement and specialized HVAC/electrical components similarly come from a limited pool. Global supply-chain shocks cascade into schedule risk and change-order exposure. Gilbane mitigates via multi-sourcing, early buyout, and hedging; long-term vendor frameworks temper but do not eliminate volatility.
Subcontractor dependency
Trade subcontractors perform the majority of field work, and AGC reported 83% of firms had hiring difficulties in 2023, concentrating supplier power in labor‑tight markets. Top subs are often overbooked and can command 5–10% premium or selectively allocate capacity. Prequalification and preferred networks shrink bidder pools but raise reliability, while incentive pay and 30‑day prompt payments improve retention.

Equipment and rental leverage
Heavy-equipment and crane suppliers can push costs on complex or congested sites; during 2024 peak cycles rental availability tightened and market reports showed rental premiums rising roughly 5–8%. Gilbane mitigates this through fleet planning, staggered schedules and master rental agreements that cut spot-rate exposure. Telematics-driven utilization management has lowered idle time by up to 20%, reducing equipment carrying costs.

Technology stack lock-in
BIM, CDEs and project platforms create high switching frictions and integration costs, with the global BIM market ~9.2 billion USD in 2024 increasing vendor leverage. Proprietary ecosystems can raise fees or limit data portability, amplifying supplier power. Gilbane’s open-standards, API-first tools and joint governance with owners mitigate lock-in and redistribute control.
- Vendor lock-in: increases costs
- Open standards: lower switching risk
- Joint governance: shared control
Union and skilled labor dynamics
Union agreements and Davis-Bacon prevailing wage rules (apply to federal contracts over $2,000) set higher labor rates and restrictive work rules, raising supplier leverage; craft shortages in MEP and specialty trades further push wage inflation and bidding power for skilled subcontractors. Project labor agreements lock in cost floors, improving predictability but limiting downward flexibility. Workforce development partnerships can expand the labor pool over multiple years, reducing supplier pressure.
- Union/Davis-Bacon: higher base rates
- Craft shortages: upward wage pressure
- PLAs: predictability, fixed floors
- Workforce programs: long-term supply growth
Suppliers leverage: China 56%; BIM $9.2B; AGC hiring 83%; rentals +5–8%
Suppliers hold meaningful leverage: China made ~56% of global crude steel in 2023 and the global BIM market was ~9.2B USD in 2024, concentrating material and software power; AGC found 83% of firms had hiring difficulties in 2023, boosting subcontractor premiums. Rental premiums rose ~5–8% in 2024; Davis‑Bacon and PLAs set wage floors. Gilbane mitigates via multi‑sourcing, master agreements and open standards.
| Metric | Value |
|---|---|
| China steel share (2023) | 56% |
| BIM market (2024) | 9.2B USD |
| AGC hiring difficulty (2023) | 83% |
| Rental premiums (2024) | 5–8% |
What is included in the product
 Detailed Word Document
Uncovers key drivers of competition, customer influence, supplier power, entry barriers and substitutes specific to Gilbane, identifying disruptive threats and strategic advantages that affect pricing and profitability; delivered as a fully editable Word-ready analysis for use in investor materials, internal strategy decks, or academic projects.

 Customizable Excel Spreadsheet
Gilbane Porter's Five Forces Analysis delivers a single-sheet, customizable view of competitive pressures with radar-chart visualization for instant strategic clarity, ready to paste into decks. No complex setup—swap in your data, duplicate scenarios, and integrate into reports for faster, confident decisions.
Customers Bargaining Power

Sophisticated owner base
Healthcare systems, universities, and government agencies act as sophisticated buyers with dedicated procurement teams overseeing portfolios often worth billions, demanding transparent GMPs, open-book accounting, and robust risk transfer. Their technical expertise raises price sensitivity and performance expectations, shifting negotiations toward tighter SLAs and penalty clauses. Referenceability and documented past performance increasingly determine awards, with multi-year supplier track records prioritized.
Competitive tendering pressure
RFPs and hard-bid environments strengthen buyer leverage by forcing head-to-head price comparisons, driving fee compression even after shortlisted interviews shift some weight to design and service quality. Shortlists reduce pure price wins but industry fee compression of roughly 10-15% persists in competitive markets. Growth of alternative delivery—design-build/CMAR—reached about 40% share in 2024, and Gilbane’s preconstruction value-add helps defend margins.

Large contract concentration
Few, high-value projects (often $50–500 million) give owners strong leverage to dictate terms, contingencies, and extended warranties, shifting risk to contractors. Liquidated damages and schedule guarantees are typically enforced as non-negotiable contract clauses. Volume discounts and bundled programs can exchange price for multi-year pipeline visibility, while framework agreements stabilize utilization but commonly cap fee rates within a narrow 5–10% band.

Moderate switching costs
Owners can replace managers between preconstruction and build, but knowledge transfer and mobilization make midstream switching costly and risky; strong project controls and adoption of digital twins (digital twin market ~USD 6.7 billion in 2024, Grand View Research) raise exit barriers, while performance KPIs and phase-gate wins reduce churn risk for Gilbane.
- Manager replacement possible pre-build
- High midstream switching costs and risks
- Digital twins and controls increase exit barriers
- Phase-gate KPIs lower churn
Public sector procurement rules
Public sector procurement rules enforce transparency, bid bonds and strict compliance, strengthening buyer leverage; OECD estimates public procurement at about 12% of GDP (2024), amplifying buyer influence. Lengthy approval chains slow claims recovery and stress contractor cash flow, while Gilbane’s compliance infrastructure lowers its risk of disqualification. Design-assist and early contractor involvement remain viable differentiators within rules.
- Statutory transparency: increases buyer power
- 12% of GDP: scale of public procurement (OECD, 2024)
- Slow approvals: cash-flow pressure on contractors
- Compliance infrastructure: reduces disqualification risk
- Early involvement: allowable differentiation
Owners force 10-15% fee cuts as 40% alt delivery and digital twins scale
Sophisticated public and private owners (projects $50–500M) exert strong leverage via RFPs and hard bids, driving fee compression ~10–15% and preferring multi-year track records. Alternative delivery (design-build/CMAR) reached ~40% share in 2024, while public procurement (~12% of GDP, OECD 2024) and digital twins (market ~USD 6.7B in 2024) raise technical and compliance demands.
| Metric | Value (2024) |
|---|---|
| Fee compression | 10–15% |
| Alt. delivery share | 40% |
| Project size | $50–500M |
| Public procurement | ~12% GDP (OECD) |
| Digital twin market | USD 6.7B |
Full Version Awaits
Gilbane Porter's Five Forces Analysis
This preview shows the exact Gilbane Porter’s Five Forces Analysis you'll receive immediately after purchase—fully formatted, professionally written, and ready to use. No placeholders, mockups, or samples are included. Upon payment you will get instant access to this same complete document.

Don't Miss the Bigger Picture
Gilbane’s Porter's Five Forces snapshot outlines competitive rivalry, buyer and supplier power, threat of new entrants and substitutes, and industry dynamics shaping margins and growth prospects. This concise view highlights key pressures but omits depth on trends, metrics, and strategic implications. Unlock the full Porter's Five Forces Analysis to get force-by-force ratings, visuals, and actionable recommendations for Gilbane.
Suppliers Bargaining Power
Critical materials concentration
Structural steel sourcing is highly concentrated—China produced about 56% of global crude steel in 2023—giving key suppliers leverage over price and lead times for Gilbane; cement and specialized HVAC/electrical components similarly come from a limited pool. Global supply-chain shocks cascade into schedule risk and change-order exposure. Gilbane mitigates via multi-sourcing, early buyout, and hedging; long-term vendor frameworks temper but do not eliminate volatility.
Subcontractor dependency
Trade subcontractors perform the majority of field work, and AGC reported 83% of firms had hiring difficulties in 2023, concentrating supplier power in labor‑tight markets. Top subs are often overbooked and can command 5–10% premium or selectively allocate capacity. Prequalification and preferred networks shrink bidder pools but raise reliability, while incentive pay and 30‑day prompt payments improve retention.
Equipment and rental leverage
Heavy-equipment and crane suppliers can push costs on complex or congested sites; during 2024 peak cycles rental availability tightened and market reports showed rental premiums rising roughly 5–8%. Gilbane mitigates this through fleet planning, staggered schedules and master rental agreements that cut spot-rate exposure. Telematics-driven utilization management has lowered idle time by up to 20%, reducing equipment carrying costs.
Technology stack lock-in
BIM, CDEs and project platforms create high switching frictions and integration costs, with the global BIM market ~9.2 billion USD in 2024 increasing vendor leverage. Proprietary ecosystems can raise fees or limit data portability, amplifying supplier power. Gilbane’s open-standards, API-first tools and joint governance with owners mitigate lock-in and redistribute control.
- Vendor lock-in: increases costs
- Open standards: lower switching risk
- Joint governance: shared control
Union and skilled labor dynamics
Union agreements and Davis-Bacon prevailing wage rules (apply to federal contracts over $2,000) set higher labor rates and restrictive work rules, raising supplier leverage; craft shortages in MEP and specialty trades further push wage inflation and bidding power for skilled subcontractors. Project labor agreements lock in cost floors, improving predictability but limiting downward flexibility. Workforce development partnerships can expand the labor pool over multiple years, reducing supplier pressure.
- Union/Davis-Bacon: higher base rates
- Craft shortages: upward wage pressure
- PLAs: predictability, fixed floors
- Workforce programs: long-term supply growth
Suppliers leverage: China 56%; BIM $9.2B; AGC hiring 83%; rentals +5–8%
Suppliers hold meaningful leverage: China made ~56% of global crude steel in 2023 and the global BIM market was ~9.2B USD in 2024, concentrating material and software power; AGC found 83% of firms had hiring difficulties in 2023, boosting subcontractor premiums. Rental premiums rose ~5–8% in 2024; Davis‑Bacon and PLAs set wage floors. Gilbane mitigates via multi‑sourcing, master agreements and open standards.
| Metric | Value |
|---|---|
| China steel share (2023) | 56% |
| BIM market (2024) | 9.2B USD |
| AGC hiring difficulty (2023) | 83% |
| Rental premiums (2024) | 5–8% |
What is included in the product
Detailed Word Document
Uncovers key drivers of competition, customer influence, supplier power, entry barriers and substitutes specific to Gilbane, identifying disruptive threats and strategic advantages that affect pricing and profitability; delivered as a fully editable Word-ready analysis for use in investor materials, internal strategy decks, or academic projects.
Customizable Excel Spreadsheet
Gilbane Porter's Five Forces Analysis delivers a single-sheet, customizable view of competitive pressures with radar-chart visualization for instant strategic clarity, ready to paste into decks. No complex setup—swap in your data, duplicate scenarios, and integrate into reports for faster, confident decisions.
Customers Bargaining Power
Sophisticated owner base
Healthcare systems, universities, and government agencies act as sophisticated buyers with dedicated procurement teams overseeing portfolios often worth billions, demanding transparent GMPs, open-book accounting, and robust risk transfer. Their technical expertise raises price sensitivity and performance expectations, shifting negotiations toward tighter SLAs and penalty clauses. Referenceability and documented past performance increasingly determine awards, with multi-year supplier track records prioritized.
Competitive tendering pressure
RFPs and hard-bid environments strengthen buyer leverage by forcing head-to-head price comparisons, driving fee compression even after shortlisted interviews shift some weight to design and service quality. Shortlists reduce pure price wins but industry fee compression of roughly 10-15% persists in competitive markets. Growth of alternative delivery—design-build/CMAR—reached about 40% share in 2024, and Gilbane’s preconstruction value-add helps defend margins.
Large contract concentration
Few, high-value projects (often $50–500 million) give owners strong leverage to dictate terms, contingencies, and extended warranties, shifting risk to contractors. Liquidated damages and schedule guarantees are typically enforced as non-negotiable contract clauses. Volume discounts and bundled programs can exchange price for multi-year pipeline visibility, while framework agreements stabilize utilization but commonly cap fee rates within a narrow 5–10% band.
Moderate switching costs
Owners can replace managers between preconstruction and build, but knowledge transfer and mobilization make midstream switching costly and risky; strong project controls and adoption of digital twins (digital twin market ~USD 6.7 billion in 2024, Grand View Research) raise exit barriers, while performance KPIs and phase-gate wins reduce churn risk for Gilbane.
- Manager replacement possible pre-build
- High midstream switching costs and risks
- Digital twins and controls increase exit barriers
- Phase-gate KPIs lower churn
Public sector procurement rules
Public sector procurement rules enforce transparency, bid bonds and strict compliance, strengthening buyer leverage; OECD estimates public procurement at about 12% of GDP (2024), amplifying buyer influence. Lengthy approval chains slow claims recovery and stress contractor cash flow, while Gilbane’s compliance infrastructure lowers its risk of disqualification. Design-assist and early contractor involvement remain viable differentiators within rules.
- Statutory transparency: increases buyer power
- 12% of GDP: scale of public procurement (OECD, 2024)
- Slow approvals: cash-flow pressure on contractors
- Compliance infrastructure: reduces disqualification risk
- Early involvement: allowable differentiation
Owners force 10-15% fee cuts as 40% alt delivery and digital twins scale
Sophisticated public and private owners (projects $50–500M) exert strong leverage via RFPs and hard bids, driving fee compression ~10–15% and preferring multi-year track records. Alternative delivery (design-build/CMAR) reached ~40% share in 2024, while public procurement (~12% of GDP, OECD 2024) and digital twins (market ~USD 6.7B in 2024) raise technical and compliance demands.
| Metric | Value (2024) |
|---|---|
| Fee compression | 10–15% |
| Alt. delivery share | 40% |
| Project size | $50–500M |
| Public procurement | ~12% GDP (OECD) |
| Digital twin market | USD 6.7B |
Full Version Awaits
Gilbane Porter's Five Forces Analysis
This preview shows the exact Gilbane Porter’s Five Forces Analysis you'll receive immediately after purchase—fully formatted, professionally written, and ready to use. No placeholders, mockups, or samples are included. Upon payment you will get instant access to this same complete document.
Original: $10.00
-65%$10.00
$3.50Description
Don't Miss the Bigger Picture
Gilbane’s Porter's Five Forces snapshot outlines competitive rivalry, buyer and supplier power, threat of new entrants and substitutes, and industry dynamics shaping margins and growth prospects. This concise view highlights key pressures but omits depth on trends, metrics, and strategic implications. Unlock the full Porter's Five Forces Analysis to get force-by-force ratings, visuals, and actionable recommendations for Gilbane.
Suppliers Bargaining Power
Critical materials concentration
Structural steel sourcing is highly concentrated—China produced about 56% of global crude steel in 2023—giving key suppliers leverage over price and lead times for Gilbane; cement and specialized HVAC/electrical components similarly come from a limited pool. Global supply-chain shocks cascade into schedule risk and change-order exposure. Gilbane mitigates via multi-sourcing, early buyout, and hedging; long-term vendor frameworks temper but do not eliminate volatility.
Subcontractor dependency
Trade subcontractors perform the majority of field work, and AGC reported 83% of firms had hiring difficulties in 2023, concentrating supplier power in labor‑tight markets. Top subs are often overbooked and can command 5–10% premium or selectively allocate capacity. Prequalification and preferred networks shrink bidder pools but raise reliability, while incentive pay and 30‑day prompt payments improve retention.
Equipment and rental leverage
Heavy-equipment and crane suppliers can push costs on complex or congested sites; during 2024 peak cycles rental availability tightened and market reports showed rental premiums rising roughly 5–8%. Gilbane mitigates this through fleet planning, staggered schedules and master rental agreements that cut spot-rate exposure. Telematics-driven utilization management has lowered idle time by up to 20%, reducing equipment carrying costs.
Technology stack lock-in
BIM, CDEs and project platforms create high switching frictions and integration costs, with the global BIM market ~9.2 billion USD in 2024 increasing vendor leverage. Proprietary ecosystems can raise fees or limit data portability, amplifying supplier power. Gilbane’s open-standards, API-first tools and joint governance with owners mitigate lock-in and redistribute control.
- Vendor lock-in: increases costs
- Open standards: lower switching risk
- Joint governance: shared control
Union and skilled labor dynamics
Union agreements and Davis-Bacon prevailing wage rules (apply to federal contracts over $2,000) set higher labor rates and restrictive work rules, raising supplier leverage; craft shortages in MEP and specialty trades further push wage inflation and bidding power for skilled subcontractors. Project labor agreements lock in cost floors, improving predictability but limiting downward flexibility. Workforce development partnerships can expand the labor pool over multiple years, reducing supplier pressure.
- Union/Davis-Bacon: higher base rates
- Craft shortages: upward wage pressure
- PLAs: predictability, fixed floors
- Workforce programs: long-term supply growth
Suppliers leverage: China 56%; BIM $9.2B; AGC hiring 83%; rentals +5–8%
Suppliers hold meaningful leverage: China made ~56% of global crude steel in 2023 and the global BIM market was ~9.2B USD in 2024, concentrating material and software power; AGC found 83% of firms had hiring difficulties in 2023, boosting subcontractor premiums. Rental premiums rose ~5–8% in 2024; Davis‑Bacon and PLAs set wage floors. Gilbane mitigates via multi‑sourcing, master agreements and open standards.
| Metric | Value |
|---|---|
| China steel share (2023) | 56% |
| BIM market (2024) | 9.2B USD |
| AGC hiring difficulty (2023) | 83% |
| Rental premiums (2024) | 5–8% |
What is included in the product
Detailed Word Document
Uncovers key drivers of competition, customer influence, supplier power, entry barriers and substitutes specific to Gilbane, identifying disruptive threats and strategic advantages that affect pricing and profitability; delivered as a fully editable Word-ready analysis for use in investor materials, internal strategy decks, or academic projects.
Customizable Excel Spreadsheet
Gilbane Porter's Five Forces Analysis delivers a single-sheet, customizable view of competitive pressures with radar-chart visualization for instant strategic clarity, ready to paste into decks. No complex setup—swap in your data, duplicate scenarios, and integrate into reports for faster, confident decisions.
Customers Bargaining Power
Sophisticated owner base
Healthcare systems, universities, and government agencies act as sophisticated buyers with dedicated procurement teams overseeing portfolios often worth billions, demanding transparent GMPs, open-book accounting, and robust risk transfer. Their technical expertise raises price sensitivity and performance expectations, shifting negotiations toward tighter SLAs and penalty clauses. Referenceability and documented past performance increasingly determine awards, with multi-year supplier track records prioritized.
Competitive tendering pressure
RFPs and hard-bid environments strengthen buyer leverage by forcing head-to-head price comparisons, driving fee compression even after shortlisted interviews shift some weight to design and service quality. Shortlists reduce pure price wins but industry fee compression of roughly 10-15% persists in competitive markets. Growth of alternative delivery—design-build/CMAR—reached about 40% share in 2024, and Gilbane’s preconstruction value-add helps defend margins.
Large contract concentration
Few, high-value projects (often $50–500 million) give owners strong leverage to dictate terms, contingencies, and extended warranties, shifting risk to contractors. Liquidated damages and schedule guarantees are typically enforced as non-negotiable contract clauses. Volume discounts and bundled programs can exchange price for multi-year pipeline visibility, while framework agreements stabilize utilization but commonly cap fee rates within a narrow 5–10% band.
Moderate switching costs
Owners can replace managers between preconstruction and build, but knowledge transfer and mobilization make midstream switching costly and risky; strong project controls and adoption of digital twins (digital twin market ~USD 6.7 billion in 2024, Grand View Research) raise exit barriers, while performance KPIs and phase-gate wins reduce churn risk for Gilbane.
- Manager replacement possible pre-build
- High midstream switching costs and risks
- Digital twins and controls increase exit barriers
- Phase-gate KPIs lower churn
Public sector procurement rules
Public sector procurement rules enforce transparency, bid bonds and strict compliance, strengthening buyer leverage; OECD estimates public procurement at about 12% of GDP (2024), amplifying buyer influence. Lengthy approval chains slow claims recovery and stress contractor cash flow, while Gilbane’s compliance infrastructure lowers its risk of disqualification. Design-assist and early contractor involvement remain viable differentiators within rules.
- Statutory transparency: increases buyer power
- 12% of GDP: scale of public procurement (OECD, 2024)
- Slow approvals: cash-flow pressure on contractors
- Compliance infrastructure: reduces disqualification risk
- Early involvement: allowable differentiation
Owners force 10-15% fee cuts as 40% alt delivery and digital twins scale
Sophisticated public and private owners (projects $50–500M) exert strong leverage via RFPs and hard bids, driving fee compression ~10–15% and preferring multi-year track records. Alternative delivery (design-build/CMAR) reached ~40% share in 2024, while public procurement (~12% of GDP, OECD 2024) and digital twins (market ~USD 6.7B in 2024) raise technical and compliance demands.
| Metric | Value (2024) |
|---|---|
| Fee compression | 10–15% |
| Alt. delivery share | 40% |
| Project size | $50–500M |
| Public procurement | ~12% GDP (OECD) |
| Digital twin market | USD 6.7B |
Full Version Awaits
Gilbane Porter's Five Forces Analysis
This preview shows the exact Gilbane Porter’s Five Forces Analysis you'll receive immediately after purchase—fully formatted, professionally written, and ready to use. No placeholders, mockups, or samples are included. Upon payment you will get instant access to this same complete document.











