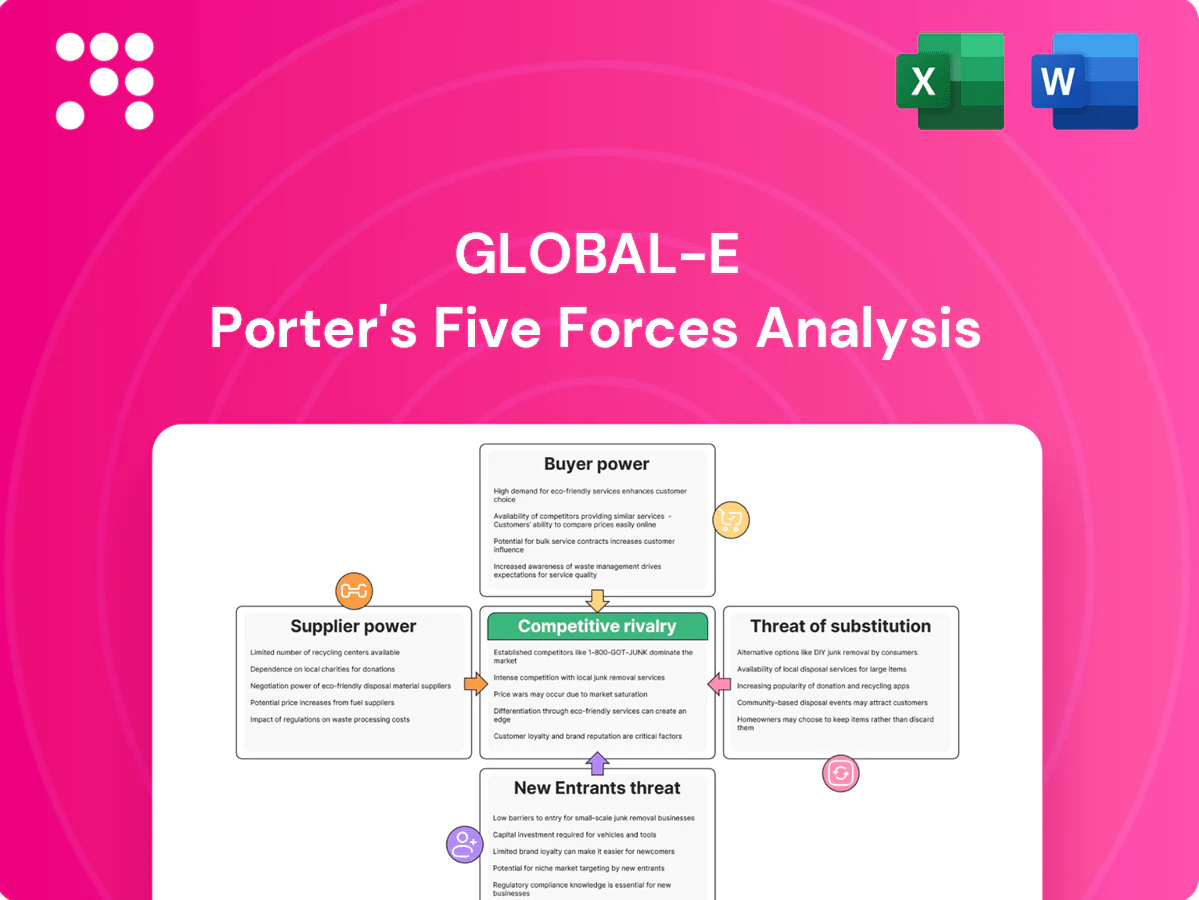
Global-e Porter's Five Forces Analysis

Elevate Your Analysis with the Complete Porter's Five Forces Analysis
Global-e faces moderate buyer power and high rivalry as cross-border e-commerce grows, while supplier leverage and platform dependence raise operational risks; regulatory complexity and tech differentiation shape the threat of new entrants and substitutes. Strategic moves must focus on scale, compliance, and platform diversification. This preview is just the beginning. Unlock the full Porter's Five Forces Analysis to explore Global-e’s competitive dynamics, market pressures, and strategic advantages in detail.
Suppliers Bargaining Power

Payment processors’ leverage
Global-e depends on PSPs and card networks for local tender types, authorization rates and fraud tools, which gives processors pricing and service leverage; in 2024 cross-border markups and interchange/scheme fees commonly add roughly 100–300 basis points to checkout costs. Multi-PSP routing and volume aggregation allow Global-e to negotiate better terms and optimize authorization rates (typically 85–98%). Network outages or rule changes can ripple through checkout performance, sometimes reducing success rates by double digits.
Logistics carriers and brokers
Logistics carriers and brokers exert strong supplier power for Global-e because international shipping, DDP/DAP handling and customs brokerage hinge on carrier networks; the top 10 container carriers controlled roughly 80% of global capacity in 2024, amplifying leverage through capacity constraints, fuel surcharges and service variability.
Diversifying lanes and partners mitigates dependence but raises integration and TMS/ERP complexity and costs, while preferential SLAs demand scale and multi-year volume commitments to secure prioritized space and stable rates.

Cloud and infrastructure vendors
Compute, CDN and data platforms are concentrated: AWS 32%, Microsoft Azure 23%, Google Cloud 11% in 2024, giving suppliers pricing power. Pricing tiers, egress fees (commonly ~$0.09/GB) and reserved capacity discounts (up to ~72%) materially affect Global-e margins. Multi-cloud and portability reduce vendor lock-in but raise engineering overhead. Vendor performance SLAs (eg 99.99% storage/compute) are critical for peak events.

FX liquidity and banking partners
Cross-currency pricing and settlement depend on banking partners/LPs that set spreads and cutoffs; in stressed periods FX spreads have been observed to widen from typical 10–30 bps to 100–200 bps, raising costs and settlement risk. Multiple LPs, netting and hedging programs shift bargaining power back to merchants. Regulatory moves in 2024 around PSD2 equivalence and stricter AML/KYC tightened bank relationships.
- Typical spread baseline: 10–30 bps
- Stress spread range: 100–200 bps
- 2024: increased AML/KYC and PSD2 scrutiny
Data, tax, and compliance providers
Duties, VAT/GST, product restrictions and fraud intelligence depend on niche data sources spanning 190+ VAT/GST regimes; proprietary databases and frequent rule updates (post-OSS era) give suppliers leverage. Building internal rules engines reduces dependence but requires ongoing maintenance and expert updates. API SLAs and accuracy guarantees become central negotiation points, as ~60% of shoppers abandoned carts over unexpected fees (2023–24 surveys).
- Data depth: niche tax and restrictions
- Update cadence: frequent rule changes
- Ops cost: continuous maintenance
- Negotiation focus: API SLA & accuracy
Supplier leverage: PSP fees, carrier concentration, cloud & bank margin control
Suppliers hold meaningful leverage: PSPs/card networks add ~100–300 bps and drive auth rates (85–98%); top-10 carriers held ~80% capacity in 2024, raising logistics power; cloud providers (AWS 32%, Azure 23%, GCP 11%) and banks (FX spreads 10–30 bps baseline, 100–200 bps in stress) materially affect margins and ops.
| Supplier | Key 2024 metric |
|---|---|
| PSPs/Card nets | 100–300 bps; auth 85–98% |
| Carriers | Top-10 = ~80% capacity |
| Cloud | AWS32%/Azure23%/GCP11% |
| FX/Banks | 10–30 bps (baseline); 100–200 bps stress |
What is included in the product
 Detailed Word Document
Assessing Global-e's competitive forces—rivalry, buyer and supplier power, threat of entrants and substitutes—to reveal pricing pressures, entry barriers, partner dependencies, disruptive risks, and strategic levers to protect market position.

 Customizable Excel Spreadsheet
A concise, one-sheet Porter's Five Forces for Global-e that visualizes competitive pressures with a radar chart, lets you customize inputs for scenarios (pre/post regulation, new entrants), requires no complex code, and is deck-ready—instantly clarifying strategic levers and easing decision-making.
Customers Bargaining Power

Enterprise merchants demand concessions
Enterprise merchants, which Global-e disclosed in 2024 account for over 60% of platform GMV, exert strong bargaining power by negotiating fees, SLAs and bespoke features; their alternatives include rival platforms or partial in-house builds. Losing a flagship logo creates signaling risk that can depress new client win rates. Global-e uses volume-based pricing tiers and co-marketing deals to rebalance leverage and lock in high-GMV customers.
Multi-homing and switching options
Merchants routinely multi-home by region and function—using separate partners for payments, logistics and tax—which dilutes vendor exclusivity and heightens pricing pressure; cross-border commerce made up about 25% of global e-commerce in 2024, intensifying regional vendor choice.
Deeper integration and embedded analytics raise switching costs but rarely create prohibitive lock-in; many contracts remain annual, so effective lock-in depends on contract length and quality of migration tooling.

Performance transparency
Performance transparency gives buyers leverage as KPIs—authorization rates, conversion, delivery times and landed-cost accuracy—are directly measurable and comparable across merchants in 2024, enabling data-driven demands for refunds or service credits. Clear benchmarking lets merchants quantify gaps and push carriers or platforms for improvement. Quarterly business reviews institutionalize scrutiny, and documented underperformance rapidly converts into pricing pressure or churn threats.

Consumer experience expectations
End shoppers demand local payments, fast shipping, free returns and no surprise fees, and Global-e — which serves 2,000+ brands — faces merchants pushing for rapid feature velocity and cost relief; negative NPS can trigger penalties or renegotiations, forcing continuous localization and checkout optimization to contain downstream customer power.
- Local payments
- Fast shipping
- Free returns
- No surprise fees
Alternative go-to-market paths
Marketplaces, regional distributors, and PSP add-ons present credible alternatives to Global-e, collectively capturing over half of online retail GMV and capping merchants’ willingness to pay for a full-stack cross-border solution. Bundled offerings from major commerce platforms and marketplaces undercut standalone pricing, compressing Global-e’s margin potential. This reduces pricing latitude with price-sensitive merchants and raises churn risk.
- Marketplaces/distributors: >50% online GMV
- Platform bundles: often priced below standalone cross-border fees
- Merchant sensitivity: pricing is a primary switching driver
>60% enterprise GMV; marketplaces >50%; ~25% cross-border
Enterprise merchants (>60% of Global-e GMV in 2024) exert high bargaining power via fee, SLA and feature demands; losing a flagship creates signaling risk.
Multi-homing (payments, logistics, tax) and marketplaces (>50% online GMV) compress pricing; cross-border was ~25% of e-commerce in 2024.
Volume tiers, co-marketing and deeper integrations raise but do not remove switching risk for Global-e (2,000+ brands).
| Metric | 2024 |
|---|---|
| Enterprise GMV share | >60% |
| Cross-border e‑commerce | ~25% |
| Brands on platform | 2,000+ |
| Marketplaces GMV | >50% |
Full Version Awaits
Global-e Porter's Five Forces Analysis
This preview shows the exact Global‑e Porter’s Five Forces analysis you’ll receive—fully written, professionally formatted and ready to download the moment you purchase. It contains a complete assessment of competitive rivalry, supplier and buyer power, threat of substitutes and barriers to entry. No placeholders, no mockups—instant access to the same file you see here.

Elevate Your Analysis with the Complete Porter's Five Forces Analysis
Global-e faces moderate buyer power and high rivalry as cross-border e-commerce grows, while supplier leverage and platform dependence raise operational risks; regulatory complexity and tech differentiation shape the threat of new entrants and substitutes. Strategic moves must focus on scale, compliance, and platform diversification. This preview is just the beginning. Unlock the full Porter's Five Forces Analysis to explore Global-e’s competitive dynamics, market pressures, and strategic advantages in detail.
Suppliers Bargaining Power
Payment processors’ leverage
Global-e depends on PSPs and card networks for local tender types, authorization rates and fraud tools, which gives processors pricing and service leverage; in 2024 cross-border markups and interchange/scheme fees commonly add roughly 100–300 basis points to checkout costs. Multi-PSP routing and volume aggregation allow Global-e to negotiate better terms and optimize authorization rates (typically 85–98%). Network outages or rule changes can ripple through checkout performance, sometimes reducing success rates by double digits.
Logistics carriers and brokers
Logistics carriers and brokers exert strong supplier power for Global-e because international shipping, DDP/DAP handling and customs brokerage hinge on carrier networks; the top 10 container carriers controlled roughly 80% of global capacity in 2024, amplifying leverage through capacity constraints, fuel surcharges and service variability.
Diversifying lanes and partners mitigates dependence but raises integration and TMS/ERP complexity and costs, while preferential SLAs demand scale and multi-year volume commitments to secure prioritized space and stable rates.
Cloud and infrastructure vendors
Compute, CDN and data platforms are concentrated: AWS 32%, Microsoft Azure 23%, Google Cloud 11% in 2024, giving suppliers pricing power. Pricing tiers, egress fees (commonly ~$0.09/GB) and reserved capacity discounts (up to ~72%) materially affect Global-e margins. Multi-cloud and portability reduce vendor lock-in but raise engineering overhead. Vendor performance SLAs (eg 99.99% storage/compute) are critical for peak events.
FX liquidity and banking partners
Cross-currency pricing and settlement depend on banking partners/LPs that set spreads and cutoffs; in stressed periods FX spreads have been observed to widen from typical 10–30 bps to 100–200 bps, raising costs and settlement risk. Multiple LPs, netting and hedging programs shift bargaining power back to merchants. Regulatory moves in 2024 around PSD2 equivalence and stricter AML/KYC tightened bank relationships.
- Typical spread baseline: 10–30 bps
- Stress spread range: 100–200 bps
- 2024: increased AML/KYC and PSD2 scrutiny
Data, tax, and compliance providers
Duties, VAT/GST, product restrictions and fraud intelligence depend on niche data sources spanning 190+ VAT/GST regimes; proprietary databases and frequent rule updates (post-OSS era) give suppliers leverage. Building internal rules engines reduces dependence but requires ongoing maintenance and expert updates. API SLAs and accuracy guarantees become central negotiation points, as ~60% of shoppers abandoned carts over unexpected fees (2023–24 surveys).
- Data depth: niche tax and restrictions
- Update cadence: frequent rule changes
- Ops cost: continuous maintenance
- Negotiation focus: API SLA & accuracy
Supplier leverage: PSP fees, carrier concentration, cloud & bank margin control
Suppliers hold meaningful leverage: PSPs/card networks add ~100–300 bps and drive auth rates (85–98%); top-10 carriers held ~80% capacity in 2024, raising logistics power; cloud providers (AWS 32%, Azure 23%, GCP 11%) and banks (FX spreads 10–30 bps baseline, 100–200 bps in stress) materially affect margins and ops.
| Supplier | Key 2024 metric |
|---|---|
| PSPs/Card nets | 100–300 bps; auth 85–98% |
| Carriers | Top-10 = ~80% capacity |
| Cloud | AWS32%/Azure23%/GCP11% |
| FX/Banks | 10–30 bps (baseline); 100–200 bps stress |
What is included in the product
Detailed Word Document
Assessing Global-e's competitive forces—rivalry, buyer and supplier power, threat of entrants and substitutes—to reveal pricing pressures, entry barriers, partner dependencies, disruptive risks, and strategic levers to protect market position.
Customizable Excel Spreadsheet
A concise, one-sheet Porter's Five Forces for Global-e that visualizes competitive pressures with a radar chart, lets you customize inputs for scenarios (pre/post regulation, new entrants), requires no complex code, and is deck-ready—instantly clarifying strategic levers and easing decision-making.
Customers Bargaining Power
Enterprise merchants demand concessions
Enterprise merchants, which Global-e disclosed in 2024 account for over 60% of platform GMV, exert strong bargaining power by negotiating fees, SLAs and bespoke features; their alternatives include rival platforms or partial in-house builds. Losing a flagship logo creates signaling risk that can depress new client win rates. Global-e uses volume-based pricing tiers and co-marketing deals to rebalance leverage and lock in high-GMV customers.
Multi-homing and switching options
Merchants routinely multi-home by region and function—using separate partners for payments, logistics and tax—which dilutes vendor exclusivity and heightens pricing pressure; cross-border commerce made up about 25% of global e-commerce in 2024, intensifying regional vendor choice.
Deeper integration and embedded analytics raise switching costs but rarely create prohibitive lock-in; many contracts remain annual, so effective lock-in depends on contract length and quality of migration tooling.
Performance transparency
Performance transparency gives buyers leverage as KPIs—authorization rates, conversion, delivery times and landed-cost accuracy—are directly measurable and comparable across merchants in 2024, enabling data-driven demands for refunds or service credits. Clear benchmarking lets merchants quantify gaps and push carriers or platforms for improvement. Quarterly business reviews institutionalize scrutiny, and documented underperformance rapidly converts into pricing pressure or churn threats.
Consumer experience expectations
End shoppers demand local payments, fast shipping, free returns and no surprise fees, and Global-e — which serves 2,000+ brands — faces merchants pushing for rapid feature velocity and cost relief; negative NPS can trigger penalties or renegotiations, forcing continuous localization and checkout optimization to contain downstream customer power.
- Local payments
- Fast shipping
- Free returns
- No surprise fees
Alternative go-to-market paths
Marketplaces, regional distributors, and PSP add-ons present credible alternatives to Global-e, collectively capturing over half of online retail GMV and capping merchants’ willingness to pay for a full-stack cross-border solution. Bundled offerings from major commerce platforms and marketplaces undercut standalone pricing, compressing Global-e’s margin potential. This reduces pricing latitude with price-sensitive merchants and raises churn risk.
- Marketplaces/distributors: >50% online GMV
- Platform bundles: often priced below standalone cross-border fees
- Merchant sensitivity: pricing is a primary switching driver
>60% enterprise GMV; marketplaces >50%; ~25% cross-border
Enterprise merchants (>60% of Global-e GMV in 2024) exert high bargaining power via fee, SLA and feature demands; losing a flagship creates signaling risk.
Multi-homing (payments, logistics, tax) and marketplaces (>50% online GMV) compress pricing; cross-border was ~25% of e-commerce in 2024.
Volume tiers, co-marketing and deeper integrations raise but do not remove switching risk for Global-e (2,000+ brands).
| Metric | 2024 |
|---|---|
| Enterprise GMV share | >60% |
| Cross-border e‑commerce | ~25% |
| Brands on platform | 2,000+ |
| Marketplaces GMV | >50% |
Full Version Awaits
Global-e Porter's Five Forces Analysis
This preview shows the exact Global‑e Porter’s Five Forces analysis you’ll receive—fully written, professionally formatted and ready to download the moment you purchase. It contains a complete assessment of competitive rivalry, supplier and buyer power, threat of substitutes and barriers to entry. No placeholders, no mockups—instant access to the same file you see here.
Original: $10.00
-65%$10.00
$3.50Description
Elevate Your Analysis with the Complete Porter's Five Forces Analysis
Global-e faces moderate buyer power and high rivalry as cross-border e-commerce grows, while supplier leverage and platform dependence raise operational risks; regulatory complexity and tech differentiation shape the threat of new entrants and substitutes. Strategic moves must focus on scale, compliance, and platform diversification. This preview is just the beginning. Unlock the full Porter's Five Forces Analysis to explore Global-e’s competitive dynamics, market pressures, and strategic advantages in detail.
Suppliers Bargaining Power
Payment processors’ leverage
Global-e depends on PSPs and card networks for local tender types, authorization rates and fraud tools, which gives processors pricing and service leverage; in 2024 cross-border markups and interchange/scheme fees commonly add roughly 100–300 basis points to checkout costs. Multi-PSP routing and volume aggregation allow Global-e to negotiate better terms and optimize authorization rates (typically 85–98%). Network outages or rule changes can ripple through checkout performance, sometimes reducing success rates by double digits.
Logistics carriers and brokers
Logistics carriers and brokers exert strong supplier power for Global-e because international shipping, DDP/DAP handling and customs brokerage hinge on carrier networks; the top 10 container carriers controlled roughly 80% of global capacity in 2024, amplifying leverage through capacity constraints, fuel surcharges and service variability.
Diversifying lanes and partners mitigates dependence but raises integration and TMS/ERP complexity and costs, while preferential SLAs demand scale and multi-year volume commitments to secure prioritized space and stable rates.
Cloud and infrastructure vendors
Compute, CDN and data platforms are concentrated: AWS 32%, Microsoft Azure 23%, Google Cloud 11% in 2024, giving suppliers pricing power. Pricing tiers, egress fees (commonly ~$0.09/GB) and reserved capacity discounts (up to ~72%) materially affect Global-e margins. Multi-cloud and portability reduce vendor lock-in but raise engineering overhead. Vendor performance SLAs (eg 99.99% storage/compute) are critical for peak events.
FX liquidity and banking partners
Cross-currency pricing and settlement depend on banking partners/LPs that set spreads and cutoffs; in stressed periods FX spreads have been observed to widen from typical 10–30 bps to 100–200 bps, raising costs and settlement risk. Multiple LPs, netting and hedging programs shift bargaining power back to merchants. Regulatory moves in 2024 around PSD2 equivalence and stricter AML/KYC tightened bank relationships.
- Typical spread baseline: 10–30 bps
- Stress spread range: 100–200 bps
- 2024: increased AML/KYC and PSD2 scrutiny
Data, tax, and compliance providers
Duties, VAT/GST, product restrictions and fraud intelligence depend on niche data sources spanning 190+ VAT/GST regimes; proprietary databases and frequent rule updates (post-OSS era) give suppliers leverage. Building internal rules engines reduces dependence but requires ongoing maintenance and expert updates. API SLAs and accuracy guarantees become central negotiation points, as ~60% of shoppers abandoned carts over unexpected fees (2023–24 surveys).
- Data depth: niche tax and restrictions
- Update cadence: frequent rule changes
- Ops cost: continuous maintenance
- Negotiation focus: API SLA & accuracy
Supplier leverage: PSP fees, carrier concentration, cloud & bank margin control
Suppliers hold meaningful leverage: PSPs/card networks add ~100–300 bps and drive auth rates (85–98%); top-10 carriers held ~80% capacity in 2024, raising logistics power; cloud providers (AWS 32%, Azure 23%, GCP 11%) and banks (FX spreads 10–30 bps baseline, 100–200 bps in stress) materially affect margins and ops.
| Supplier | Key 2024 metric |
|---|---|
| PSPs/Card nets | 100–300 bps; auth 85–98% |
| Carriers | Top-10 = ~80% capacity |
| Cloud | AWS32%/Azure23%/GCP11% |
| FX/Banks | 10–30 bps (baseline); 100–200 bps stress |
What is included in the product
Detailed Word Document
Assessing Global-e's competitive forces—rivalry, buyer and supplier power, threat of entrants and substitutes—to reveal pricing pressures, entry barriers, partner dependencies, disruptive risks, and strategic levers to protect market position.
Customizable Excel Spreadsheet
A concise, one-sheet Porter's Five Forces for Global-e that visualizes competitive pressures with a radar chart, lets you customize inputs for scenarios (pre/post regulation, new entrants), requires no complex code, and is deck-ready—instantly clarifying strategic levers and easing decision-making.
Customers Bargaining Power
Enterprise merchants demand concessions
Enterprise merchants, which Global-e disclosed in 2024 account for over 60% of platform GMV, exert strong bargaining power by negotiating fees, SLAs and bespoke features; their alternatives include rival platforms or partial in-house builds. Losing a flagship logo creates signaling risk that can depress new client win rates. Global-e uses volume-based pricing tiers and co-marketing deals to rebalance leverage and lock in high-GMV customers.
Multi-homing and switching options
Merchants routinely multi-home by region and function—using separate partners for payments, logistics and tax—which dilutes vendor exclusivity and heightens pricing pressure; cross-border commerce made up about 25% of global e-commerce in 2024, intensifying regional vendor choice.
Deeper integration and embedded analytics raise switching costs but rarely create prohibitive lock-in; many contracts remain annual, so effective lock-in depends on contract length and quality of migration tooling.
Performance transparency
Performance transparency gives buyers leverage as KPIs—authorization rates, conversion, delivery times and landed-cost accuracy—are directly measurable and comparable across merchants in 2024, enabling data-driven demands for refunds or service credits. Clear benchmarking lets merchants quantify gaps and push carriers or platforms for improvement. Quarterly business reviews institutionalize scrutiny, and documented underperformance rapidly converts into pricing pressure or churn threats.
Consumer experience expectations
End shoppers demand local payments, fast shipping, free returns and no surprise fees, and Global-e — which serves 2,000+ brands — faces merchants pushing for rapid feature velocity and cost relief; negative NPS can trigger penalties or renegotiations, forcing continuous localization and checkout optimization to contain downstream customer power.
- Local payments
- Fast shipping
- Free returns
- No surprise fees
Alternative go-to-market paths
Marketplaces, regional distributors, and PSP add-ons present credible alternatives to Global-e, collectively capturing over half of online retail GMV and capping merchants’ willingness to pay for a full-stack cross-border solution. Bundled offerings from major commerce platforms and marketplaces undercut standalone pricing, compressing Global-e’s margin potential. This reduces pricing latitude with price-sensitive merchants and raises churn risk.
- Marketplaces/distributors: >50% online GMV
- Platform bundles: often priced below standalone cross-border fees
- Merchant sensitivity: pricing is a primary switching driver
>60% enterprise GMV; marketplaces >50%; ~25% cross-border
Enterprise merchants (>60% of Global-e GMV in 2024) exert high bargaining power via fee, SLA and feature demands; losing a flagship creates signaling risk.
Multi-homing (payments, logistics, tax) and marketplaces (>50% online GMV) compress pricing; cross-border was ~25% of e-commerce in 2024.
Volume tiers, co-marketing and deeper integrations raise but do not remove switching risk for Global-e (2,000+ brands).
| Metric | 2024 |
|---|---|
| Enterprise GMV share | >60% |
| Cross-border e‑commerce | ~25% |
| Brands on platform | 2,000+ |
| Marketplaces GMV | >50% |
Full Version Awaits
Global-e Porter's Five Forces Analysis
This preview shows the exact Global‑e Porter’s Five Forces analysis you’ll receive—fully written, professionally formatted and ready to download the moment you purchase. It contains a complete assessment of competitive rivalry, supplier and buyer power, threat of substitutes and barriers to entry. No placeholders, no mockups—instant access to the same file you see here.











