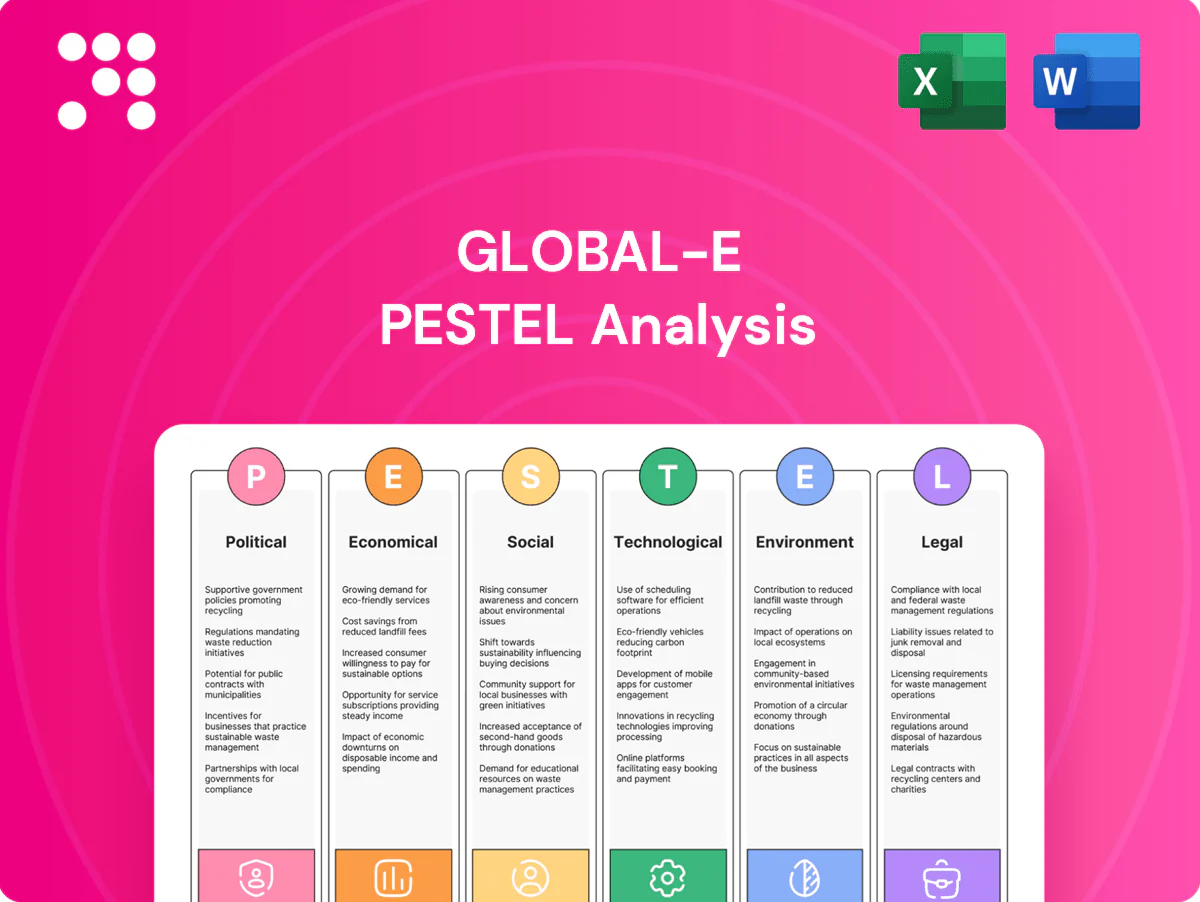
Global-e PESTLE Analysis

Plan Smarter. Present Sharper. Compete Stronger.
Gain strategic clarity with our PESTLE analysis of Global-e, revealing how political, economic and technological shifts shape cross-border e‑commerce. Ideal for investors, strategists and consultants, it translates macro trends into actionable risks and opportunities. Purchase the full report for the complete breakdown, editable charts and instant download.
Political factors

Geopolitical tensions and trade policy
Shifts in trade relations, sanctions and export controls—for example US-China tariffs covering roughly $360bn of goods—can immediately block merchant access to markets and specific SKUs. Tariff changes and customs duties raise landed costs and consumer prices, reducing conversion rates. Global-e, which serves merchants in over 200 markets, must dynamically adapt routing and compliance rules. Diversification across regions mitigates single-market shocks.
Customs and border administration
Variability in customs efficiency and rules across 200+ markets materially affects delivery SLAs and landed costs, driving longer transit times and higher exception fees. Political reforms can either streamline clearance or introduce new paperwork and delays. Global-e’s pre-calculation of duties and taxes must track frequent tariff and policy updates to remain accurate. Proactive communication reduces consumer disputes and cart abandonment, with unexpected costs cited by ~49% of shoppers as a top reason for checkout abandonment.

Government digital agendas
National pushes toward digital commerce expand Global-e’s addressable market—global e-commerce reached about $5.7 trillion in 2022, with continued growth into 2024. Conversely, new platform and data localization rules, including the EU Digital Markets and Services Acts effective 2024, add compliance and operational complexity. Aligning to local payment rails and government ID programs improves authorization and policy monitoring informs market-entry sequencing.

Brexit and regional integration dynamics
Brexit (UK exit finalized Jan 31 2020; new trade rules from Jan 1 2021) created divergent VAT and customs regimes as the UK left the EU Customs Union; the UK standard VAT rate remains 20% and the EU implemented the VAT e-commerce package on July 1, 2021. Global-e must maintain parallel rule sets, documentation templates and proactive merchant education to avoid cross-border compliance gaps.
- Parallel rule sets: UK vs EU
- Key dates: Brexit 2020, new rules 2021
- Regulatory lever: EU VAT e‑commerce package (Jul 2021)
Political stability and infrastructure investment
Political stability drives investment in logistics, broadband and postal networks that underpin cross-border delivery; ITU reported about 67% global internet penetration in 2023, supporting e-commerce growth (Statista estimates global retail e-commerce ~6.3 trillion USD in 2024). Instability raises disruption and currency-control risks; scenario planning, rerouting and carrier reallocation plus insurance and contingency inventory preserve service levels.
- Stable governance: higher infrastructure spend
- Instability: disruption, currency controls
- Mitigation: scenario planning, rerouting
- Resilience: insurance, contingency inventory
Regulatory shocks reshape cross-border e‑commerce: tariffs, DMA/DSA, VAT and customs risk
Political shifts—tariffs (US-China ~$360bn), sanctions, data localization and platform rules (EU DMA/DSA 2024) materially alter market access, costs and compliance for Global-e (200+ markets). Customs variability and VAT reforms (EU e‑commerce VAT Jul 2021; UK VAT 20%) drive landed-cost volatility; e‑commerce reached ~$6.3trn in 2024, enlarging opportunity but raising regulatory burden.
| Indicator | Value/Year |
|---|---|
| Markets served | 200+ |
| Global e‑commerce | $6.3trn (2024) |
| US‑China tariffs | ~$360bn |
| EU VAT reform | Jul 2021 |
What is included in the product
 Detailed Word Document
Explores how macro-environmental factors uniquely affect Global-e across Political, Economic, Social, Technological, Environmental and Legal dimensions, with data-backed trends and actionable, forward-looking insights. Designed to support executives, investors and strategists in scenario planning and opportunity/risk mitigation.

 Customizable Excel Spreadsheet
A concise, visually segmented Global‑e PESTLE summary that’s easily dropped into presentations, editable with contextual notes, and shareable across teams to streamline risk discussions, client reports, and strategic planning.
Economic factors

Consumer spending and macro cycles
Inflation (US CPI ~3.4% in 2024) and unemployment (US ~3.7% 2024) squeezed real wages, reducing discretionary online spend and extending purchase decision cycles. Downturns push shoppers to promotions and BNPL; Global-e can protect conversions by optimizing dynamic pricing, upfront duties/taxes display and localized financing. Category mix matters: essentials consistently outperformed discretionary during weak cycles, preserving AOV and repeat rates.
FX volatility and pricing
Currency swings alter perceived prices and squeeze merchant margins; BIS data shows global FX turnover at about $7.5 trillion/day (2022), underlining scale of exposure. Transparent, localized pricing with hedging options and real-time FX plus rounding logic reduces checkout shock and lifts conversion. In volatile corridors merchants commonly add margin buffers to protect profitability.

Logistics costs and capacity
Carrier base rates plus fuel surcharges—often 8–12% in 2024—plus peak-season uplifts (commonly 20–30%) materially raise total landed cost. Efficient carrier selection and label optimization can shave several percentage points off margins. Multi-node fulfillment and DDP reduce duty surprises and can lower return rates by ~15–25%. Performance SLAs should flex with seasonal capacity to avoid cost spikes.

Payment acceptance and authorization rates
Local tender availability and issuer behavior are primary drivers of approval; economic stress in 2023–24 correlated with higher fraud and chargebacks, squeezing authorization rates and margins. Offering wallets, BNPL and local alternatives materially expands reach, while intelligent retries and network tokenization have been shown to lift success rates by double digits in many merchant case studies.
- Local tenders & issuer rules
- Economic stress → higher fraud/chargebacks
- Wallets, BNPL, alt payments increase reach
- Intelligent retries & tokenization → double-digit approval gains
Market growth in cross-border e-commerce
Structural growth in cross-border e-commerce persists as merchants chase incremental demand abroad; cross-border now represents roughly 25% of global e-commerce and has been growing near a 10% CAGR through 2024. Penetration varies regionally, with mobile-led markets like Southeast Asia seeing >70% of online transactions on mobile, so Global-e can prioritize high-growth APAC–EU and US–APAC corridors and fast-growing categories such as beauty and apparel. Partnerships with marketplaces and logistics providers can accelerate merchant onboarding at scale, improving time-to-revenue and GMV conversion.
- 25%: share of cross-border in global e-commerce
- ~10% CAGR through 2024
- >70% mobile share in SEA
- Priority corridors: APAC–EU, US–APAC
Regulatory shocks reshape cross-border e‑commerce: tariffs, DMA/DSA, VAT and customs risk
Higher inflation and tight labor (US CPI ~3.4% 2024; unemployment ~3.7% 2024) cut real wages, shifting shoppers to promotions and BNPL and lengthening purchase cycles, pressuring AOV. FX volatility (FX turnover ~$7.5T/day) and carrier fuel/peak surcharges (8–12% / peak +20–30% 2024) raise landed costs and margin risk. Cross-border growth (~25% share; ~10% CAGR through 2024) keeps upside if pricing, localized payments and DDP are optimized.
| Metric | Value |
|---|---|
| US CPI 2024 | ~3.4% |
| US Unemployment 2024 | ~3.7% |
| FX turnover | ~$7.5T/day (2022) |
| Cross-border share | ~25% (10% CAGR) |
Preview Before You Purchase
Global-e PESTLE Analysis
This Global-e PESTLE Analysis preview is the exact, fully formatted document you’ll receive after purchase, with complete content, structure, and professional layout. No placeholders or teasers—what you see is the final file ready to download and use immediately.

Plan Smarter. Present Sharper. Compete Stronger.
Gain strategic clarity with our PESTLE analysis of Global-e, revealing how political, economic and technological shifts shape cross-border e‑commerce. Ideal for investors, strategists and consultants, it translates macro trends into actionable risks and opportunities. Purchase the full report for the complete breakdown, editable charts and instant download.
Political factors
Geopolitical tensions and trade policy
Shifts in trade relations, sanctions and export controls—for example US-China tariffs covering roughly $360bn of goods—can immediately block merchant access to markets and specific SKUs. Tariff changes and customs duties raise landed costs and consumer prices, reducing conversion rates. Global-e, which serves merchants in over 200 markets, must dynamically adapt routing and compliance rules. Diversification across regions mitigates single-market shocks.
Customs and border administration
Variability in customs efficiency and rules across 200+ markets materially affects delivery SLAs and landed costs, driving longer transit times and higher exception fees. Political reforms can either streamline clearance or introduce new paperwork and delays. Global-e’s pre-calculation of duties and taxes must track frequent tariff and policy updates to remain accurate. Proactive communication reduces consumer disputes and cart abandonment, with unexpected costs cited by ~49% of shoppers as a top reason for checkout abandonment.
Government digital agendas
National pushes toward digital commerce expand Global-e’s addressable market—global e-commerce reached about $5.7 trillion in 2022, with continued growth into 2024. Conversely, new platform and data localization rules, including the EU Digital Markets and Services Acts effective 2024, add compliance and operational complexity. Aligning to local payment rails and government ID programs improves authorization and policy monitoring informs market-entry sequencing.
Brexit and regional integration dynamics
Brexit (UK exit finalized Jan 31 2020; new trade rules from Jan 1 2021) created divergent VAT and customs regimes as the UK left the EU Customs Union; the UK standard VAT rate remains 20% and the EU implemented the VAT e-commerce package on July 1, 2021. Global-e must maintain parallel rule sets, documentation templates and proactive merchant education to avoid cross-border compliance gaps.
- Parallel rule sets: UK vs EU
- Key dates: Brexit 2020, new rules 2021
- Regulatory lever: EU VAT e‑commerce package (Jul 2021)
Political stability and infrastructure investment
Political stability drives investment in logistics, broadband and postal networks that underpin cross-border delivery; ITU reported about 67% global internet penetration in 2023, supporting e-commerce growth (Statista estimates global retail e-commerce ~6.3 trillion USD in 2024). Instability raises disruption and currency-control risks; scenario planning, rerouting and carrier reallocation plus insurance and contingency inventory preserve service levels.
- Stable governance: higher infrastructure spend
- Instability: disruption, currency controls
- Mitigation: scenario planning, rerouting
- Resilience: insurance, contingency inventory
Regulatory shocks reshape cross-border e‑commerce: tariffs, DMA/DSA, VAT and customs risk
Political shifts—tariffs (US-China ~$360bn), sanctions, data localization and platform rules (EU DMA/DSA 2024) materially alter market access, costs and compliance for Global-e (200+ markets). Customs variability and VAT reforms (EU e‑commerce VAT Jul 2021; UK VAT 20%) drive landed-cost volatility; e‑commerce reached ~$6.3trn in 2024, enlarging opportunity but raising regulatory burden.
| Indicator | Value/Year |
|---|---|
| Markets served | 200+ |
| Global e‑commerce | $6.3trn (2024) |
| US‑China tariffs | ~$360bn |
| EU VAT reform | Jul 2021 |
What is included in the product
Detailed Word Document
Explores how macro-environmental factors uniquely affect Global-e across Political, Economic, Social, Technological, Environmental and Legal dimensions, with data-backed trends and actionable, forward-looking insights. Designed to support executives, investors and strategists in scenario planning and opportunity/risk mitigation.
Customizable Excel Spreadsheet
A concise, visually segmented Global‑e PESTLE summary that’s easily dropped into presentations, editable with contextual notes, and shareable across teams to streamline risk discussions, client reports, and strategic planning.
Economic factors
Consumer spending and macro cycles
Inflation (US CPI ~3.4% in 2024) and unemployment (US ~3.7% 2024) squeezed real wages, reducing discretionary online spend and extending purchase decision cycles. Downturns push shoppers to promotions and BNPL; Global-e can protect conversions by optimizing dynamic pricing, upfront duties/taxes display and localized financing. Category mix matters: essentials consistently outperformed discretionary during weak cycles, preserving AOV and repeat rates.
FX volatility and pricing
Currency swings alter perceived prices and squeeze merchant margins; BIS data shows global FX turnover at about $7.5 trillion/day (2022), underlining scale of exposure. Transparent, localized pricing with hedging options and real-time FX plus rounding logic reduces checkout shock and lifts conversion. In volatile corridors merchants commonly add margin buffers to protect profitability.
Logistics costs and capacity
Carrier base rates plus fuel surcharges—often 8–12% in 2024—plus peak-season uplifts (commonly 20–30%) materially raise total landed cost. Efficient carrier selection and label optimization can shave several percentage points off margins. Multi-node fulfillment and DDP reduce duty surprises and can lower return rates by ~15–25%. Performance SLAs should flex with seasonal capacity to avoid cost spikes.
Payment acceptance and authorization rates
Local tender availability and issuer behavior are primary drivers of approval; economic stress in 2023–24 correlated with higher fraud and chargebacks, squeezing authorization rates and margins. Offering wallets, BNPL and local alternatives materially expands reach, while intelligent retries and network tokenization have been shown to lift success rates by double digits in many merchant case studies.
- Local tenders & issuer rules
- Economic stress → higher fraud/chargebacks
- Wallets, BNPL, alt payments increase reach
- Intelligent retries & tokenization → double-digit approval gains
Market growth in cross-border e-commerce
Structural growth in cross-border e-commerce persists as merchants chase incremental demand abroad; cross-border now represents roughly 25% of global e-commerce and has been growing near a 10% CAGR through 2024. Penetration varies regionally, with mobile-led markets like Southeast Asia seeing >70% of online transactions on mobile, so Global-e can prioritize high-growth APAC–EU and US–APAC corridors and fast-growing categories such as beauty and apparel. Partnerships with marketplaces and logistics providers can accelerate merchant onboarding at scale, improving time-to-revenue and GMV conversion.
- 25%: share of cross-border in global e-commerce
- ~10% CAGR through 2024
- >70% mobile share in SEA
- Priority corridors: APAC–EU, US–APAC
Regulatory shocks reshape cross-border e‑commerce: tariffs, DMA/DSA, VAT and customs risk
Higher inflation and tight labor (US CPI ~3.4% 2024; unemployment ~3.7% 2024) cut real wages, shifting shoppers to promotions and BNPL and lengthening purchase cycles, pressuring AOV. FX volatility (FX turnover ~$7.5T/day) and carrier fuel/peak surcharges (8–12% / peak +20–30% 2024) raise landed costs and margin risk. Cross-border growth (~25% share; ~10% CAGR through 2024) keeps upside if pricing, localized payments and DDP are optimized.
| Metric | Value |
|---|---|
| US CPI 2024 | ~3.4% |
| US Unemployment 2024 | ~3.7% |
| FX turnover | ~$7.5T/day (2022) |
| Cross-border share | ~25% (10% CAGR) |
Preview Before You Purchase
Global-e PESTLE Analysis
This Global-e PESTLE Analysis preview is the exact, fully formatted document you’ll receive after purchase, with complete content, structure, and professional layout. No placeholders or teasers—what you see is the final file ready to download and use immediately.
Original: $10.00
-65%$10.00
$3.50Description
Plan Smarter. Present Sharper. Compete Stronger.
Gain strategic clarity with our PESTLE analysis of Global-e, revealing how political, economic and technological shifts shape cross-border e‑commerce. Ideal for investors, strategists and consultants, it translates macro trends into actionable risks and opportunities. Purchase the full report for the complete breakdown, editable charts and instant download.
Political factors
Geopolitical tensions and trade policy
Shifts in trade relations, sanctions and export controls—for example US-China tariffs covering roughly $360bn of goods—can immediately block merchant access to markets and specific SKUs. Tariff changes and customs duties raise landed costs and consumer prices, reducing conversion rates. Global-e, which serves merchants in over 200 markets, must dynamically adapt routing and compliance rules. Diversification across regions mitigates single-market shocks.
Customs and border administration
Variability in customs efficiency and rules across 200+ markets materially affects delivery SLAs and landed costs, driving longer transit times and higher exception fees. Political reforms can either streamline clearance or introduce new paperwork and delays. Global-e’s pre-calculation of duties and taxes must track frequent tariff and policy updates to remain accurate. Proactive communication reduces consumer disputes and cart abandonment, with unexpected costs cited by ~49% of shoppers as a top reason for checkout abandonment.
Government digital agendas
National pushes toward digital commerce expand Global-e’s addressable market—global e-commerce reached about $5.7 trillion in 2022, with continued growth into 2024. Conversely, new platform and data localization rules, including the EU Digital Markets and Services Acts effective 2024, add compliance and operational complexity. Aligning to local payment rails and government ID programs improves authorization and policy monitoring informs market-entry sequencing.
Brexit and regional integration dynamics
Brexit (UK exit finalized Jan 31 2020; new trade rules from Jan 1 2021) created divergent VAT and customs regimes as the UK left the EU Customs Union; the UK standard VAT rate remains 20% and the EU implemented the VAT e-commerce package on July 1, 2021. Global-e must maintain parallel rule sets, documentation templates and proactive merchant education to avoid cross-border compliance gaps.
- Parallel rule sets: UK vs EU
- Key dates: Brexit 2020, new rules 2021
- Regulatory lever: EU VAT e‑commerce package (Jul 2021)
Political stability and infrastructure investment
Political stability drives investment in logistics, broadband and postal networks that underpin cross-border delivery; ITU reported about 67% global internet penetration in 2023, supporting e-commerce growth (Statista estimates global retail e-commerce ~6.3 trillion USD in 2024). Instability raises disruption and currency-control risks; scenario planning, rerouting and carrier reallocation plus insurance and contingency inventory preserve service levels.
- Stable governance: higher infrastructure spend
- Instability: disruption, currency controls
- Mitigation: scenario planning, rerouting
- Resilience: insurance, contingency inventory
Regulatory shocks reshape cross-border e‑commerce: tariffs, DMA/DSA, VAT and customs risk
Political shifts—tariffs (US-China ~$360bn), sanctions, data localization and platform rules (EU DMA/DSA 2024) materially alter market access, costs and compliance for Global-e (200+ markets). Customs variability and VAT reforms (EU e‑commerce VAT Jul 2021; UK VAT 20%) drive landed-cost volatility; e‑commerce reached ~$6.3trn in 2024, enlarging opportunity but raising regulatory burden.
| Indicator | Value/Year |
|---|---|
| Markets served | 200+ |
| Global e‑commerce | $6.3trn (2024) |
| US‑China tariffs | ~$360bn |
| EU VAT reform | Jul 2021 |
What is included in the product
Detailed Word Document
Explores how macro-environmental factors uniquely affect Global-e across Political, Economic, Social, Technological, Environmental and Legal dimensions, with data-backed trends and actionable, forward-looking insights. Designed to support executives, investors and strategists in scenario planning and opportunity/risk mitigation.
Customizable Excel Spreadsheet
A concise, visually segmented Global‑e PESTLE summary that’s easily dropped into presentations, editable with contextual notes, and shareable across teams to streamline risk discussions, client reports, and strategic planning.
Economic factors
Consumer spending and macro cycles
Inflation (US CPI ~3.4% in 2024) and unemployment (US ~3.7% 2024) squeezed real wages, reducing discretionary online spend and extending purchase decision cycles. Downturns push shoppers to promotions and BNPL; Global-e can protect conversions by optimizing dynamic pricing, upfront duties/taxes display and localized financing. Category mix matters: essentials consistently outperformed discretionary during weak cycles, preserving AOV and repeat rates.
FX volatility and pricing
Currency swings alter perceived prices and squeeze merchant margins; BIS data shows global FX turnover at about $7.5 trillion/day (2022), underlining scale of exposure. Transparent, localized pricing with hedging options and real-time FX plus rounding logic reduces checkout shock and lifts conversion. In volatile corridors merchants commonly add margin buffers to protect profitability.
Logistics costs and capacity
Carrier base rates plus fuel surcharges—often 8–12% in 2024—plus peak-season uplifts (commonly 20–30%) materially raise total landed cost. Efficient carrier selection and label optimization can shave several percentage points off margins. Multi-node fulfillment and DDP reduce duty surprises and can lower return rates by ~15–25%. Performance SLAs should flex with seasonal capacity to avoid cost spikes.
Payment acceptance and authorization rates
Local tender availability and issuer behavior are primary drivers of approval; economic stress in 2023–24 correlated with higher fraud and chargebacks, squeezing authorization rates and margins. Offering wallets, BNPL and local alternatives materially expands reach, while intelligent retries and network tokenization have been shown to lift success rates by double digits in many merchant case studies.
- Local tenders & issuer rules
- Economic stress → higher fraud/chargebacks
- Wallets, BNPL, alt payments increase reach
- Intelligent retries & tokenization → double-digit approval gains
Market growth in cross-border e-commerce
Structural growth in cross-border e-commerce persists as merchants chase incremental demand abroad; cross-border now represents roughly 25% of global e-commerce and has been growing near a 10% CAGR through 2024. Penetration varies regionally, with mobile-led markets like Southeast Asia seeing >70% of online transactions on mobile, so Global-e can prioritize high-growth APAC–EU and US–APAC corridors and fast-growing categories such as beauty and apparel. Partnerships with marketplaces and logistics providers can accelerate merchant onboarding at scale, improving time-to-revenue and GMV conversion.
- 25%: share of cross-border in global e-commerce
- ~10% CAGR through 2024
- >70% mobile share in SEA
- Priority corridors: APAC–EU, US–APAC
Regulatory shocks reshape cross-border e‑commerce: tariffs, DMA/DSA, VAT and customs risk
Higher inflation and tight labor (US CPI ~3.4% 2024; unemployment ~3.7% 2024) cut real wages, shifting shoppers to promotions and BNPL and lengthening purchase cycles, pressuring AOV. FX volatility (FX turnover ~$7.5T/day) and carrier fuel/peak surcharges (8–12% / peak +20–30% 2024) raise landed costs and margin risk. Cross-border growth (~25% share; ~10% CAGR through 2024) keeps upside if pricing, localized payments and DDP are optimized.
| Metric | Value |
|---|---|
| US CPI 2024 | ~3.4% |
| US Unemployment 2024 | ~3.7% |
| FX turnover | ~$7.5T/day (2022) |
| Cross-border share | ~25% (10% CAGR) |
Preview Before You Purchase
Global-e PESTLE Analysis
This Global-e PESTLE Analysis preview is the exact, fully formatted document you’ll receive after purchase, with complete content, structure, and professional layout. No placeholders or teasers—what you see is the final file ready to download and use immediately.











