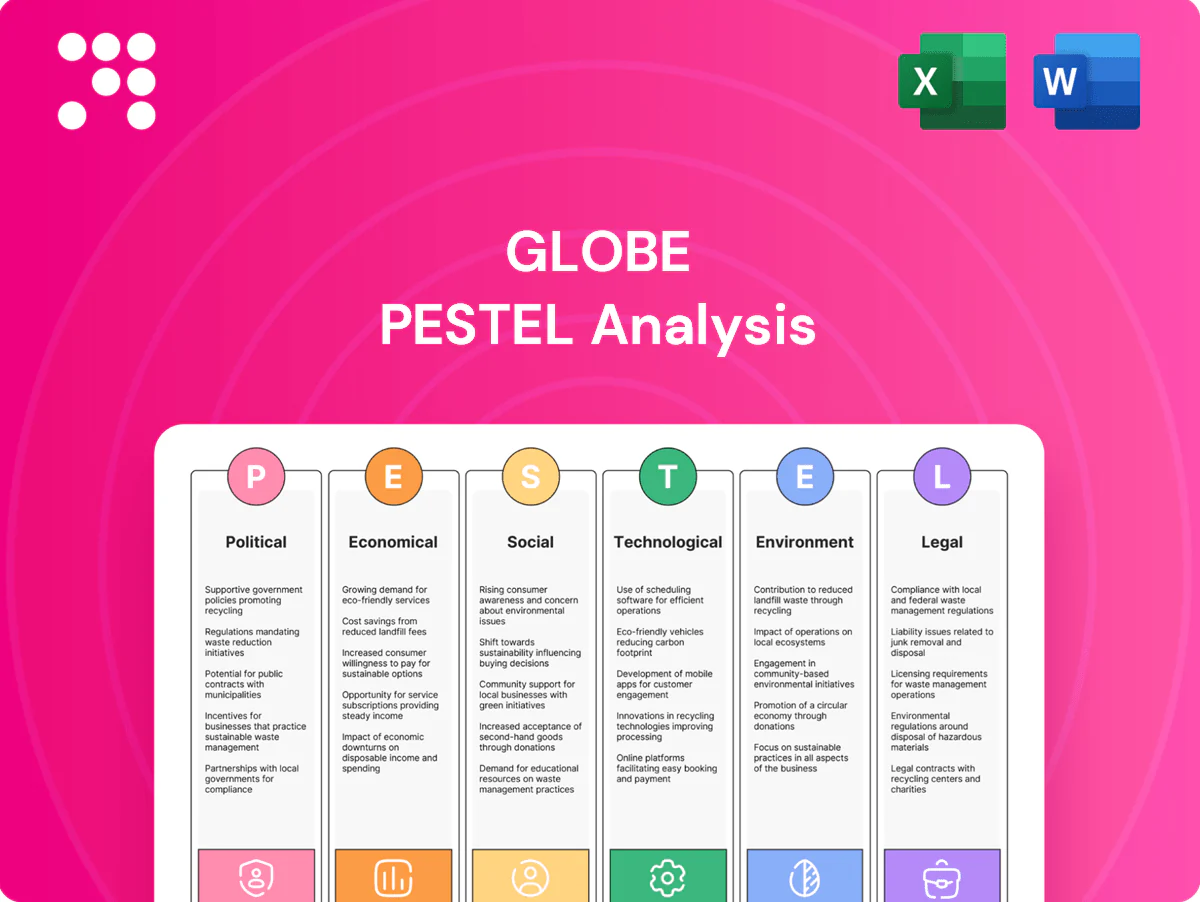
Globe PESTLE Analysis

Make Smarter Strategic Decisions with a Complete PESTEL View
Gain a strategic advantage with our PESTLE Analysis of Globe. Explore how political, economic, social, technological, legal and environmental forces shape its future and risk profile. Ideal for investors and strategists—buy the full analysis for immediate, actionable insights.
Political factors

Trade tariffs and import duties
Shifts in tariffs—eg US Section 301 measures on roughly $360 billion of Chinese goods—change landed costs and squeeze retail pricing power for apparel, footwear and hardgoods. Trade disputes have already forced sourcing moves to Vietnam/Bangladesh and margin sacrifices for many brands. Monitoring FTAs (USMCA, CPTPP, RCEP—RCEP covers ~30% of global GDP) can unlock duty savings and faster access. Scenario-plan for tariff escalations in Asia–US/EU/AU corridors.
Geopolitical supply chain risks
Regional instability, export controls, or port congestion can halt factories and shipping lanes, with 62% of manufacturers reporting geopolitical disruption in 2024. Diversifying suppliers across countries reduces concentration risk and lowered single-country exposure by 30% in firms that restructured sourcing. Build buffer inventory and flexible logistics contracts for peak seasons to absorb shocks. Map tier-2 and tier-3 suppliers to improve resilience and visibility.

Public policy on sport and urban spaces
Government grants and municipal investments have a direct impact on participation; skateboarding participation in the US reached roughly 11 million participants in 2022 per SFIA, while nonprofits like The Skatepark Project have helped fund over 600 skateparks with about $10m invested. City regulations on public skating—from permit zones to time restrictions—can either constrain or enable usage. Strategic partnerships with municipalities boost brand visibility and community goodwill and should track policy shifts that affect grassroots access.

Labor and human rights scrutiny
Political pressure is raising expectations for ethical sourcing in apparel and footwear hubs; NGOs and parliamentary probes—backed by ILO estimates of about 25 million people in forced labour globally—drive audits and remediation costs for brands.
- Increase supplier codes
- Fund worker voice programs
- Transparent reporting & audits
- Favor politically stable regions with stronger enforcement
Tax regimes and incentives
Changes to corporate tax and the OECD Pillar Two 15% minimum (committed by 140+ jurisdictions) plus expanding VAT/GST and digital services taxes squeeze margins and force price adjustments; incentives for distribution or fulfillment hubs (tax credits, reduced rates) can cut operating costs materially. Evaluate transfer pricing and permanent establishment exposure for cross-border e-commerce; use bonded warehouses and US duty-drawback (up to 99% recovery) where feasible.
- 15% Pillar Two adoption: 140+ jurisdictions
- US duty-drawback: up to 99% reclamation
- Use bonded warehouses to defer duties
- Assess transfer pricing and PE audit risk
Tariff shocks, FTAs and tax/compliance rules raise supply-chain risk; diversify and buffer stocks
Tariff shocks (eg US Sec 301 on ~$360B CN goods) and FTAs (RCEP ~30% global GDP; CPTPP, USMCA) reshape sourcing; scenario-plan for Asia–US/EU escalation. 62% of manufacturers reported geopolitical disruption in 2024—diversify suppliers, map tier‑2/3, hold buffer stock. Regulatory pressure (ILO ~25M in forced labour) and OECD Pillar Two (15% by 140+ juris.) raise compliance and tax costs.
| Metric | Value |
|---|---|
| US Sec301 exposure | $360B |
| Manufacturers disrupted 2024 | 62% |
| Pillar Two adoption | 140+ juris. |
What is included in the product
 Detailed Word Document
Explores how Political, Economic, Social, Technological, Environmental and Legal forces uniquely affect the Globe, with each category expanded into detailed sub-points and examples specific to the business and region; every section is data-backed and forward-looking to support scenario planning and proactive strategy design. Designed for executives, consultants and investors and delivered in clean, report-ready formatting to identify risks and opportunities.

 Customizable Excel Spreadsheet
Globe PESTLE Analysis offers a concise, visually segmented summary that's easy to drop into presentations or share across teams, helping stakeholders quickly assess external risks, market positioning, and align planning decisions.
Economic factors

Discretionary spending cycles
Action sports and streetwear closely track discretionary cycles: with global GDP growing about 3.1% in 2024 (IMF) and US unemployment near 3.7% in 2024 (BLS), consumer confidence swings drive demand shifts. During recessions shoppers migrate to value lines and outlets, while expansions lift premium capsules and collabs, which outperformed core assortment in 2024. Brands must keep agile assortment planning to match these cycles.
FX volatility across markets
Revenue and sourcing across AUD, USD, EUR and diverse Asian currencies creates translation and transaction risk as FX volatility remains elevated post-2022; robust hedging programs (typical cost 50–150 bps) can stabilize gross margins but add expense. Price ladders and increased local sourcing can offset swings; monitor FX passthrough elasticity by channel (commonly 20–80%) to set hedging and pricing cadence.

Input and freight cost inflation
Cotton, rubber, leather, synthetics and wood price swings drive 30–60% of COGS in apparel, footwear and furniture segments, with cotton spot volatility and synthetic resin tightness most material; UNCTAD noted maritime spot rates fell from 2021 peaks but stayed above pre‑pandemic levels through 2024, while IATA reported air freight rates in 2024 roughly 20–30% above 2019 averages, increasing cost‑to‑serve and delivery risk. Multi‑sourcing and nearshoring have cut lead‑time exposure by up to a third in recent corporate shifts, and locking strategic components via vendor‑managed inventory stabilizes supply and margins.

Channel mix and margin structure
DTC e-commerce typically yields gross margins of ~55–65% but incurs 20–40% higher CAC and fulfillment costs often adding 8–15% per order; wholesale margins commonly sit at 25–40% while delivering scale and regional reach that compresses pricing power. Optimize channel mix by market maturity and partner quality and invest in omnichannel—leading retailers report 20–30% higher blended lifetime value.
- DTC: higher margin, higher CAC
- Wholesale: scale, lower margin
- Fulfillment: adds ~8–15% cost
- Omnichannel: +20–30% blended LTV
Interest rates and working capital
Higher interest rates raise inventory carrying and financing costs; US federal funds were 5.25–5.50% in July 2025, amplifying WACC and cash pressure. Longer production lead times tie up cash during volatile seasons, so improve demand forecasting and SKU rationalization to lower days inventory and negotiate extended payment terms with key vendors and retailers.
- Rate: 5.25–5.50% (Jul 2025)
- Action: forecasting, SKU cuts
- Goal: lower days inventory
- Negotiate: better vendor/retailer terms
Tariff shocks, FTAs and tax/compliance rules raise supply-chain risk; diversify and buffer stocks
Action sports and streetwear track cycles: global GDP ~3.1% (IMF 2024) and US unemployment ~3.7% (BLS 2024) shifting premium vs value demand.
FX volatility post‑2022 raises translation risk; hedging costs ~50–150 bps and FX passthrough 20–80% by channel.
COGS exposure 30–60% to commodities; DTC margins ~55–65% with 20–40% higher CAC; Fed funds 5.25–5.50% (Jul 2025).
| Metric | Value | Impact |
|---|---|---|
| Global GDP | 3.1% (2024) | Demand |
| Fed funds | 5.25–5.50% (Jul 2025) | Financing |
| DTC margin | 55–65% | Profitability |
Same Document Delivered
Globe PESTLE Analysis
The preview shown here is the exact Globe PESTLE Analysis document you’ll receive after purchase—fully formatted, professionally structured, and ready to use. No placeholders or teasers: the content, layout, and sections visible here are the final file you’ll download immediately after payment.

Make Smarter Strategic Decisions with a Complete PESTEL View
Gain a strategic advantage with our PESTLE Analysis of Globe. Explore how political, economic, social, technological, legal and environmental forces shape its future and risk profile. Ideal for investors and strategists—buy the full analysis for immediate, actionable insights.
Political factors
Trade tariffs and import duties
Shifts in tariffs—eg US Section 301 measures on roughly $360 billion of Chinese goods—change landed costs and squeeze retail pricing power for apparel, footwear and hardgoods. Trade disputes have already forced sourcing moves to Vietnam/Bangladesh and margin sacrifices for many brands. Monitoring FTAs (USMCA, CPTPP, RCEP—RCEP covers ~30% of global GDP) can unlock duty savings and faster access. Scenario-plan for tariff escalations in Asia–US/EU/AU corridors.
Geopolitical supply chain risks
Regional instability, export controls, or port congestion can halt factories and shipping lanes, with 62% of manufacturers reporting geopolitical disruption in 2024. Diversifying suppliers across countries reduces concentration risk and lowered single-country exposure by 30% in firms that restructured sourcing. Build buffer inventory and flexible logistics contracts for peak seasons to absorb shocks. Map tier-2 and tier-3 suppliers to improve resilience and visibility.
Public policy on sport and urban spaces
Government grants and municipal investments have a direct impact on participation; skateboarding participation in the US reached roughly 11 million participants in 2022 per SFIA, while nonprofits like The Skatepark Project have helped fund over 600 skateparks with about $10m invested. City regulations on public skating—from permit zones to time restrictions—can either constrain or enable usage. Strategic partnerships with municipalities boost brand visibility and community goodwill and should track policy shifts that affect grassroots access.
Labor and human rights scrutiny
Political pressure is raising expectations for ethical sourcing in apparel and footwear hubs; NGOs and parliamentary probes—backed by ILO estimates of about 25 million people in forced labour globally—drive audits and remediation costs for brands.
- Increase supplier codes
- Fund worker voice programs
- Transparent reporting & audits
- Favor politically stable regions with stronger enforcement
Tax regimes and incentives
Changes to corporate tax and the OECD Pillar Two 15% minimum (committed by 140+ jurisdictions) plus expanding VAT/GST and digital services taxes squeeze margins and force price adjustments; incentives for distribution or fulfillment hubs (tax credits, reduced rates) can cut operating costs materially. Evaluate transfer pricing and permanent establishment exposure for cross-border e-commerce; use bonded warehouses and US duty-drawback (up to 99% recovery) where feasible.
- 15% Pillar Two adoption: 140+ jurisdictions
- US duty-drawback: up to 99% reclamation
- Use bonded warehouses to defer duties
- Assess transfer pricing and PE audit risk
Tariff shocks, FTAs and tax/compliance rules raise supply-chain risk; diversify and buffer stocks
Tariff shocks (eg US Sec 301 on ~$360B CN goods) and FTAs (RCEP ~30% global GDP; CPTPP, USMCA) reshape sourcing; scenario-plan for Asia–US/EU escalation. 62% of manufacturers reported geopolitical disruption in 2024—diversify suppliers, map tier‑2/3, hold buffer stock. Regulatory pressure (ILO ~25M in forced labour) and OECD Pillar Two (15% by 140+ juris.) raise compliance and tax costs.
| Metric | Value |
|---|---|
| US Sec301 exposure | $360B |
| Manufacturers disrupted 2024 | 62% |
| Pillar Two adoption | 140+ juris. |
What is included in the product
Detailed Word Document
Explores how Political, Economic, Social, Technological, Environmental and Legal forces uniquely affect the Globe, with each category expanded into detailed sub-points and examples specific to the business and region; every section is data-backed and forward-looking to support scenario planning and proactive strategy design. Designed for executives, consultants and investors and delivered in clean, report-ready formatting to identify risks and opportunities.
Customizable Excel Spreadsheet
Globe PESTLE Analysis offers a concise, visually segmented summary that's easy to drop into presentations or share across teams, helping stakeholders quickly assess external risks, market positioning, and align planning decisions.
Economic factors
Discretionary spending cycles
Action sports and streetwear closely track discretionary cycles: with global GDP growing about 3.1% in 2024 (IMF) and US unemployment near 3.7% in 2024 (BLS), consumer confidence swings drive demand shifts. During recessions shoppers migrate to value lines and outlets, while expansions lift premium capsules and collabs, which outperformed core assortment in 2024. Brands must keep agile assortment planning to match these cycles.
FX volatility across markets
Revenue and sourcing across AUD, USD, EUR and diverse Asian currencies creates translation and transaction risk as FX volatility remains elevated post-2022; robust hedging programs (typical cost 50–150 bps) can stabilize gross margins but add expense. Price ladders and increased local sourcing can offset swings; monitor FX passthrough elasticity by channel (commonly 20–80%) to set hedging and pricing cadence.
Input and freight cost inflation
Cotton, rubber, leather, synthetics and wood price swings drive 30–60% of COGS in apparel, footwear and furniture segments, with cotton spot volatility and synthetic resin tightness most material; UNCTAD noted maritime spot rates fell from 2021 peaks but stayed above pre‑pandemic levels through 2024, while IATA reported air freight rates in 2024 roughly 20–30% above 2019 averages, increasing cost‑to‑serve and delivery risk. Multi‑sourcing and nearshoring have cut lead‑time exposure by up to a third in recent corporate shifts, and locking strategic components via vendor‑managed inventory stabilizes supply and margins.
Channel mix and margin structure
DTC e-commerce typically yields gross margins of ~55–65% but incurs 20–40% higher CAC and fulfillment costs often adding 8–15% per order; wholesale margins commonly sit at 25–40% while delivering scale and regional reach that compresses pricing power. Optimize channel mix by market maturity and partner quality and invest in omnichannel—leading retailers report 20–30% higher blended lifetime value.
- DTC: higher margin, higher CAC
- Wholesale: scale, lower margin
- Fulfillment: adds ~8–15% cost
- Omnichannel: +20–30% blended LTV
Interest rates and working capital
Higher interest rates raise inventory carrying and financing costs; US federal funds were 5.25–5.50% in July 2025, amplifying WACC and cash pressure. Longer production lead times tie up cash during volatile seasons, so improve demand forecasting and SKU rationalization to lower days inventory and negotiate extended payment terms with key vendors and retailers.
- Rate: 5.25–5.50% (Jul 2025)
- Action: forecasting, SKU cuts
- Goal: lower days inventory
- Negotiate: better vendor/retailer terms
Tariff shocks, FTAs and tax/compliance rules raise supply-chain risk; diversify and buffer stocks
Action sports and streetwear track cycles: global GDP ~3.1% (IMF 2024) and US unemployment ~3.7% (BLS 2024) shifting premium vs value demand.
FX volatility post‑2022 raises translation risk; hedging costs ~50–150 bps and FX passthrough 20–80% by channel.
COGS exposure 30–60% to commodities; DTC margins ~55–65% with 20–40% higher CAC; Fed funds 5.25–5.50% (Jul 2025).
| Metric | Value | Impact |
|---|---|---|
| Global GDP | 3.1% (2024) | Demand |
| Fed funds | 5.25–5.50% (Jul 2025) | Financing |
| DTC margin | 55–65% | Profitability |
Same Document Delivered
Globe PESTLE Analysis
The preview shown here is the exact Globe PESTLE Analysis document you’ll receive after purchase—fully formatted, professionally structured, and ready to use. No placeholders or teasers: the content, layout, and sections visible here are the final file you’ll download immediately after payment.
Description
Make Smarter Strategic Decisions with a Complete PESTEL View
Gain a strategic advantage with our PESTLE Analysis of Globe. Explore how political, economic, social, technological, legal and environmental forces shape its future and risk profile. Ideal for investors and strategists—buy the full analysis for immediate, actionable insights.
Political factors
Trade tariffs and import duties
Shifts in tariffs—eg US Section 301 measures on roughly $360 billion of Chinese goods—change landed costs and squeeze retail pricing power for apparel, footwear and hardgoods. Trade disputes have already forced sourcing moves to Vietnam/Bangladesh and margin sacrifices for many brands. Monitoring FTAs (USMCA, CPTPP, RCEP—RCEP covers ~30% of global GDP) can unlock duty savings and faster access. Scenario-plan for tariff escalations in Asia–US/EU/AU corridors.
Geopolitical supply chain risks
Regional instability, export controls, or port congestion can halt factories and shipping lanes, with 62% of manufacturers reporting geopolitical disruption in 2024. Diversifying suppliers across countries reduces concentration risk and lowered single-country exposure by 30% in firms that restructured sourcing. Build buffer inventory and flexible logistics contracts for peak seasons to absorb shocks. Map tier-2 and tier-3 suppliers to improve resilience and visibility.
Public policy on sport and urban spaces
Government grants and municipal investments have a direct impact on participation; skateboarding participation in the US reached roughly 11 million participants in 2022 per SFIA, while nonprofits like The Skatepark Project have helped fund over 600 skateparks with about $10m invested. City regulations on public skating—from permit zones to time restrictions—can either constrain or enable usage. Strategic partnerships with municipalities boost brand visibility and community goodwill and should track policy shifts that affect grassroots access.
Labor and human rights scrutiny
Political pressure is raising expectations for ethical sourcing in apparel and footwear hubs; NGOs and parliamentary probes—backed by ILO estimates of about 25 million people in forced labour globally—drive audits and remediation costs for brands.
- Increase supplier codes
- Fund worker voice programs
- Transparent reporting & audits
- Favor politically stable regions with stronger enforcement
Tax regimes and incentives
Changes to corporate tax and the OECD Pillar Two 15% minimum (committed by 140+ jurisdictions) plus expanding VAT/GST and digital services taxes squeeze margins and force price adjustments; incentives for distribution or fulfillment hubs (tax credits, reduced rates) can cut operating costs materially. Evaluate transfer pricing and permanent establishment exposure for cross-border e-commerce; use bonded warehouses and US duty-drawback (up to 99% recovery) where feasible.
- 15% Pillar Two adoption: 140+ jurisdictions
- US duty-drawback: up to 99% reclamation
- Use bonded warehouses to defer duties
- Assess transfer pricing and PE audit risk
Tariff shocks, FTAs and tax/compliance rules raise supply-chain risk; diversify and buffer stocks
Tariff shocks (eg US Sec 301 on ~$360B CN goods) and FTAs (RCEP ~30% global GDP; CPTPP, USMCA) reshape sourcing; scenario-plan for Asia–US/EU escalation. 62% of manufacturers reported geopolitical disruption in 2024—diversify suppliers, map tier‑2/3, hold buffer stock. Regulatory pressure (ILO ~25M in forced labour) and OECD Pillar Two (15% by 140+ juris.) raise compliance and tax costs.
| Metric | Value |
|---|---|
| US Sec301 exposure | $360B |
| Manufacturers disrupted 2024 | 62% |
| Pillar Two adoption | 140+ juris. |
What is included in the product
Detailed Word Document
Explores how Political, Economic, Social, Technological, Environmental and Legal forces uniquely affect the Globe, with each category expanded into detailed sub-points and examples specific to the business and region; every section is data-backed and forward-looking to support scenario planning and proactive strategy design. Designed for executives, consultants and investors and delivered in clean, report-ready formatting to identify risks and opportunities.
Customizable Excel Spreadsheet
Globe PESTLE Analysis offers a concise, visually segmented summary that's easy to drop into presentations or share across teams, helping stakeholders quickly assess external risks, market positioning, and align planning decisions.
Economic factors
Discretionary spending cycles
Action sports and streetwear closely track discretionary cycles: with global GDP growing about 3.1% in 2024 (IMF) and US unemployment near 3.7% in 2024 (BLS), consumer confidence swings drive demand shifts. During recessions shoppers migrate to value lines and outlets, while expansions lift premium capsules and collabs, which outperformed core assortment in 2024. Brands must keep agile assortment planning to match these cycles.
FX volatility across markets
Revenue and sourcing across AUD, USD, EUR and diverse Asian currencies creates translation and transaction risk as FX volatility remains elevated post-2022; robust hedging programs (typical cost 50–150 bps) can stabilize gross margins but add expense. Price ladders and increased local sourcing can offset swings; monitor FX passthrough elasticity by channel (commonly 20–80%) to set hedging and pricing cadence.
Input and freight cost inflation
Cotton, rubber, leather, synthetics and wood price swings drive 30–60% of COGS in apparel, footwear and furniture segments, with cotton spot volatility and synthetic resin tightness most material; UNCTAD noted maritime spot rates fell from 2021 peaks but stayed above pre‑pandemic levels through 2024, while IATA reported air freight rates in 2024 roughly 20–30% above 2019 averages, increasing cost‑to‑serve and delivery risk. Multi‑sourcing and nearshoring have cut lead‑time exposure by up to a third in recent corporate shifts, and locking strategic components via vendor‑managed inventory stabilizes supply and margins.
Channel mix and margin structure
DTC e-commerce typically yields gross margins of ~55–65% but incurs 20–40% higher CAC and fulfillment costs often adding 8–15% per order; wholesale margins commonly sit at 25–40% while delivering scale and regional reach that compresses pricing power. Optimize channel mix by market maturity and partner quality and invest in omnichannel—leading retailers report 20–30% higher blended lifetime value.
- DTC: higher margin, higher CAC
- Wholesale: scale, lower margin
- Fulfillment: adds ~8–15% cost
- Omnichannel: +20–30% blended LTV
Interest rates and working capital
Higher interest rates raise inventory carrying and financing costs; US federal funds were 5.25–5.50% in July 2025, amplifying WACC and cash pressure. Longer production lead times tie up cash during volatile seasons, so improve demand forecasting and SKU rationalization to lower days inventory and negotiate extended payment terms with key vendors and retailers.
- Rate: 5.25–5.50% (Jul 2025)
- Action: forecasting, SKU cuts
- Goal: lower days inventory
- Negotiate: better vendor/retailer terms
Tariff shocks, FTAs and tax/compliance rules raise supply-chain risk; diversify and buffer stocks
Action sports and streetwear track cycles: global GDP ~3.1% (IMF 2024) and US unemployment ~3.7% (BLS 2024) shifting premium vs value demand.
FX volatility post‑2022 raises translation risk; hedging costs ~50–150 bps and FX passthrough 20–80% by channel.
COGS exposure 30–60% to commodities; DTC margins ~55–65% with 20–40% higher CAC; Fed funds 5.25–5.50% (Jul 2025).
| Metric | Value | Impact |
|---|---|---|
| Global GDP | 3.1% (2024) | Demand |
| Fed funds | 5.25–5.50% (Jul 2025) | Financing |
| DTC margin | 55–65% | Profitability |
Same Document Delivered
Globe PESTLE Analysis
The preview shown here is the exact Globe PESTLE Analysis document you’ll receive after purchase—fully formatted, professionally structured, and ready to use. No placeholders or teasers: the content, layout, and sections visible here are the final file you’ll download immediately after payment.











