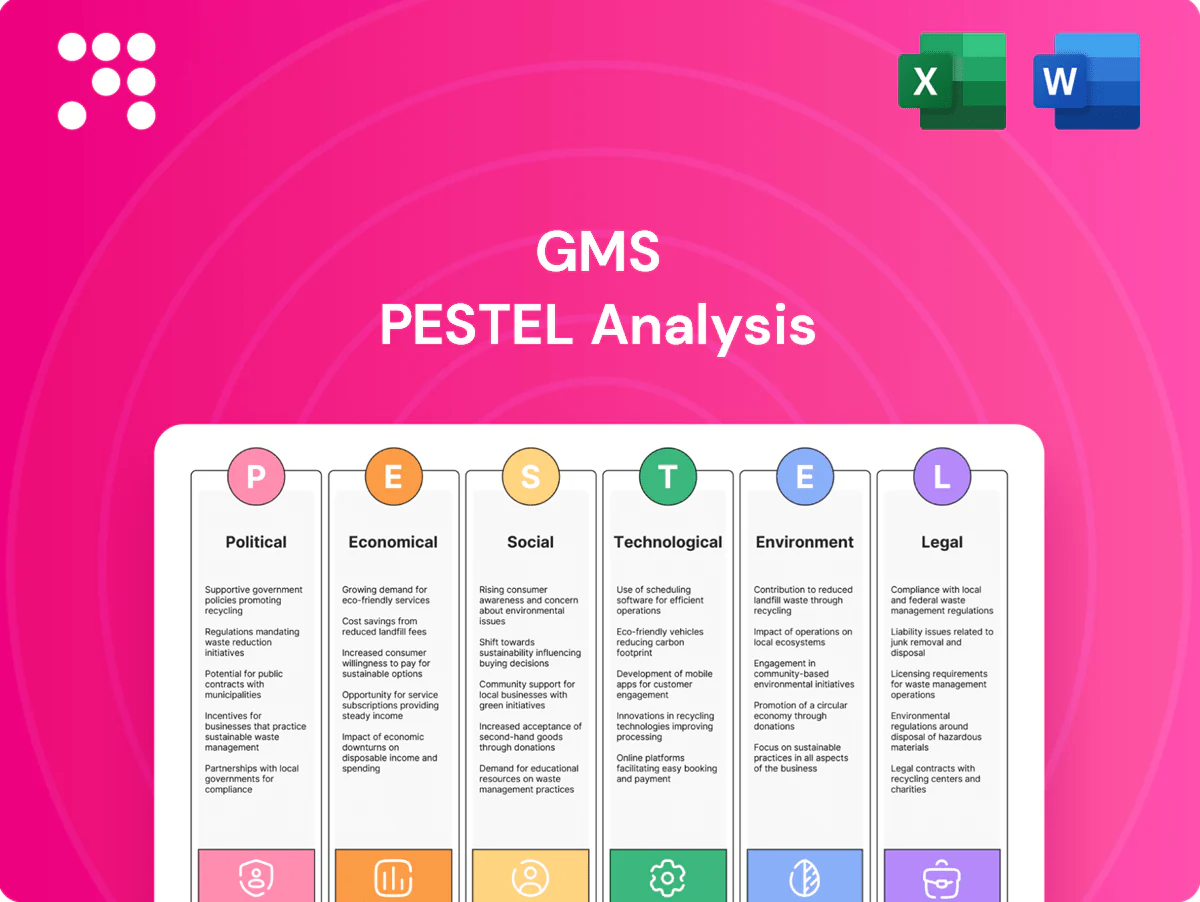
GMS PESTLE Analysis

Skip the Research. Get the Strategy.
Gain a strategic edge with our PESTLE Analysis tailored to GMS—three to five external forces distilled into clear implications for growth and risk. This concise briefing reveals the political, economic, social, technological, legal and environmental drivers shaping GMS today. Purchase the full report to access the complete, actionable breakdown and ready-to-use slides for immediate decision-making.
Political factors

Infrastructure and housing policy
GMS demand is highly sensitive to federal and state infrastructure and housing initiatives; the Bipartisan Infrastructure Law provides roughly $550 billion of new spending that can boost public construction and wallboard/ceiling volumes. Cuts or delays compress backlog visibility and order flow. Monitoring annual appropriations and the municipal bond market—about $4.2 trillion outstanding in 2024—is critical for demand forecasting and cash-flow timing.
Trade policy on steel and aluminum
Trade measures like the US Section 232 tariffs (25% on steel, 10% on aluminum) and ongoing anti-dumping duties raise steel framing input costs and constrain availability. Price volatility forces distributors to compress margins or pass costs quickly to customers, squeezing working capital. Diversifying sources and mills reduces concentration risk. Policy shifts can swiftly change competitiveness of imports versus domestic supply.

“Buy American” and domestic content rules
Build America, Buy America provisions in the $1.2 trillion Infrastructure Investment and Jobs Act and domestic-content incentives in the Inflation Reduction Act (≈$369 billion for energy/climate) mean public projects may require domestically produced materials, favoring certain suppliers in GMS’s network but narrowing choice and raising procurement costs. Compliance documentation and origin certifications increase administrative burden, and winning government contracts often hinges on timely proof of origin.

State and local permitting and codes
Jurisdictional differences in building codes—model codes update on a three-year cycle—drive product mix decisions, e.g., demand for fire-rated assemblies in jurisdictions that adopt stricter fire-resistance requirements. Political shifts can speed or delay local adoption, changing lead times and margin profiles for distributors. Active advocacy helps shape local specifications and procurement rules.
- code cycle: 3-year model updates
- local adoption lag: commonly 1–5 years
- inventory alignment: region-specific SKUs required
- advocacy: influences spec language and market access
Labor and immigration policy
Contractor labor supply is constrained by visa caps (H-2B cap 66,000), expanding E-Verify mandates across 26 states and increased enforcement, tightening available skilled crews. Tight labor markets cut jobsite throughput and material turns; construction wages rose about 5% in 2024, squeezing installation demand and extending timelines. Stability in immigration and enforcement supports predictable ordering patterns and procurement planning.
- H-2B cap: 66,000
- E-Verify mandates: 26 states
- Construction wage growth ~5% (2024)
GMS demand tied to IIJA, $4.2T muni market; tariffs lift framing costs
GMS demand tied to federal/state infrastructure; Bipartisan Infrastructure Law ~$550B; municipal bond market ~$4.2T (2024) affects funding timing.
US tariffs (steel 25%, aluminum 10%) and anti-dumping duties raise framing costs; tariffs and IRA/IIJA domestic-content rules (IIJA ~$1.2T; IRA ~$369B) constrain sourcing.
Model building codes update every 3 years; local adoption lag 1–5 years alters SKU mix and margins.
Labor limits: H-2B cap 66,000; E-Verify 26 states; construction wages +~5% (2024).
| Metric | Value |
|---|---|
| IIJA | $550B |
| Municipal debt | $4.2T (2024) |
| Tariffs | Steel 25%/Al 10% |
| H-2B cap | 66,000 |
What is included in the product
 Detailed Word Document
Explores how external macro-environmental factors uniquely affect the GMS across six dimensions—Political, Economic, Social, Technological, Environmental, and Legal—backed by current data and trends to identify threats, opportunities, and strategic implications; delivered in clean, report-ready format with forward-looking insights for executives, consultants, and investors.

 Customizable Excel Spreadsheet
GMS PESTLE delivers a concise, visually segmented summary of external risks and opportunities for quick reference in meetings or presentations. It’s easily editable and shareable, helping teams align strategy and decision-making without wading through full reports.
Economic factors

Construction cycle sensitivity
GMS volumes closely track housing starts, renovations and commercial build-outs; US housing starts averaged about 1.45 million units in 2024, tying directly to demand for construction materials and services.
Downturns compress discretionary projects and reduce unit turns, while multi-year backlogs provide partial cushioning but not full insulation against revenue declines.
Geographic diversification across regions smooths cycle volatility by spreading exposure to asynchronous local construction markets.
Interest rates and financing costs
Higher 30-year mortgage rates around 7.0% and commercial cap rates near 6.5–7.5% have damped residential and commercial starts; construction permits fell year‑over‑year in 2024–25. Working capital and inventory carrying costs rose as short-term borrowing increased ~150–200 bps, widening price pass-through windows as demand cools; modest rate cuts can quickly re‑accelerate volumes.

Input cost inflation and freight
Wallboard, steel and fuel volatility — with US diesel averaging about $4/gal in 2024 (EIA) and hot‑rolled coil near ~$900/ton in 2024 — compress GMS margins and necessitate dynamic pricing and freight surcharges to preserve spreads. Supplier rebates and scale procurement (rebates commonly 1–3% for large buyers) partially offset input swings. Diesel spikes and logistics tightness continue to increase lead times and degrade service levels.

Contractor health and credit risk
Small and mid-sized contractors are critical because small businesses represent 99.9% of US firms, so their cash-flow volatility directly affects GMS sales; when macro conditions tighten, credit stress reduces order volumes and raises bad-debt incidence. Rising borrowing costs and tighter lending standards since 2022 have amplified receivables risk, making rigorous credit controls and dynamic payment terms essential.
- High exposure: small firms ~majority of customer base
- Macro link: tighter credit → slower orders
- Risk: higher bad-debt probability
- Mitigation: strict credit policy and active terms management
Industry consolidation and scale
Industry roll-ups among distributors and dealers are shifting bargaining power to larger chains; GMS reported pro forma revenue near $5.8B in 2024 after acquisitions, strengthening supplier leverage. Scale enables better procurement pricing, higher IT spend and improved route density, cutting logistics unit costs. M&A opens geographies and categories, but integration risk must be managed to realize synergies.
- Roll-ups shift bargaining power
- Scale: procurement, IT, route density
- M&A: new geos/categories
- Integration risk threatens synergy capture
GMS demand tied to IIJA, $4.2T muni market; tariffs lift framing costs
GMS volumes track housing starts ~1.45M (2024) and fell with permits in 2024–25 as mortgage rates ~7.0% cooled demand.
Input volatility: HRC ≈$900/ton (2024) and diesel ≈$4/gal (2024) compress margins; rebates ~1–3% offset some pressure.
Pro forma revenue ≈$5.8B (2024); small contractors (99.9% US firms) raise receivables and credit risk amid tighter lending.
| Metric | 2024 | Impact |
|---|---|---|
| Housing starts | 1.45M | Drives demand |
| Mortgage rate | ~7.0% | Reduces starts |
| Diesel | $4/gal | Raises logistics cost |
| HRC | $900/ton | Compresses margins |
| GMS rev | $5.8B | Scale gains |
What You See Is What You Get
GMS PESTLE Analysis
The preview shown here is the exact GMS PESTLE Analysis document you’ll receive after purchase—fully formatted and ready to use. The layout, content, and structure visible are identical to the final file available for immediate download after checkout. No placeholders or teasers: this is the real, professionally structured analysis you’ll own.

Skip the Research. Get the Strategy.
Gain a strategic edge with our PESTLE Analysis tailored to GMS—three to five external forces distilled into clear implications for growth and risk. This concise briefing reveals the political, economic, social, technological, legal and environmental drivers shaping GMS today. Purchase the full report to access the complete, actionable breakdown and ready-to-use slides for immediate decision-making.
Political factors
Infrastructure and housing policy
GMS demand is highly sensitive to federal and state infrastructure and housing initiatives; the Bipartisan Infrastructure Law provides roughly $550 billion of new spending that can boost public construction and wallboard/ceiling volumes. Cuts or delays compress backlog visibility and order flow. Monitoring annual appropriations and the municipal bond market—about $4.2 trillion outstanding in 2024—is critical for demand forecasting and cash-flow timing.
Trade policy on steel and aluminum
Trade measures like the US Section 232 tariffs (25% on steel, 10% on aluminum) and ongoing anti-dumping duties raise steel framing input costs and constrain availability. Price volatility forces distributors to compress margins or pass costs quickly to customers, squeezing working capital. Diversifying sources and mills reduces concentration risk. Policy shifts can swiftly change competitiveness of imports versus domestic supply.
“Buy American” and domestic content rules
Build America, Buy America provisions in the $1.2 trillion Infrastructure Investment and Jobs Act and domestic-content incentives in the Inflation Reduction Act (≈$369 billion for energy/climate) mean public projects may require domestically produced materials, favoring certain suppliers in GMS’s network but narrowing choice and raising procurement costs. Compliance documentation and origin certifications increase administrative burden, and winning government contracts often hinges on timely proof of origin.
State and local permitting and codes
Jurisdictional differences in building codes—model codes update on a three-year cycle—drive product mix decisions, e.g., demand for fire-rated assemblies in jurisdictions that adopt stricter fire-resistance requirements. Political shifts can speed or delay local adoption, changing lead times and margin profiles for distributors. Active advocacy helps shape local specifications and procurement rules.
- code cycle: 3-year model updates
- local adoption lag: commonly 1–5 years
- inventory alignment: region-specific SKUs required
- advocacy: influences spec language and market access
Labor and immigration policy
Contractor labor supply is constrained by visa caps (H-2B cap 66,000), expanding E-Verify mandates across 26 states and increased enforcement, tightening available skilled crews. Tight labor markets cut jobsite throughput and material turns; construction wages rose about 5% in 2024, squeezing installation demand and extending timelines. Stability in immigration and enforcement supports predictable ordering patterns and procurement planning.
- H-2B cap: 66,000
- E-Verify mandates: 26 states
- Construction wage growth ~5% (2024)
GMS demand tied to IIJA, $4.2T muni market; tariffs lift framing costs
GMS demand tied to federal/state infrastructure; Bipartisan Infrastructure Law ~$550B; municipal bond market ~$4.2T (2024) affects funding timing.
US tariffs (steel 25%, aluminum 10%) and anti-dumping duties raise framing costs; tariffs and IRA/IIJA domestic-content rules (IIJA ~$1.2T; IRA ~$369B) constrain sourcing.
Model building codes update every 3 years; local adoption lag 1–5 years alters SKU mix and margins.
Labor limits: H-2B cap 66,000; E-Verify 26 states; construction wages +~5% (2024).
| Metric | Value |
|---|---|
| IIJA | $550B |
| Municipal debt | $4.2T (2024) |
| Tariffs | Steel 25%/Al 10% |
| H-2B cap | 66,000 |
What is included in the product
Detailed Word Document
Explores how external macro-environmental factors uniquely affect the GMS across six dimensions—Political, Economic, Social, Technological, Environmental, and Legal—backed by current data and trends to identify threats, opportunities, and strategic implications; delivered in clean, report-ready format with forward-looking insights for executives, consultants, and investors.
Customizable Excel Spreadsheet
GMS PESTLE delivers a concise, visually segmented summary of external risks and opportunities for quick reference in meetings or presentations. It’s easily editable and shareable, helping teams align strategy and decision-making without wading through full reports.
Economic factors
Construction cycle sensitivity
GMS volumes closely track housing starts, renovations and commercial build-outs; US housing starts averaged about 1.45 million units in 2024, tying directly to demand for construction materials and services.
Downturns compress discretionary projects and reduce unit turns, while multi-year backlogs provide partial cushioning but not full insulation against revenue declines.
Geographic diversification across regions smooths cycle volatility by spreading exposure to asynchronous local construction markets.
Interest rates and financing costs
Higher 30-year mortgage rates around 7.0% and commercial cap rates near 6.5–7.5% have damped residential and commercial starts; construction permits fell year‑over‑year in 2024–25. Working capital and inventory carrying costs rose as short-term borrowing increased ~150–200 bps, widening price pass-through windows as demand cools; modest rate cuts can quickly re‑accelerate volumes.
Input cost inflation and freight
Wallboard, steel and fuel volatility — with US diesel averaging about $4/gal in 2024 (EIA) and hot‑rolled coil near ~$900/ton in 2024 — compress GMS margins and necessitate dynamic pricing and freight surcharges to preserve spreads. Supplier rebates and scale procurement (rebates commonly 1–3% for large buyers) partially offset input swings. Diesel spikes and logistics tightness continue to increase lead times and degrade service levels.
Contractor health and credit risk
Small and mid-sized contractors are critical because small businesses represent 99.9% of US firms, so their cash-flow volatility directly affects GMS sales; when macro conditions tighten, credit stress reduces order volumes and raises bad-debt incidence. Rising borrowing costs and tighter lending standards since 2022 have amplified receivables risk, making rigorous credit controls and dynamic payment terms essential.
- High exposure: small firms ~majority of customer base
- Macro link: tighter credit → slower orders
- Risk: higher bad-debt probability
- Mitigation: strict credit policy and active terms management
Industry consolidation and scale
Industry roll-ups among distributors and dealers are shifting bargaining power to larger chains; GMS reported pro forma revenue near $5.8B in 2024 after acquisitions, strengthening supplier leverage. Scale enables better procurement pricing, higher IT spend and improved route density, cutting logistics unit costs. M&A opens geographies and categories, but integration risk must be managed to realize synergies.
- Roll-ups shift bargaining power
- Scale: procurement, IT, route density
- M&A: new geos/categories
- Integration risk threatens synergy capture
GMS demand tied to IIJA, $4.2T muni market; tariffs lift framing costs
GMS volumes track housing starts ~1.45M (2024) and fell with permits in 2024–25 as mortgage rates ~7.0% cooled demand.
Input volatility: HRC ≈$900/ton (2024) and diesel ≈$4/gal (2024) compress margins; rebates ~1–3% offset some pressure.
Pro forma revenue ≈$5.8B (2024); small contractors (99.9% US firms) raise receivables and credit risk amid tighter lending.
| Metric | 2024 | Impact |
|---|---|---|
| Housing starts | 1.45M | Drives demand |
| Mortgage rate | ~7.0% | Reduces starts |
| Diesel | $4/gal | Raises logistics cost |
| HRC | $900/ton | Compresses margins |
| GMS rev | $5.8B | Scale gains |
What You See Is What You Get
GMS PESTLE Analysis
The preview shown here is the exact GMS PESTLE Analysis document you’ll receive after purchase—fully formatted and ready to use. The layout, content, and structure visible are identical to the final file available for immediate download after checkout. No placeholders or teasers: this is the real, professionally structured analysis you’ll own.
Description
Skip the Research. Get the Strategy.
Gain a strategic edge with our PESTLE Analysis tailored to GMS—three to five external forces distilled into clear implications for growth and risk. This concise briefing reveals the political, economic, social, technological, legal and environmental drivers shaping GMS today. Purchase the full report to access the complete, actionable breakdown and ready-to-use slides for immediate decision-making.
Political factors
Infrastructure and housing policy
GMS demand is highly sensitive to federal and state infrastructure and housing initiatives; the Bipartisan Infrastructure Law provides roughly $550 billion of new spending that can boost public construction and wallboard/ceiling volumes. Cuts or delays compress backlog visibility and order flow. Monitoring annual appropriations and the municipal bond market—about $4.2 trillion outstanding in 2024—is critical for demand forecasting and cash-flow timing.
Trade policy on steel and aluminum
Trade measures like the US Section 232 tariffs (25% on steel, 10% on aluminum) and ongoing anti-dumping duties raise steel framing input costs and constrain availability. Price volatility forces distributors to compress margins or pass costs quickly to customers, squeezing working capital. Diversifying sources and mills reduces concentration risk. Policy shifts can swiftly change competitiveness of imports versus domestic supply.
“Buy American” and domestic content rules
Build America, Buy America provisions in the $1.2 trillion Infrastructure Investment and Jobs Act and domestic-content incentives in the Inflation Reduction Act (≈$369 billion for energy/climate) mean public projects may require domestically produced materials, favoring certain suppliers in GMS’s network but narrowing choice and raising procurement costs. Compliance documentation and origin certifications increase administrative burden, and winning government contracts often hinges on timely proof of origin.
State and local permitting and codes
Jurisdictional differences in building codes—model codes update on a three-year cycle—drive product mix decisions, e.g., demand for fire-rated assemblies in jurisdictions that adopt stricter fire-resistance requirements. Political shifts can speed or delay local adoption, changing lead times and margin profiles for distributors. Active advocacy helps shape local specifications and procurement rules.
- code cycle: 3-year model updates
- local adoption lag: commonly 1–5 years
- inventory alignment: region-specific SKUs required
- advocacy: influences spec language and market access
Labor and immigration policy
Contractor labor supply is constrained by visa caps (H-2B cap 66,000), expanding E-Verify mandates across 26 states and increased enforcement, tightening available skilled crews. Tight labor markets cut jobsite throughput and material turns; construction wages rose about 5% in 2024, squeezing installation demand and extending timelines. Stability in immigration and enforcement supports predictable ordering patterns and procurement planning.
- H-2B cap: 66,000
- E-Verify mandates: 26 states
- Construction wage growth ~5% (2024)
GMS demand tied to IIJA, $4.2T muni market; tariffs lift framing costs
GMS demand tied to federal/state infrastructure; Bipartisan Infrastructure Law ~$550B; municipal bond market ~$4.2T (2024) affects funding timing.
US tariffs (steel 25%, aluminum 10%) and anti-dumping duties raise framing costs; tariffs and IRA/IIJA domestic-content rules (IIJA ~$1.2T; IRA ~$369B) constrain sourcing.
Model building codes update every 3 years; local adoption lag 1–5 years alters SKU mix and margins.
Labor limits: H-2B cap 66,000; E-Verify 26 states; construction wages +~5% (2024).
| Metric | Value |
|---|---|
| IIJA | $550B |
| Municipal debt | $4.2T (2024) |
| Tariffs | Steel 25%/Al 10% |
| H-2B cap | 66,000 |
What is included in the product
Detailed Word Document
Explores how external macro-environmental factors uniquely affect the GMS across six dimensions—Political, Economic, Social, Technological, Environmental, and Legal—backed by current data and trends to identify threats, opportunities, and strategic implications; delivered in clean, report-ready format with forward-looking insights for executives, consultants, and investors.
Customizable Excel Spreadsheet
GMS PESTLE delivers a concise, visually segmented summary of external risks and opportunities for quick reference in meetings or presentations. It’s easily editable and shareable, helping teams align strategy and decision-making without wading through full reports.
Economic factors
Construction cycle sensitivity
GMS volumes closely track housing starts, renovations and commercial build-outs; US housing starts averaged about 1.45 million units in 2024, tying directly to demand for construction materials and services.
Downturns compress discretionary projects and reduce unit turns, while multi-year backlogs provide partial cushioning but not full insulation against revenue declines.
Geographic diversification across regions smooths cycle volatility by spreading exposure to asynchronous local construction markets.
Interest rates and financing costs
Higher 30-year mortgage rates around 7.0% and commercial cap rates near 6.5–7.5% have damped residential and commercial starts; construction permits fell year‑over‑year in 2024–25. Working capital and inventory carrying costs rose as short-term borrowing increased ~150–200 bps, widening price pass-through windows as demand cools; modest rate cuts can quickly re‑accelerate volumes.
Input cost inflation and freight
Wallboard, steel and fuel volatility — with US diesel averaging about $4/gal in 2024 (EIA) and hot‑rolled coil near ~$900/ton in 2024 — compress GMS margins and necessitate dynamic pricing and freight surcharges to preserve spreads. Supplier rebates and scale procurement (rebates commonly 1–3% for large buyers) partially offset input swings. Diesel spikes and logistics tightness continue to increase lead times and degrade service levels.
Contractor health and credit risk
Small and mid-sized contractors are critical because small businesses represent 99.9% of US firms, so their cash-flow volatility directly affects GMS sales; when macro conditions tighten, credit stress reduces order volumes and raises bad-debt incidence. Rising borrowing costs and tighter lending standards since 2022 have amplified receivables risk, making rigorous credit controls and dynamic payment terms essential.
- High exposure: small firms ~majority of customer base
- Macro link: tighter credit → slower orders
- Risk: higher bad-debt probability
- Mitigation: strict credit policy and active terms management
Industry consolidation and scale
Industry roll-ups among distributors and dealers are shifting bargaining power to larger chains; GMS reported pro forma revenue near $5.8B in 2024 after acquisitions, strengthening supplier leverage. Scale enables better procurement pricing, higher IT spend and improved route density, cutting logistics unit costs. M&A opens geographies and categories, but integration risk must be managed to realize synergies.
- Roll-ups shift bargaining power
- Scale: procurement, IT, route density
- M&A: new geos/categories
- Integration risk threatens synergy capture
GMS demand tied to IIJA, $4.2T muni market; tariffs lift framing costs
GMS volumes track housing starts ~1.45M (2024) and fell with permits in 2024–25 as mortgage rates ~7.0% cooled demand.
Input volatility: HRC ≈$900/ton (2024) and diesel ≈$4/gal (2024) compress margins; rebates ~1–3% offset some pressure.
Pro forma revenue ≈$5.8B (2024); small contractors (99.9% US firms) raise receivables and credit risk amid tighter lending.
| Metric | 2024 | Impact |
|---|---|---|
| Housing starts | 1.45M | Drives demand |
| Mortgage rate | ~7.0% | Reduces starts |
| Diesel | $4/gal | Raises logistics cost |
| HRC | $900/ton | Compresses margins |
| GMS rev | $5.8B | Scale gains |
What You See Is What You Get
GMS PESTLE Analysis
The preview shown here is the exact GMS PESTLE Analysis document you’ll receive after purchase—fully formatted and ready to use. The layout, content, and structure visible are identical to the final file available for immediate download after checkout. No placeholders or teasers: this is the real, professionally structured analysis you’ll own.











