Polished Porter's Five Forces Analysis

A Must-Have Tool for Decision-Makers
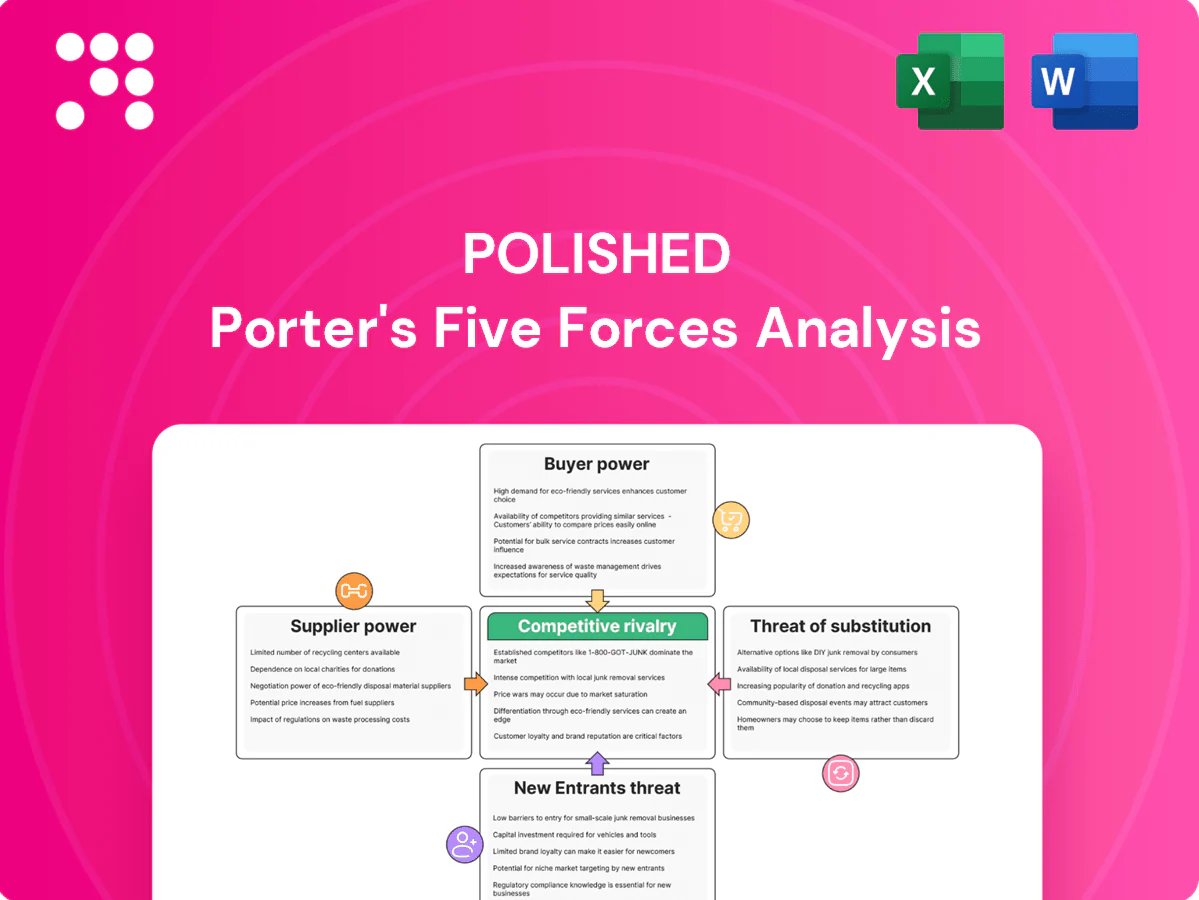
This snapshot highlights key tensions shaping Polished’s market but only scratches the surface. Unlock the full Porter's Five Forces Analysis to examine supplier power, buyer dynamics, entry threats, substitutes, and rivalry in depth. Get consultant-grade visuals, ratings, and downloadable Excel/Word reports to inform strategy and investment decisions.
Suppliers Bargaining Power

Concentrated OEM brands
Major appliance supply is concentrated among a handful of OEMs (Whirlpool, GE, Samsung, LG), with the top four accounting for roughly 70% of US major-appliance market share, giving vendors leverage on terms and allocations. Limited brand alternatives constrain Polished.com’s ability to switch without losing key SKUs, and vendors commonly prioritize higher-volume or omnichannel retailers for allocations. This concentration raises dependency risk during peak seasons when capacity and lead times tighten.
MAP and pricing control
Manufacturers enforce minimum advertised pricing (MAP) that limits sellers' ability to discount, narrowing margin tactics and reducing promotional differentiation. MAP compliance compresses margin strategies for online channels just as e-commerce reached about 22% of global retail sales in 2024, raising stakes for resellers. Violations can trigger fines, supply penalties or loss of authorized status, strengthening supplier bargaining power over online sellers.

Allocation and co-op dependence
Access to in-demand models is often rationed by vendor allocation tiers tied to purchase volume, and co-op marketing/MDF budgets remain vendor-controlled and can be withheld, directly impacting campaign funding. Polished.com’s negotiating leverage strengthens with scale and documented sell-through rates, lowering lead times and improving fill rates. Smaller-volume buyers commonly face longer lead times and poorer fill rates.

Freight, install, and warranty
Private label alternatives limited
Private label alternatives are limited in large appliances; private label penetration in large appliances remained single-digit percent in 2024, because safety certification and nationwide service networks are hard to replicate. Building credible after-sales support demands substantial time and capital, so retailers without strong private labels keep relying on national brands, sustaining supplier bargaining power versus smaller e-commerce players.
- Private-label penetration: single-digit (2024)
- After-sales investment: substantial time & capital
- Outcome: continued reliance on national brands → higher supplier power
Supplier power: top‑4 70%, e‑commerce 22%, private‑label under 10%, service fill 90%
Supplier power is high: top‑4 OEMs hold ~70% US major‑appliance share, MAP restrictions limit discounting, e‑commerce was ~22% of retail sales in 2024, and private‑label penetration remained <10%, while service/parts fill rates hovered near 90%, concentrating leverage over allocations, pricing, freight and warranties.
| Metric | 2024 |
|---|---|
| Top‑4 market share | ~70% |
| E‑commerce share | ~22% |
| Private‑label penetration | <10% |
| Service/parts fill rate | ~90% |
| MAP enforcement | Yes |
What is included in the product
 Detailed Word Document
Polished Porter's Five Forces uncovers competitive drivers, supplier and buyer power, entry barriers, substitutes, and rivalry specific to Polished, highlighting disruptive threats and strategic levers to protect market share and inform investor or strategic materials.

 Customizable Excel Spreadsheet
Polished Porter's Five Forces Analysis delivers a clean, one-sheet summary with customizable pressure levels and an instant spider/radar chart so teams can rapidly diagnose competitive threats and opportunities. Easy to edit, macro-free, and designed to slot into decks or dashboards, it removes the friction of manual analysis and keeps strategy discussions focused and actionable.
Customers Bargaining Power

High price transparency
Consumers can instantly compare prices across Amazon (≈40% of US e‑commerce in 2024), Home Depot, Lowe’s and specialty sites, raising buyer power. Common price‑matching policies compress margins and force Polished.com toward competitive pricing to win conversions. Review aggregators and deal forums amplify transparency and shorten purchase cycles, increasing sensitivity to even small price differentials.
Low switching costs
Shoppers can switch retailers with minimal friction for identical SKUs, driving price and service comparisons across channels. Cart abandonment averages about 69% globally, rising sharply when shipping, installation, or availability differ. Loyalty is fragile unless service and delivery windows are superior, so buyers leverage low switching costs to demand promotions or free add-ons.

Delivery and install expectations
Large-appliance buyers in 2024 expect scheduled delivery, haul-away, and installation bundled, and missed last-mile SLAs drive returns and negative reviews that can cut conversion rates by as much as 20–25%. Ratings give customers strong bargaining power because lower scores directly reduce sales velocity and search visibility. Retailers frequently absorb installation or return costs—often $75–150 per unit—to meet SLAs and prevent churn.

Financing and promotion sensitivity
- Financing-dependence
- Holiday/timing effects
- 0% APR pressure
- Promo-driven demand shifts
Post-sale support leverage
Warranty claims, returns and exchanges drive appliance purchase decisions; in 2024, 68% of buyers cited post-sale support as a decisive factor for brand loyalty. Customers demand hassle-free resolutions and rapid parts service; negative experiences spread via social channels, increasing buyer power and shortening consideration cycles. Robust CX reduces churn but raises service costs, often 5–8% of revenue in appliance makers.
- Warranty claims: high frequency raises costs
- Returns/exchanges: amplify buyer leverage
- Social amplification: boosts negative impact
- CX investment: mitigates risk but costly (5–8% revenue)
Buyers wield leverage: marketplace ≈40%, cart drop ≈69%, CX & financing shape conversion
Buyers wield high leverage: Amazon ≈40% of US e‑commerce (2024), cart abandonment ~69%, and ratings cuts can lower conversion 20–25%. 68% cite post‑sale support as decisive; CX costs run 5–8% of revenue. Financing pressure: US avg credit card APR ≈21% (2024), driving demand for 0% APR and promo timing.
| Metric | 2024 |
|---|---|
| Amazon share | ≈40% |
| Cart abandonment | ≈69% |
| CX cost | 5–8% rev |
| Post‑sale importance | 68% |
| Avg APR | ≈21% |
Preview the Actual Deliverable
Polished Porter's Five Forces Analysis
This preview shows the exact Polished Porter’s Five Forces Analysis you’ll receive after purchase—complete, professionally formatted, and ready to use. No placeholders, mockups, or samples: it’s the final document. Once you buy, you’ll get immediate access to this exact file for download and application.

A Must-Have Tool for Decision-Makers
This snapshot highlights key tensions shaping Polished’s market but only scratches the surface. Unlock the full Porter's Five Forces Analysis to examine supplier power, buyer dynamics, entry threats, substitutes, and rivalry in depth. Get consultant-grade visuals, ratings, and downloadable Excel/Word reports to inform strategy and investment decisions.
Suppliers Bargaining Power
Concentrated OEM brands
Major appliance supply is concentrated among a handful of OEMs (Whirlpool, GE, Samsung, LG), with the top four accounting for roughly 70% of US major-appliance market share, giving vendors leverage on terms and allocations. Limited brand alternatives constrain Polished.com’s ability to switch without losing key SKUs, and vendors commonly prioritize higher-volume or omnichannel retailers for allocations. This concentration raises dependency risk during peak seasons when capacity and lead times tighten.
MAP and pricing control
Manufacturers enforce minimum advertised pricing (MAP) that limits sellers' ability to discount, narrowing margin tactics and reducing promotional differentiation. MAP compliance compresses margin strategies for online channels just as e-commerce reached about 22% of global retail sales in 2024, raising stakes for resellers. Violations can trigger fines, supply penalties or loss of authorized status, strengthening supplier bargaining power over online sellers.
Allocation and co-op dependence
Access to in-demand models is often rationed by vendor allocation tiers tied to purchase volume, and co-op marketing/MDF budgets remain vendor-controlled and can be withheld, directly impacting campaign funding. Polished.com’s negotiating leverage strengthens with scale and documented sell-through rates, lowering lead times and improving fill rates. Smaller-volume buyers commonly face longer lead times and poorer fill rates.
Freight, install, and warranty
Private label alternatives limited
Private label alternatives are limited in large appliances; private label penetration in large appliances remained single-digit percent in 2024, because safety certification and nationwide service networks are hard to replicate. Building credible after-sales support demands substantial time and capital, so retailers without strong private labels keep relying on national brands, sustaining supplier bargaining power versus smaller e-commerce players.
- Private-label penetration: single-digit (2024)
- After-sales investment: substantial time & capital
- Outcome: continued reliance on national brands → higher supplier power
Supplier power: top‑4 70%, e‑commerce 22%, private‑label under 10%, service fill 90%
Supplier power is high: top‑4 OEMs hold ~70% US major‑appliance share, MAP restrictions limit discounting, e‑commerce was ~22% of retail sales in 2024, and private‑label penetration remained <10%, while service/parts fill rates hovered near 90%, concentrating leverage over allocations, pricing, freight and warranties.
| Metric | 2024 |
|---|---|
| Top‑4 market share | ~70% |
| E‑commerce share | ~22% |
| Private‑label penetration | <10% |
| Service/parts fill rate | ~90% |
| MAP enforcement | Yes |
What is included in the product
Detailed Word Document
Polished Porter's Five Forces uncovers competitive drivers, supplier and buyer power, entry barriers, substitutes, and rivalry specific to Polished, highlighting disruptive threats and strategic levers to protect market share and inform investor or strategic materials.
Customizable Excel Spreadsheet
Polished Porter's Five Forces Analysis delivers a clean, one-sheet summary with customizable pressure levels and an instant spider/radar chart so teams can rapidly diagnose competitive threats and opportunities. Easy to edit, macro-free, and designed to slot into decks or dashboards, it removes the friction of manual analysis and keeps strategy discussions focused and actionable.
Customers Bargaining Power
High price transparency
Consumers can instantly compare prices across Amazon (≈40% of US e‑commerce in 2024), Home Depot, Lowe’s and specialty sites, raising buyer power. Common price‑matching policies compress margins and force Polished.com toward competitive pricing to win conversions. Review aggregators and deal forums amplify transparency and shorten purchase cycles, increasing sensitivity to even small price differentials.
Low switching costs
Shoppers can switch retailers with minimal friction for identical SKUs, driving price and service comparisons across channels. Cart abandonment averages about 69% globally, rising sharply when shipping, installation, or availability differ. Loyalty is fragile unless service and delivery windows are superior, so buyers leverage low switching costs to demand promotions or free add-ons.
Delivery and install expectations
Large-appliance buyers in 2024 expect scheduled delivery, haul-away, and installation bundled, and missed last-mile SLAs drive returns and negative reviews that can cut conversion rates by as much as 20–25%. Ratings give customers strong bargaining power because lower scores directly reduce sales velocity and search visibility. Retailers frequently absorb installation or return costs—often $75–150 per unit—to meet SLAs and prevent churn.
Financing and promotion sensitivity
- Financing-dependence
- Holiday/timing effects
- 0% APR pressure
- Promo-driven demand shifts
Post-sale support leverage
Warranty claims, returns and exchanges drive appliance purchase decisions; in 2024, 68% of buyers cited post-sale support as a decisive factor for brand loyalty. Customers demand hassle-free resolutions and rapid parts service; negative experiences spread via social channels, increasing buyer power and shortening consideration cycles. Robust CX reduces churn but raises service costs, often 5–8% of revenue in appliance makers.
- Warranty claims: high frequency raises costs
- Returns/exchanges: amplify buyer leverage
- Social amplification: boosts negative impact
- CX investment: mitigates risk but costly (5–8% revenue)
Buyers wield leverage: marketplace ≈40%, cart drop ≈69%, CX & financing shape conversion
Buyers wield high leverage: Amazon ≈40% of US e‑commerce (2024), cart abandonment ~69%, and ratings cuts can lower conversion 20–25%. 68% cite post‑sale support as decisive; CX costs run 5–8% of revenue. Financing pressure: US avg credit card APR ≈21% (2024), driving demand for 0% APR and promo timing.
| Metric | 2024 |
|---|---|
| Amazon share | ≈40% |
| Cart abandonment | ≈69% |
| CX cost | 5–8% rev |
| Post‑sale importance | 68% |
| Avg APR | ≈21% |
Preview the Actual Deliverable
Polished Porter's Five Forces Analysis
This preview shows the exact Polished Porter’s Five Forces Analysis you’ll receive after purchase—complete, professionally formatted, and ready to use. No placeholders, mockups, or samples: it’s the final document. Once you buy, you’ll get immediate access to this exact file for download and application.
Original: $10.00
-65%$10.00
$3.50Description
A Must-Have Tool for Decision-Makers
This snapshot highlights key tensions shaping Polished’s market but only scratches the surface. Unlock the full Porter's Five Forces Analysis to examine supplier power, buyer dynamics, entry threats, substitutes, and rivalry in depth. Get consultant-grade visuals, ratings, and downloadable Excel/Word reports to inform strategy and investment decisions.
Suppliers Bargaining Power
Concentrated OEM brands
Major appliance supply is concentrated among a handful of OEMs (Whirlpool, GE, Samsung, LG), with the top four accounting for roughly 70% of US major-appliance market share, giving vendors leverage on terms and allocations. Limited brand alternatives constrain Polished.com’s ability to switch without losing key SKUs, and vendors commonly prioritize higher-volume or omnichannel retailers for allocations. This concentration raises dependency risk during peak seasons when capacity and lead times tighten.
MAP and pricing control
Manufacturers enforce minimum advertised pricing (MAP) that limits sellers' ability to discount, narrowing margin tactics and reducing promotional differentiation. MAP compliance compresses margin strategies for online channels just as e-commerce reached about 22% of global retail sales in 2024, raising stakes for resellers. Violations can trigger fines, supply penalties or loss of authorized status, strengthening supplier bargaining power over online sellers.
Allocation and co-op dependence
Access to in-demand models is often rationed by vendor allocation tiers tied to purchase volume, and co-op marketing/MDF budgets remain vendor-controlled and can be withheld, directly impacting campaign funding. Polished.com’s negotiating leverage strengthens with scale and documented sell-through rates, lowering lead times and improving fill rates. Smaller-volume buyers commonly face longer lead times and poorer fill rates.
Freight, install, and warranty
Private label alternatives limited
Private label alternatives are limited in large appliances; private label penetration in large appliances remained single-digit percent in 2024, because safety certification and nationwide service networks are hard to replicate. Building credible after-sales support demands substantial time and capital, so retailers without strong private labels keep relying on national brands, sustaining supplier bargaining power versus smaller e-commerce players.
- Private-label penetration: single-digit (2024)
- After-sales investment: substantial time & capital
- Outcome: continued reliance on national brands → higher supplier power
Supplier power: top‑4 70%, e‑commerce 22%, private‑label under 10%, service fill 90%
Supplier power is high: top‑4 OEMs hold ~70% US major‑appliance share, MAP restrictions limit discounting, e‑commerce was ~22% of retail sales in 2024, and private‑label penetration remained <10%, while service/parts fill rates hovered near 90%, concentrating leverage over allocations, pricing, freight and warranties.
| Metric | 2024 |
|---|---|
| Top‑4 market share | ~70% |
| E‑commerce share | ~22% |
| Private‑label penetration | <10% |
| Service/parts fill rate | ~90% |
| MAP enforcement | Yes |
What is included in the product
Detailed Word Document
Polished Porter's Five Forces uncovers competitive drivers, supplier and buyer power, entry barriers, substitutes, and rivalry specific to Polished, highlighting disruptive threats and strategic levers to protect market share and inform investor or strategic materials.
Customizable Excel Spreadsheet
Polished Porter's Five Forces Analysis delivers a clean, one-sheet summary with customizable pressure levels and an instant spider/radar chart so teams can rapidly diagnose competitive threats and opportunities. Easy to edit, macro-free, and designed to slot into decks or dashboards, it removes the friction of manual analysis and keeps strategy discussions focused and actionable.
Customers Bargaining Power
High price transparency
Consumers can instantly compare prices across Amazon (≈40% of US e‑commerce in 2024), Home Depot, Lowe’s and specialty sites, raising buyer power. Common price‑matching policies compress margins and force Polished.com toward competitive pricing to win conversions. Review aggregators and deal forums amplify transparency and shorten purchase cycles, increasing sensitivity to even small price differentials.
Low switching costs
Shoppers can switch retailers with minimal friction for identical SKUs, driving price and service comparisons across channels. Cart abandonment averages about 69% globally, rising sharply when shipping, installation, or availability differ. Loyalty is fragile unless service and delivery windows are superior, so buyers leverage low switching costs to demand promotions or free add-ons.
Delivery and install expectations
Large-appliance buyers in 2024 expect scheduled delivery, haul-away, and installation bundled, and missed last-mile SLAs drive returns and negative reviews that can cut conversion rates by as much as 20–25%. Ratings give customers strong bargaining power because lower scores directly reduce sales velocity and search visibility. Retailers frequently absorb installation or return costs—often $75–150 per unit—to meet SLAs and prevent churn.
Financing and promotion sensitivity
- Financing-dependence
- Holiday/timing effects
- 0% APR pressure
- Promo-driven demand shifts
Post-sale support leverage
Warranty claims, returns and exchanges drive appliance purchase decisions; in 2024, 68% of buyers cited post-sale support as a decisive factor for brand loyalty. Customers demand hassle-free resolutions and rapid parts service; negative experiences spread via social channels, increasing buyer power and shortening consideration cycles. Robust CX reduces churn but raises service costs, often 5–8% of revenue in appliance makers.
- Warranty claims: high frequency raises costs
- Returns/exchanges: amplify buyer leverage
- Social amplification: boosts negative impact
- CX investment: mitigates risk but costly (5–8% revenue)
Buyers wield leverage: marketplace ≈40%, cart drop ≈69%, CX & financing shape conversion
Buyers wield high leverage: Amazon ≈40% of US e‑commerce (2024), cart abandonment ~69%, and ratings cuts can lower conversion 20–25%. 68% cite post‑sale support as decisive; CX costs run 5–8% of revenue. Financing pressure: US avg credit card APR ≈21% (2024), driving demand for 0% APR and promo timing.
| Metric | 2024 |
|---|---|
| Amazon share | ≈40% |
| Cart abandonment | ≈69% |
| CX cost | 5–8% rev |
| Post‑sale importance | 68% |
| Avg APR | ≈21% |
Preview the Actual Deliverable
Polished Porter's Five Forces Analysis
This preview shows the exact Polished Porter’s Five Forces Analysis you’ll receive after purchase—complete, professionally formatted, and ready to use. No placeholders, mockups, or samples: it’s the final document. Once you buy, you’ll get immediate access to this exact file for download and application.











