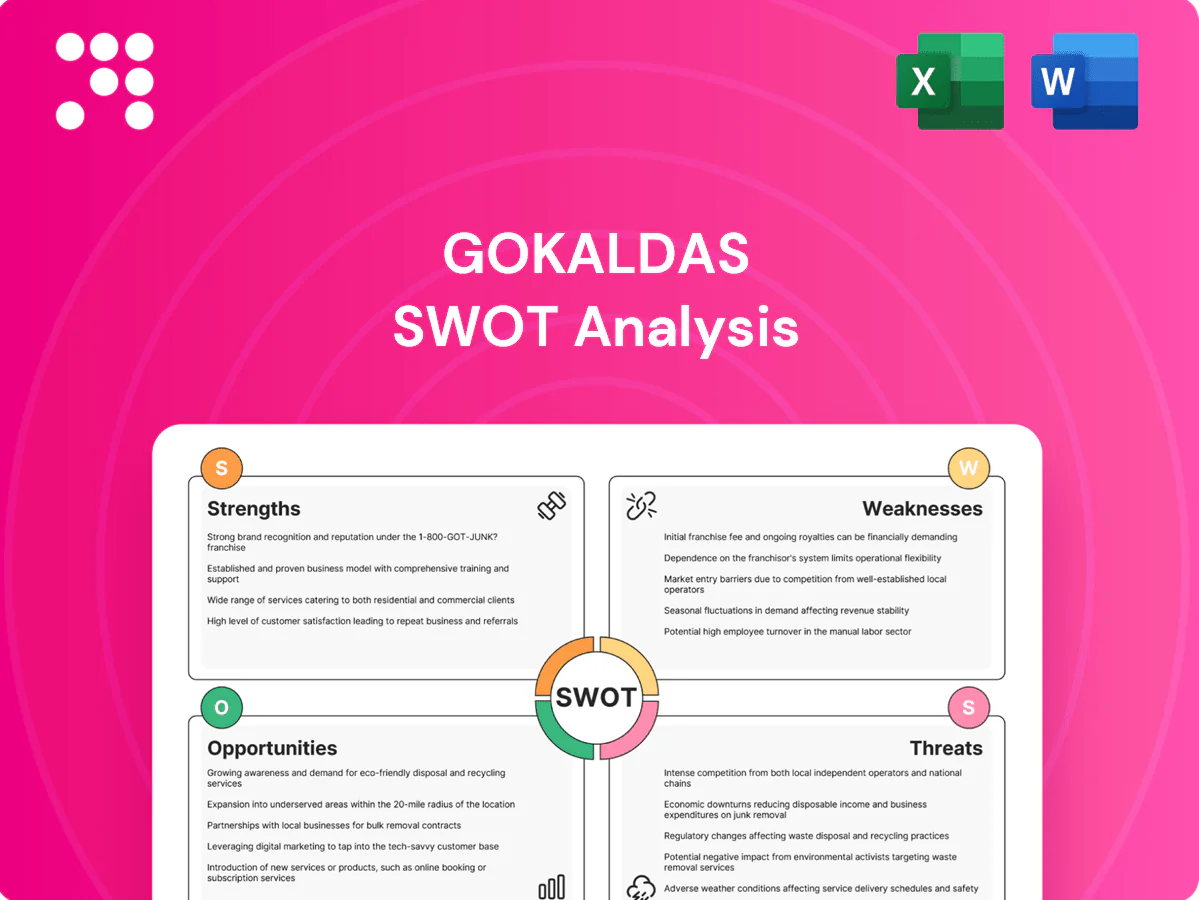
Gokaldas SWOT Analysis

Elevate Your Analysis with the Complete SWOT Report
Gokaldas shows manufacturing scale, strong export relationships, and vertical integration, but faces client concentration and rising labor costs; opportunities include growing apparel demand and value-added products while global competition and currency swings pose threats. Want the full picture? Purchase the complete SWOT analysis for a research-backed, editable Word and Excel report to plan, pitch, or invest with confidence.
Strengths

Deep global brand relationships
As a long-standing supplier to international fashion retailers, Gokaldas benefits from multi-season visibility and steady repeat orders, enhancing revenue predictability. Preferred-vendor status helps secure capacity utilization during softer cycles and supports smoother cash flow. Deep buyer relationships enable co-development and faster onboarding of new product lines, while rising switching costs reflect entrenched trust in quality and compliance.
Diversified product portfolio
Diversified product portfolio spanning activewear, fashion wear and intimate wear for men, women and children spreads demand risk and smooths seasonality by balancing fashion cycles; cross-selling into adjacent categories raises wallet share per client while improving line utilization and fabric-yield management, lowering per-unit costs and supporting stable revenue streams.

Integrated design-to-delivery capabilities
Integrated design-to-delivery capabilities enable Gokaldas to shorten lead times by offering end-to-end services from design and development through manufacturing and logistics, improving speed to market. Vertical process control enhances product quality, regulatory compliance and on-time delivery. Buyers benefit from a one-stop solution that reduces coordination costs and supports premium pricing for value-added services.

Cost-efficient India manufacturing base
Operating in India gives Gokaldas access to labor costs up to 50–60% lower than China, a skilled manufacturing workforce and growing supplier ecosystem; textiles and apparel exports reached about $44.4bn in FY2023–24, supporting scale. Duty schemes and emerging FTAs improve landed-costs, while proximity to clusters like Tirupur, Surat and Ludhiana enhances sourcing flexibility and reduces per-unit overheads.
- Labor cost advantage ~50–60% vs China
- Textile exports $44.4bn FY2023–24
- Key clusters: Tirupur, Surat, Ludhiana
- Scale lowers per-unit overheads
Strong compliance and quality track record
Export-focused systems align with global audit standards (social, environmental, technical), reflected in Gokaldas’s certification-driven processes and low compliance incidents. Reliable quality and on-time delivery reduce returns and chargebacks, underpinning customer retention and entry into stricter markets as ESG rules tighten; India apparel exports ≈ US$18.5bn in FY2023-24.
- Certification: ISO/WRAP/BSCI compliance
- Market access: enables entry to EU/US premium buyers
- Performance: fewer returns, stronger retention
Preferred-vendor status and vertical sourcing cut costs, boost repeat orders and export growth
Long-standing preferred-vendor status drives multi-season visibility and repeat orders, improving revenue predictability. Diversified apparel mix and vertical design-to-delivery cut per-unit costs and shorten lead times, supporting premium pricing. India cost base and export scale give competitive unit economics and market access under tightening ESG rules.
| Metric | Value |
|---|---|
| Labor cost vs China | 50–60% lower |
| Textile exports FY2023–24 | US$44.4bn |
| Apparel exports FY2023–24 | US$18.5bn |
| Certifications | ISO / WRAP / BSCI |
What is included in the product
 Detailed Word Document
Provides a concise strategic overview of Gokaldas’s internal strengths and weaknesses and external opportunities and threats, mapping competitive position, growth drivers, operational gaps, and market risks to inform strategic decisions.

 Customizable Excel Spreadsheet
Provides a concise, editable SWOT matrix for Gokaldas that clarifies capacity, supply‑chain and market risks, enabling fast stakeholder alignment and easy integration into reports or presentations.
Weaknesses

Client concentration risk
Reliance on a limited set of large international buyers exposes Gokaldas to amplified demand shocks, with industry reports noting top five clients often account for around 60% of revenues at mid-sized apparel manufacturers. Pricing power shifts toward buyers during contract negotiations, pressuring margins. Losing a key account can materially dent plant utilization and EBIT, and diversification is slow given onboarding cycles of 6–18 months for new major accounts.
Thin margins and capex intensity
Apparel manufacturing is a scale game with price-sensitive buyers, leaving Gokaldas exposed to thin gross and operating margins. Frequent machinery upgrades and capacity additions drive steady capex, constraining free cash flow unless utilization rises. Margin expansion is difficult without product-mix improvement and automation, and sectoral downcycles can quickly compress returns on invested capital.

Limited backward integration
Dependence on external fabric and trim suppliers exposes Gokaldas to lead-time and price volatility, with fast-fashion peers like Zara turning collections in as little as two weeks compared with industry sourcing cycles of several weeks. Any upstream disruption can ripple through production schedules and inventory. Backward integration requires heavy capex and operational complexity, limiting responsiveness to rapid trend shifts.

Labor-intensive operations
Labor-intensive operations at Gokaldas raise training and retention burdens due to heavy dependence on skilled operators, causing productivity variance across lines that can undermine delivery reliability; regional labor disputes and constraints have repeatedly disrupted output, while adoption of automation is constrained by capital costs and change-management challenges.
- High operator dependence — training & retention
- Line-to-line productivity variance — delivery risk
- Labor disputes/regional limits — disruption
- Slow automation uptake — cost & change barriers
Working capital intensity
Large inventories of fabrics and WIP tie up cash, constraining Gokaldas’s ability to deploy capital into higher-return activities.
Lengthy receivable cycles with global buyers strain liquidity and increase reliance on short-term financing.
FX hedging costs and procurement prepayments add complexity; inefficient working capital can dilute cash flows even during growth.
- High inventory intensity
- Extended receivables
- Hedging and prepayment burden
Concentration (≈60%) and slow onboarding squeeze margins, stress liquidity
Concentration risk: top five clients ≈60% of revenues, onboarding new major accounts 6–18 months. Thin margins and scale pressure limit margin expansion; capex for automation is material. Supply chain reliance raises lead-time volatility (fast-fashion peers turn collections in ≈2 weeks). High inventory and extended receivables strain liquidity.
| Metric | Value |
|---|---|
| Top-5 client share | ≈60% |
| Onboarding cycle | 6–18 months |
| Fast-fashion turnaround | ≈2 weeks |
Full Version Awaits
Gokaldas SWOT Analysis
This is the actual Gokaldas SWOT analysis document you’ll receive upon purchase—no surprises, just professional quality. The preview below is taken directly from the full SWOT report you'll get, with the same structure and insights. Once purchased, you’ll receive the complete, editable version ready for use in presentations or strategic planning.

Elevate Your Analysis with the Complete SWOT Report
Gokaldas shows manufacturing scale, strong export relationships, and vertical integration, but faces client concentration and rising labor costs; opportunities include growing apparel demand and value-added products while global competition and currency swings pose threats. Want the full picture? Purchase the complete SWOT analysis for a research-backed, editable Word and Excel report to plan, pitch, or invest with confidence.
Strengths
Deep global brand relationships
As a long-standing supplier to international fashion retailers, Gokaldas benefits from multi-season visibility and steady repeat orders, enhancing revenue predictability. Preferred-vendor status helps secure capacity utilization during softer cycles and supports smoother cash flow. Deep buyer relationships enable co-development and faster onboarding of new product lines, while rising switching costs reflect entrenched trust in quality and compliance.
Diversified product portfolio
Diversified product portfolio spanning activewear, fashion wear and intimate wear for men, women and children spreads demand risk and smooths seasonality by balancing fashion cycles; cross-selling into adjacent categories raises wallet share per client while improving line utilization and fabric-yield management, lowering per-unit costs and supporting stable revenue streams.
Integrated design-to-delivery capabilities
Integrated design-to-delivery capabilities enable Gokaldas to shorten lead times by offering end-to-end services from design and development through manufacturing and logistics, improving speed to market. Vertical process control enhances product quality, regulatory compliance and on-time delivery. Buyers benefit from a one-stop solution that reduces coordination costs and supports premium pricing for value-added services.
Cost-efficient India manufacturing base
Operating in India gives Gokaldas access to labor costs up to 50–60% lower than China, a skilled manufacturing workforce and growing supplier ecosystem; textiles and apparel exports reached about $44.4bn in FY2023–24, supporting scale. Duty schemes and emerging FTAs improve landed-costs, while proximity to clusters like Tirupur, Surat and Ludhiana enhances sourcing flexibility and reduces per-unit overheads.
- Labor cost advantage ~50–60% vs China
- Textile exports $44.4bn FY2023–24
- Key clusters: Tirupur, Surat, Ludhiana
- Scale lowers per-unit overheads
Strong compliance and quality track record
Export-focused systems align with global audit standards (social, environmental, technical), reflected in Gokaldas’s certification-driven processes and low compliance incidents. Reliable quality and on-time delivery reduce returns and chargebacks, underpinning customer retention and entry into stricter markets as ESG rules tighten; India apparel exports ≈ US$18.5bn in FY2023-24.
- Certification: ISO/WRAP/BSCI compliance
- Market access: enables entry to EU/US premium buyers
- Performance: fewer returns, stronger retention
Preferred-vendor status and vertical sourcing cut costs, boost repeat orders and export growth
Long-standing preferred-vendor status drives multi-season visibility and repeat orders, improving revenue predictability. Diversified apparel mix and vertical design-to-delivery cut per-unit costs and shorten lead times, supporting premium pricing. India cost base and export scale give competitive unit economics and market access under tightening ESG rules.
| Metric | Value |
|---|---|
| Labor cost vs China | 50–60% lower |
| Textile exports FY2023–24 | US$44.4bn |
| Apparel exports FY2023–24 | US$18.5bn |
| Certifications | ISO / WRAP / BSCI |
What is included in the product
Detailed Word Document
Provides a concise strategic overview of Gokaldas’s internal strengths and weaknesses and external opportunities and threats, mapping competitive position, growth drivers, operational gaps, and market risks to inform strategic decisions.
Customizable Excel Spreadsheet
Provides a concise, editable SWOT matrix for Gokaldas that clarifies capacity, supply‑chain and market risks, enabling fast stakeholder alignment and easy integration into reports or presentations.
Weaknesses
Client concentration risk
Reliance on a limited set of large international buyers exposes Gokaldas to amplified demand shocks, with industry reports noting top five clients often account for around 60% of revenues at mid-sized apparel manufacturers. Pricing power shifts toward buyers during contract negotiations, pressuring margins. Losing a key account can materially dent plant utilization and EBIT, and diversification is slow given onboarding cycles of 6–18 months for new major accounts.
Thin margins and capex intensity
Apparel manufacturing is a scale game with price-sensitive buyers, leaving Gokaldas exposed to thin gross and operating margins. Frequent machinery upgrades and capacity additions drive steady capex, constraining free cash flow unless utilization rises. Margin expansion is difficult without product-mix improvement and automation, and sectoral downcycles can quickly compress returns on invested capital.
Limited backward integration
Dependence on external fabric and trim suppliers exposes Gokaldas to lead-time and price volatility, with fast-fashion peers like Zara turning collections in as little as two weeks compared with industry sourcing cycles of several weeks. Any upstream disruption can ripple through production schedules and inventory. Backward integration requires heavy capex and operational complexity, limiting responsiveness to rapid trend shifts.
Labor-intensive operations
Labor-intensive operations at Gokaldas raise training and retention burdens due to heavy dependence on skilled operators, causing productivity variance across lines that can undermine delivery reliability; regional labor disputes and constraints have repeatedly disrupted output, while adoption of automation is constrained by capital costs and change-management challenges.
- High operator dependence — training & retention
- Line-to-line productivity variance — delivery risk
- Labor disputes/regional limits — disruption
- Slow automation uptake — cost & change barriers
Working capital intensity
Large inventories of fabrics and WIP tie up cash, constraining Gokaldas’s ability to deploy capital into higher-return activities.
Lengthy receivable cycles with global buyers strain liquidity and increase reliance on short-term financing.
FX hedging costs and procurement prepayments add complexity; inefficient working capital can dilute cash flows even during growth.
- High inventory intensity
- Extended receivables
- Hedging and prepayment burden
Concentration (≈60%) and slow onboarding squeeze margins, stress liquidity
Concentration risk: top five clients ≈60% of revenues, onboarding new major accounts 6–18 months. Thin margins and scale pressure limit margin expansion; capex for automation is material. Supply chain reliance raises lead-time volatility (fast-fashion peers turn collections in ≈2 weeks). High inventory and extended receivables strain liquidity.
| Metric | Value |
|---|---|
| Top-5 client share | ≈60% |
| Onboarding cycle | 6–18 months |
| Fast-fashion turnaround | ≈2 weeks |
Full Version Awaits
Gokaldas SWOT Analysis
This is the actual Gokaldas SWOT analysis document you’ll receive upon purchase—no surprises, just professional quality. The preview below is taken directly from the full SWOT report you'll get, with the same structure and insights. Once purchased, you’ll receive the complete, editable version ready for use in presentations or strategic planning.
Original: $10.00
-65%$10.00
$3.50Description
Elevate Your Analysis with the Complete SWOT Report
Gokaldas shows manufacturing scale, strong export relationships, and vertical integration, but faces client concentration and rising labor costs; opportunities include growing apparel demand and value-added products while global competition and currency swings pose threats. Want the full picture? Purchase the complete SWOT analysis for a research-backed, editable Word and Excel report to plan, pitch, or invest with confidence.
Strengths
Deep global brand relationships
As a long-standing supplier to international fashion retailers, Gokaldas benefits from multi-season visibility and steady repeat orders, enhancing revenue predictability. Preferred-vendor status helps secure capacity utilization during softer cycles and supports smoother cash flow. Deep buyer relationships enable co-development and faster onboarding of new product lines, while rising switching costs reflect entrenched trust in quality and compliance.
Diversified product portfolio
Diversified product portfolio spanning activewear, fashion wear and intimate wear for men, women and children spreads demand risk and smooths seasonality by balancing fashion cycles; cross-selling into adjacent categories raises wallet share per client while improving line utilization and fabric-yield management, lowering per-unit costs and supporting stable revenue streams.
Integrated design-to-delivery capabilities
Integrated design-to-delivery capabilities enable Gokaldas to shorten lead times by offering end-to-end services from design and development through manufacturing and logistics, improving speed to market. Vertical process control enhances product quality, regulatory compliance and on-time delivery. Buyers benefit from a one-stop solution that reduces coordination costs and supports premium pricing for value-added services.
Cost-efficient India manufacturing base
Operating in India gives Gokaldas access to labor costs up to 50–60% lower than China, a skilled manufacturing workforce and growing supplier ecosystem; textiles and apparel exports reached about $44.4bn in FY2023–24, supporting scale. Duty schemes and emerging FTAs improve landed-costs, while proximity to clusters like Tirupur, Surat and Ludhiana enhances sourcing flexibility and reduces per-unit overheads.
- Labor cost advantage ~50–60% vs China
- Textile exports $44.4bn FY2023–24
- Key clusters: Tirupur, Surat, Ludhiana
- Scale lowers per-unit overheads
Strong compliance and quality track record
Export-focused systems align with global audit standards (social, environmental, technical), reflected in Gokaldas’s certification-driven processes and low compliance incidents. Reliable quality and on-time delivery reduce returns and chargebacks, underpinning customer retention and entry into stricter markets as ESG rules tighten; India apparel exports ≈ US$18.5bn in FY2023-24.
- Certification: ISO/WRAP/BSCI compliance
- Market access: enables entry to EU/US premium buyers
- Performance: fewer returns, stronger retention
Preferred-vendor status and vertical sourcing cut costs, boost repeat orders and export growth
Long-standing preferred-vendor status drives multi-season visibility and repeat orders, improving revenue predictability. Diversified apparel mix and vertical design-to-delivery cut per-unit costs and shorten lead times, supporting premium pricing. India cost base and export scale give competitive unit economics and market access under tightening ESG rules.
| Metric | Value |
|---|---|
| Labor cost vs China | 50–60% lower |
| Textile exports FY2023–24 | US$44.4bn |
| Apparel exports FY2023–24 | US$18.5bn |
| Certifications | ISO / WRAP / BSCI |
What is included in the product
Detailed Word Document
Provides a concise strategic overview of Gokaldas’s internal strengths and weaknesses and external opportunities and threats, mapping competitive position, growth drivers, operational gaps, and market risks to inform strategic decisions.
Customizable Excel Spreadsheet
Provides a concise, editable SWOT matrix for Gokaldas that clarifies capacity, supply‑chain and market risks, enabling fast stakeholder alignment and easy integration into reports or presentations.
Weaknesses
Client concentration risk
Reliance on a limited set of large international buyers exposes Gokaldas to amplified demand shocks, with industry reports noting top five clients often account for around 60% of revenues at mid-sized apparel manufacturers. Pricing power shifts toward buyers during contract negotiations, pressuring margins. Losing a key account can materially dent plant utilization and EBIT, and diversification is slow given onboarding cycles of 6–18 months for new major accounts.
Thin margins and capex intensity
Apparel manufacturing is a scale game with price-sensitive buyers, leaving Gokaldas exposed to thin gross and operating margins. Frequent machinery upgrades and capacity additions drive steady capex, constraining free cash flow unless utilization rises. Margin expansion is difficult without product-mix improvement and automation, and sectoral downcycles can quickly compress returns on invested capital.
Limited backward integration
Dependence on external fabric and trim suppliers exposes Gokaldas to lead-time and price volatility, with fast-fashion peers like Zara turning collections in as little as two weeks compared with industry sourcing cycles of several weeks. Any upstream disruption can ripple through production schedules and inventory. Backward integration requires heavy capex and operational complexity, limiting responsiveness to rapid trend shifts.
Labor-intensive operations
Labor-intensive operations at Gokaldas raise training and retention burdens due to heavy dependence on skilled operators, causing productivity variance across lines that can undermine delivery reliability; regional labor disputes and constraints have repeatedly disrupted output, while adoption of automation is constrained by capital costs and change-management challenges.
- High operator dependence — training & retention
- Line-to-line productivity variance — delivery risk
- Labor disputes/regional limits — disruption
- Slow automation uptake — cost & change barriers
Working capital intensity
Large inventories of fabrics and WIP tie up cash, constraining Gokaldas’s ability to deploy capital into higher-return activities.
Lengthy receivable cycles with global buyers strain liquidity and increase reliance on short-term financing.
FX hedging costs and procurement prepayments add complexity; inefficient working capital can dilute cash flows even during growth.
- High inventory intensity
- Extended receivables
- Hedging and prepayment burden
Concentration (≈60%) and slow onboarding squeeze margins, stress liquidity
Concentration risk: top five clients ≈60% of revenues, onboarding new major accounts 6–18 months. Thin margins and scale pressure limit margin expansion; capex for automation is material. Supply chain reliance raises lead-time volatility (fast-fashion peers turn collections in ≈2 weeks). High inventory and extended receivables strain liquidity.
| Metric | Value |
|---|---|
| Top-5 client share | ≈60% |
| Onboarding cycle | 6–18 months |
| Fast-fashion turnaround | ≈2 weeks |
Full Version Awaits
Gokaldas SWOT Analysis
This is the actual Gokaldas SWOT analysis document you’ll receive upon purchase—no surprises, just professional quality. The preview below is taken directly from the full SWOT report you'll get, with the same structure and insights. Once purchased, you’ll receive the complete, editable version ready for use in presentations or strategic planning.











