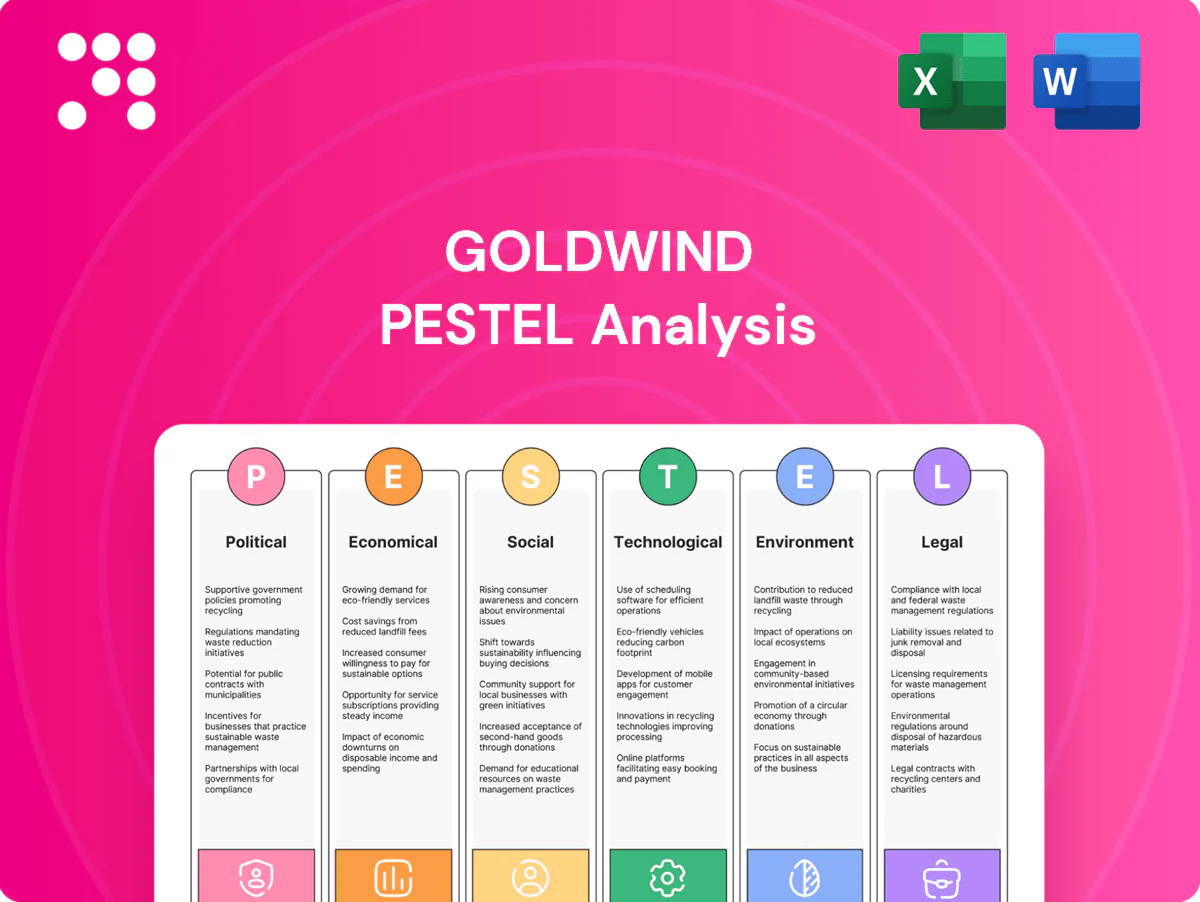
Goldwind PESTLE Analysis

Plan Smarter. Present Sharper. Compete Stronger.
Gain a strategic advantage with our PESTLE Analysis of Goldwind—three concise sections reveal how political, economic, social, technological, legal, and environmental forces shape its outlook and risks. Ideal for investors and strategists seeking clear, actionable intelligence. Purchase the full report to access detailed insights, data-driven scenarios, and ready-to-use slides for immediate decision-making.
Political factors

Renewable subsidies
Government incentives such as feed-in tariffs and tax credits remain primary drivers of wind project economics and turbine demand, and policy stability reduces revenue volatility to encourage long-term procurement that benefits top-three OEMs like Goldwind. Sudden subsidy cuts or auction redesigns have repeatedly delayed orders and compressed margins across markets, forcing manufacturers to defer deliveries and renegotiate contracts. Goldwind must align its sales pipeline and financing assumptions with evolving support schemes in key markets to preserve margins and order flow.
Energy security agendas
Many countries prioritize domestic renewables to cut imported fuels, with the EU target of at least 42.5% renewables by 2030 and US clean-energy incentives under the Inflation Reduction Act (~$369 billion) driving policy. That raises the strategic value of wind deployment and grid integration, unlocking fast-track permitting and grid buildout in several markets. Goldwind benefits where wind is central to security strategies but must navigate diverse local content and procurement rules.

Geopolitical trade dynamics
Tariffs, export controls (tightened by the US since 2022) and sanctions on Russia have already disrupted component flows and market access for wind suppliers; US Inflation Reduction Act rules mean up to 30% clean-energy tax credit requires North American final assembly. Localization mandates in the EU and US are pushing regional footprints, while currency and logistics pressures rise in tense trade periods. Goldwind needs diversified suppliers and multi-hub production to hedge geopolitical risk.

Infrastructure and grid policy
Transmission planning and interconnection rules (US interconnection backlog ~1,000 GW as of 2024; China curtailment down to 6.6% in 2023 per NEA) directly affect Goldwind project timing and ROI, while priority dispatch/curtailment policies determine realized capacity factors and revenue certainty. Emerging grid-forming and ancillary-service specs (adopted by key ISOs 2022–24) force turbine design changes and add CAPEX. Proactive policy engagement lets Goldwind align R&D and product roadmaps with evolving grid codes.
- Transmission queues: ~1,000 GW backlog (US, 2024)
- Curtailment: China 6.6% (NEA, 2023)
- Grid-forming: ISOs issued guidance 2022–24
- Policy engagement: critical for product-market fit
Public procurement and auctions
Competitive tenders increasingly set price expectations and volume visibility for wind projects, while auction design elements—price caps, indexation and penalties—directly shape developer appetite and turbine specifications. Local preference criteria in many 2024-25 auctions tilt awards toward domestic suppliers or local content. Goldwind must ensure bankable technology and LCOE leadership to make customers auction-ready.
- Price signals: drive procurement
- Auction rules: alter specs and risk
- Local preference: affects award share
- Goldwind: focus on bankability and low LCOE
Incentives and localization raise order visibility; grid backlogs and subsidy cuts threaten timing
Policy stability and incentives (US IRA ~$369bn; EU renewables target 42.5% by 2030) drive Goldwind order visibility and margins, while sudden subsidy cuts compress demand. Trade measures and localization (IRA sourcing rules) force regional production and supply diversification. Grid constraints (US ~1,000 GW interconnection backlog 2024; China curtailment 6.6% 2023) affect project timing and CF.
| Factor | Metric | Year/Source |
|---|---|---|
| US incentives | $369bn | IRA, 2022–24 |
| EU renewables | 42.5% by 2030 | EU, 2023 |
| US queue | ~1,000 GW | 2024 |
| China curtailment | 6.6% | NEA, 2023 |
What is included in the product
 Detailed Word Document
Explores how macro-environmental factors uniquely affect Goldwind across Political, Economic, Social, Technological, Environmental, and Legal dimensions, with each section supported by data and current trends to highlight risks and opportunities. Designed for executives, consultants, and investors, it offers forward-looking insights and actionable examples tailored to Goldwind's market, regulatory landscape, and competitive dynamics.

 Customizable Excel Spreadsheet
A concise, visually segmented Goldwind PESTLE summary that’s editable and shareable, enabling quick risk discussions, alignment across teams, and seamless inclusion in presentations or reports.
Economic factors

Interest rates and financing
Wind projects are capital intensive (onshore capex ~USD 1.2–1.4m/MW) and a 100–200bps rise in cost of capital can raise LCOE materially, delay FIDs and compress turbine pricing margins. Improved inflation-indexed PPAs and growth in green debt markets (sustainable issuance ~USD 600bn in 2024) can offset headwinds. Goldwind mitigates risk by bundling finance solutions and performance guarantees, supporting project bankability and reducing WACC for clients.
Commodity and input costs
Steel (China HRC avg ~4,800 CNY/ton in 2024), copper (~9,000 USD/ton in 2024) and rare earths for magnets drive a large share of turbine BOM and logistics add 5–10% to project costs; volatility forced OEMs into hedging, long‑term supply contracts and design optimization. Cost inflation on fixed‑price deals can compress margins, so Goldwind leverages supply‑chain scale and modular designs to lower per‑unit exposure.

Currency fluctuations
Goldwind, a top-three global wind-turbine manufacturer operating in over 30 countries, faces FX risk as revenues and costs are booked in multiple currencies, exposing margins to exchange swings.
Sharp devaluations in key customer markets—where currency moves can exceed 20% in a year—can delay imports and payments, disrupting project cashflows.
Natural hedges, local-currency pricing and robust treasury operations with FX clauses in EPC and supply contracts are essential to stabilize margins and limit translation risk.

Global demand cycles
Global wind deployment tracks economic growth, power demand (global electricity demand rose about 2.5% in 2023, IEA) and carbon prices (EU ETS ~€90/t by late 2024), so booms can strain turbines and components while downturns drive price competition. Goldwind’s diversified geographic exposure smooths regional cycles, and service plus repowering businesses provide countercyclical revenue buffers.
- Deployment linked to GDP, electricity demand +2.5% (2023)
- Carbon price signal: EU ETS ≈ €90/t (late 2024)
- Diversification reduces volatility
- Service/repowering = countercyclical revenue
Scale and learning curves
Scale in turbine size and manufacturing lowers unit costs for Goldwind, while experience curves from high-volume production and iterative design drive efficiency gains and shorter ramp times; industry benchmarks show lifecycle service revenues can add roughly 20-30 percent to project cash flow.
- Large turbines reduce LCOE
- High volume improves learning rates
- Aftermarket boosts recurring cash flow
- End-to-end model captures multiple margins
Incentives and localization raise order visibility; grid backlogs and subsidy cuts threaten timing
Wind capex ~USD 1.2–1.4m/MW; 100–200bps CoC rise raises LCOE and delays FIDs. Sustainable issuance ~USD 600bn (2024) and inflation‑linked PPAs improve bankability. Key inputs: China HRC ~4,800 CNY/t (2024), copper ~USD 9,000/t (2024); EU ETS ~€90/t (late 2024). Aftermarket adds ~20–30% recurring cash flow; FX swings >20% can disrupt margins.
| Metric | 2023/24 |
|---|---|
| Capex (onshore) | USD 1.2–1.4m/MW |
| Sustainable issuance | USD 600bn (2024) |
| China HRC | 4,800 CNY/t (2024) |
| Copper | USD 9,000/t (2024) |
| EU ETS | ≈€90/t (late 2024) |
| Aftermarket rev. | +20–30% |
What You See Is What You Get
Goldwind PESTLE Analysis
The preview shown here is the exact Goldwind PESTLE Analysis document you’ll receive after purchase—fully formatted and ready to use. This is a real snapshot of the product, delivered exactly as displayed with no placeholders. The structure, content, and layout are final and downloadable immediately after payment.

Plan Smarter. Present Sharper. Compete Stronger.
Gain a strategic advantage with our PESTLE Analysis of Goldwind—three concise sections reveal how political, economic, social, technological, legal, and environmental forces shape its outlook and risks. Ideal for investors and strategists seeking clear, actionable intelligence. Purchase the full report to access detailed insights, data-driven scenarios, and ready-to-use slides for immediate decision-making.
Political factors
Renewable subsidies
Government incentives such as feed-in tariffs and tax credits remain primary drivers of wind project economics and turbine demand, and policy stability reduces revenue volatility to encourage long-term procurement that benefits top-three OEMs like Goldwind. Sudden subsidy cuts or auction redesigns have repeatedly delayed orders and compressed margins across markets, forcing manufacturers to defer deliveries and renegotiate contracts. Goldwind must align its sales pipeline and financing assumptions with evolving support schemes in key markets to preserve margins and order flow.
Energy security agendas
Many countries prioritize domestic renewables to cut imported fuels, with the EU target of at least 42.5% renewables by 2030 and US clean-energy incentives under the Inflation Reduction Act (~$369 billion) driving policy. That raises the strategic value of wind deployment and grid integration, unlocking fast-track permitting and grid buildout in several markets. Goldwind benefits where wind is central to security strategies but must navigate diverse local content and procurement rules.
Geopolitical trade dynamics
Tariffs, export controls (tightened by the US since 2022) and sanctions on Russia have already disrupted component flows and market access for wind suppliers; US Inflation Reduction Act rules mean up to 30% clean-energy tax credit requires North American final assembly. Localization mandates in the EU and US are pushing regional footprints, while currency and logistics pressures rise in tense trade periods. Goldwind needs diversified suppliers and multi-hub production to hedge geopolitical risk.
Infrastructure and grid policy
Transmission planning and interconnection rules (US interconnection backlog ~1,000 GW as of 2024; China curtailment down to 6.6% in 2023 per NEA) directly affect Goldwind project timing and ROI, while priority dispatch/curtailment policies determine realized capacity factors and revenue certainty. Emerging grid-forming and ancillary-service specs (adopted by key ISOs 2022–24) force turbine design changes and add CAPEX. Proactive policy engagement lets Goldwind align R&D and product roadmaps with evolving grid codes.
- Transmission queues: ~1,000 GW backlog (US, 2024)
- Curtailment: China 6.6% (NEA, 2023)
- Grid-forming: ISOs issued guidance 2022–24
- Policy engagement: critical for product-market fit
Public procurement and auctions
Competitive tenders increasingly set price expectations and volume visibility for wind projects, while auction design elements—price caps, indexation and penalties—directly shape developer appetite and turbine specifications. Local preference criteria in many 2024-25 auctions tilt awards toward domestic suppliers or local content. Goldwind must ensure bankable technology and LCOE leadership to make customers auction-ready.
- Price signals: drive procurement
- Auction rules: alter specs and risk
- Local preference: affects award share
- Goldwind: focus on bankability and low LCOE
Incentives and localization raise order visibility; grid backlogs and subsidy cuts threaten timing
Policy stability and incentives (US IRA ~$369bn; EU renewables target 42.5% by 2030) drive Goldwind order visibility and margins, while sudden subsidy cuts compress demand. Trade measures and localization (IRA sourcing rules) force regional production and supply diversification. Grid constraints (US ~1,000 GW interconnection backlog 2024; China curtailment 6.6% 2023) affect project timing and CF.
| Factor | Metric | Year/Source |
|---|---|---|
| US incentives | $369bn | IRA, 2022–24 |
| EU renewables | 42.5% by 2030 | EU, 2023 |
| US queue | ~1,000 GW | 2024 |
| China curtailment | 6.6% | NEA, 2023 |
What is included in the product
Detailed Word Document
Explores how macro-environmental factors uniquely affect Goldwind across Political, Economic, Social, Technological, Environmental, and Legal dimensions, with each section supported by data and current trends to highlight risks and opportunities. Designed for executives, consultants, and investors, it offers forward-looking insights and actionable examples tailored to Goldwind's market, regulatory landscape, and competitive dynamics.
Customizable Excel Spreadsheet
A concise, visually segmented Goldwind PESTLE summary that’s editable and shareable, enabling quick risk discussions, alignment across teams, and seamless inclusion in presentations or reports.
Economic factors
Interest rates and financing
Wind projects are capital intensive (onshore capex ~USD 1.2–1.4m/MW) and a 100–200bps rise in cost of capital can raise LCOE materially, delay FIDs and compress turbine pricing margins. Improved inflation-indexed PPAs and growth in green debt markets (sustainable issuance ~USD 600bn in 2024) can offset headwinds. Goldwind mitigates risk by bundling finance solutions and performance guarantees, supporting project bankability and reducing WACC for clients.
Commodity and input costs
Steel (China HRC avg ~4,800 CNY/ton in 2024), copper (~9,000 USD/ton in 2024) and rare earths for magnets drive a large share of turbine BOM and logistics add 5–10% to project costs; volatility forced OEMs into hedging, long‑term supply contracts and design optimization. Cost inflation on fixed‑price deals can compress margins, so Goldwind leverages supply‑chain scale and modular designs to lower per‑unit exposure.
Currency fluctuations
Goldwind, a top-three global wind-turbine manufacturer operating in over 30 countries, faces FX risk as revenues and costs are booked in multiple currencies, exposing margins to exchange swings.
Sharp devaluations in key customer markets—where currency moves can exceed 20% in a year—can delay imports and payments, disrupting project cashflows.
Natural hedges, local-currency pricing and robust treasury operations with FX clauses in EPC and supply contracts are essential to stabilize margins and limit translation risk.
Global demand cycles
Global wind deployment tracks economic growth, power demand (global electricity demand rose about 2.5% in 2023, IEA) and carbon prices (EU ETS ~€90/t by late 2024), so booms can strain turbines and components while downturns drive price competition. Goldwind’s diversified geographic exposure smooths regional cycles, and service plus repowering businesses provide countercyclical revenue buffers.
- Deployment linked to GDP, electricity demand +2.5% (2023)
- Carbon price signal: EU ETS ≈ €90/t (late 2024)
- Diversification reduces volatility
- Service/repowering = countercyclical revenue
Scale and learning curves
Scale in turbine size and manufacturing lowers unit costs for Goldwind, while experience curves from high-volume production and iterative design drive efficiency gains and shorter ramp times; industry benchmarks show lifecycle service revenues can add roughly 20-30 percent to project cash flow.
- Large turbines reduce LCOE
- High volume improves learning rates
- Aftermarket boosts recurring cash flow
- End-to-end model captures multiple margins
Incentives and localization raise order visibility; grid backlogs and subsidy cuts threaten timing
Wind capex ~USD 1.2–1.4m/MW; 100–200bps CoC rise raises LCOE and delays FIDs. Sustainable issuance ~USD 600bn (2024) and inflation‑linked PPAs improve bankability. Key inputs: China HRC ~4,800 CNY/t (2024), copper ~USD 9,000/t (2024); EU ETS ~€90/t (late 2024). Aftermarket adds ~20–30% recurring cash flow; FX swings >20% can disrupt margins.
| Metric | 2023/24 |
|---|---|
| Capex (onshore) | USD 1.2–1.4m/MW |
| Sustainable issuance | USD 600bn (2024) |
| China HRC | 4,800 CNY/t (2024) |
| Copper | USD 9,000/t (2024) |
| EU ETS | ≈€90/t (late 2024) |
| Aftermarket rev. | +20–30% |
What You See Is What You Get
Goldwind PESTLE Analysis
The preview shown here is the exact Goldwind PESTLE Analysis document you’ll receive after purchase—fully formatted and ready to use. This is a real snapshot of the product, delivered exactly as displayed with no placeholders. The structure, content, and layout are final and downloadable immediately after payment.
Description
Plan Smarter. Present Sharper. Compete Stronger.
Gain a strategic advantage with our PESTLE Analysis of Goldwind—three concise sections reveal how political, economic, social, technological, legal, and environmental forces shape its outlook and risks. Ideal for investors and strategists seeking clear, actionable intelligence. Purchase the full report to access detailed insights, data-driven scenarios, and ready-to-use slides for immediate decision-making.
Political factors
Renewable subsidies
Government incentives such as feed-in tariffs and tax credits remain primary drivers of wind project economics and turbine demand, and policy stability reduces revenue volatility to encourage long-term procurement that benefits top-three OEMs like Goldwind. Sudden subsidy cuts or auction redesigns have repeatedly delayed orders and compressed margins across markets, forcing manufacturers to defer deliveries and renegotiate contracts. Goldwind must align its sales pipeline and financing assumptions with evolving support schemes in key markets to preserve margins and order flow.
Energy security agendas
Many countries prioritize domestic renewables to cut imported fuels, with the EU target of at least 42.5% renewables by 2030 and US clean-energy incentives under the Inflation Reduction Act (~$369 billion) driving policy. That raises the strategic value of wind deployment and grid integration, unlocking fast-track permitting and grid buildout in several markets. Goldwind benefits where wind is central to security strategies but must navigate diverse local content and procurement rules.
Geopolitical trade dynamics
Tariffs, export controls (tightened by the US since 2022) and sanctions on Russia have already disrupted component flows and market access for wind suppliers; US Inflation Reduction Act rules mean up to 30% clean-energy tax credit requires North American final assembly. Localization mandates in the EU and US are pushing regional footprints, while currency and logistics pressures rise in tense trade periods. Goldwind needs diversified suppliers and multi-hub production to hedge geopolitical risk.
Infrastructure and grid policy
Transmission planning and interconnection rules (US interconnection backlog ~1,000 GW as of 2024; China curtailment down to 6.6% in 2023 per NEA) directly affect Goldwind project timing and ROI, while priority dispatch/curtailment policies determine realized capacity factors and revenue certainty. Emerging grid-forming and ancillary-service specs (adopted by key ISOs 2022–24) force turbine design changes and add CAPEX. Proactive policy engagement lets Goldwind align R&D and product roadmaps with evolving grid codes.
- Transmission queues: ~1,000 GW backlog (US, 2024)
- Curtailment: China 6.6% (NEA, 2023)
- Grid-forming: ISOs issued guidance 2022–24
- Policy engagement: critical for product-market fit
Public procurement and auctions
Competitive tenders increasingly set price expectations and volume visibility for wind projects, while auction design elements—price caps, indexation and penalties—directly shape developer appetite and turbine specifications. Local preference criteria in many 2024-25 auctions tilt awards toward domestic suppliers or local content. Goldwind must ensure bankable technology and LCOE leadership to make customers auction-ready.
- Price signals: drive procurement
- Auction rules: alter specs and risk
- Local preference: affects award share
- Goldwind: focus on bankability and low LCOE
Incentives and localization raise order visibility; grid backlogs and subsidy cuts threaten timing
Policy stability and incentives (US IRA ~$369bn; EU renewables target 42.5% by 2030) drive Goldwind order visibility and margins, while sudden subsidy cuts compress demand. Trade measures and localization (IRA sourcing rules) force regional production and supply diversification. Grid constraints (US ~1,000 GW interconnection backlog 2024; China curtailment 6.6% 2023) affect project timing and CF.
| Factor | Metric | Year/Source |
|---|---|---|
| US incentives | $369bn | IRA, 2022–24 |
| EU renewables | 42.5% by 2030 | EU, 2023 |
| US queue | ~1,000 GW | 2024 |
| China curtailment | 6.6% | NEA, 2023 |
What is included in the product
Detailed Word Document
Explores how macro-environmental factors uniquely affect Goldwind across Political, Economic, Social, Technological, Environmental, and Legal dimensions, with each section supported by data and current trends to highlight risks and opportunities. Designed for executives, consultants, and investors, it offers forward-looking insights and actionable examples tailored to Goldwind's market, regulatory landscape, and competitive dynamics.
Customizable Excel Spreadsheet
A concise, visually segmented Goldwind PESTLE summary that’s editable and shareable, enabling quick risk discussions, alignment across teams, and seamless inclusion in presentations or reports.
Economic factors
Interest rates and financing
Wind projects are capital intensive (onshore capex ~USD 1.2–1.4m/MW) and a 100–200bps rise in cost of capital can raise LCOE materially, delay FIDs and compress turbine pricing margins. Improved inflation-indexed PPAs and growth in green debt markets (sustainable issuance ~USD 600bn in 2024) can offset headwinds. Goldwind mitigates risk by bundling finance solutions and performance guarantees, supporting project bankability and reducing WACC for clients.
Commodity and input costs
Steel (China HRC avg ~4,800 CNY/ton in 2024), copper (~9,000 USD/ton in 2024) and rare earths for magnets drive a large share of turbine BOM and logistics add 5–10% to project costs; volatility forced OEMs into hedging, long‑term supply contracts and design optimization. Cost inflation on fixed‑price deals can compress margins, so Goldwind leverages supply‑chain scale and modular designs to lower per‑unit exposure.
Currency fluctuations
Goldwind, a top-three global wind-turbine manufacturer operating in over 30 countries, faces FX risk as revenues and costs are booked in multiple currencies, exposing margins to exchange swings.
Sharp devaluations in key customer markets—where currency moves can exceed 20% in a year—can delay imports and payments, disrupting project cashflows.
Natural hedges, local-currency pricing and robust treasury operations with FX clauses in EPC and supply contracts are essential to stabilize margins and limit translation risk.
Global demand cycles
Global wind deployment tracks economic growth, power demand (global electricity demand rose about 2.5% in 2023, IEA) and carbon prices (EU ETS ~€90/t by late 2024), so booms can strain turbines and components while downturns drive price competition. Goldwind’s diversified geographic exposure smooths regional cycles, and service plus repowering businesses provide countercyclical revenue buffers.
- Deployment linked to GDP, electricity demand +2.5% (2023)
- Carbon price signal: EU ETS ≈ €90/t (late 2024)
- Diversification reduces volatility
- Service/repowering = countercyclical revenue
Scale and learning curves
Scale in turbine size and manufacturing lowers unit costs for Goldwind, while experience curves from high-volume production and iterative design drive efficiency gains and shorter ramp times; industry benchmarks show lifecycle service revenues can add roughly 20-30 percent to project cash flow.
- Large turbines reduce LCOE
- High volume improves learning rates
- Aftermarket boosts recurring cash flow
- End-to-end model captures multiple margins
Incentives and localization raise order visibility; grid backlogs and subsidy cuts threaten timing
Wind capex ~USD 1.2–1.4m/MW; 100–200bps CoC rise raises LCOE and delays FIDs. Sustainable issuance ~USD 600bn (2024) and inflation‑linked PPAs improve bankability. Key inputs: China HRC ~4,800 CNY/t (2024), copper ~USD 9,000/t (2024); EU ETS ~€90/t (late 2024). Aftermarket adds ~20–30% recurring cash flow; FX swings >20% can disrupt margins.
| Metric | 2023/24 |
|---|---|
| Capex (onshore) | USD 1.2–1.4m/MW |
| Sustainable issuance | USD 600bn (2024) |
| China HRC | 4,800 CNY/t (2024) |
| Copper | USD 9,000/t (2024) |
| EU ETS | ≈€90/t (late 2024) |
| Aftermarket rev. | +20–30% |
What You See Is What You Get
Goldwind PESTLE Analysis
The preview shown here is the exact Goldwind PESTLE Analysis document you’ll receive after purchase—fully formatted and ready to use. This is a real snapshot of the product, delivered exactly as displayed with no placeholders. The structure, content, and layout are final and downloadable immediately after payment.











