Goodman Group PESTLE Analysis

Your Competitive Advantage Starts with This Report
Our PESTLE Analysis for Goodman Group distils the political, economic, social, technological, legal and environmental forces shaping its logistics and industrial property strategy, revealing key risks and growth levers. Tailored for investors and strategists, it highlights regulatory exposures, macro trends and innovation drivers that will affect valuation and expansion. Purchase the full report to get the complete, actionable breakdown and ready-to-use data.
Political factors

Geopolitical trade and supply chain policies
Trade tensions, tariffs and reshoring incentives—highlighted by the US CHIPS Act (~US$280bn)—are shifting demand toward logistics real estate near ports, airports and consumption hubs as global e-commerce topped roughly US$5.7tn in 2023. Government supply-chain resilience programs are accelerating warehouse development in priority corridors, while sanctions or export controls can dampen tenant activity in affected sectors. Goodman must align its pipeline with evolving trade routes and policy-backed infrastructure.
Infrastructure spending and public investment
National and local infrastructure programs (roads, rail, ports, inland hubs) directly lift site attractiveness and rental growth for Goodman, supported by its FY24 funds under management of about A$84bn; public-private partnerships enable strategic brownfield conversions to logistics use. Delays or cutbacks in funded transport upgrades can impair access and reduce asset values. Proactive engagement with planners helps sequence projects with committed transport upgrades to protect rental upside.

Zoning, land-use, and permitting regimes
Zoning, land-use and permitting — industrial zoning approvals, height limits, truck-access rules and community approvals — drive timeline and cost certainty; permitting commonly adds 6–24 months to projects and community benefit/design requirements now frequently add 1–5% to development cost. Prolonged entitlements can tighten supply while delaying cash flows; early stakeholder engagement and flexible design cut entitlement risk.

Fiscal and incentive frameworks
Fiscal and incentive frameworks materially shift Goodman Group project IRRs: property tax regimes and development charges can add 5–20% to land/project costs, while green building incentives (eg. Australia NSW grants, EU subsidies) and NABERS/NZEB premiums can lift IRRs by 1–3%. OECD Pillar Two minimum tax (15% from 2024) and cross-border withholding changes can redirect capital; TIF/abatements in US infill projects commonly add 300–600 basis points to feasibility.
- Property tax & charges: +5–20% cost impact
- Green incentives: +1–3% IRR uplift
- TIF/abatements: +3–6% IRR
- Pillar Two/withholding: alters fund flows, affects REIT returns
- Policy instability: +50–100 bps cap‑rate volatility
Political stability and regulatory predictability
Stable governments and clear policy cycles compress risk premiums and cap rates — Australian 10-year bond yields averaged around 4.2% in 2024, lowering borrowing costs relevant to Goodman’s cap rate assumptions. Elections can reset priorities on industrial land, immigration and climate programs; populist or protectionist swings may disrupt tenant expansion plans. Geographic diversification across APAC, Europe and the US mitigates policy volatility; Goodman’s global portfolio (~A$45bn market cap mid-2025) spreads exposure.
- Lower yields ≈ lower cap rates
- Elections reset land, immigration, climate policy
- Populism risks tenant expansion
- Regional diversification mitigates volatility
Reshoring lifts near-port logistics; e-commerce US$5.7tn, FUM A$84bn
Trade/reshoring shifts demand to near‑port logistics; CHIPS/resilience programs and US$5.7tn e‑commerce (2023) boost corridors. Infrastructure/PPPs lift site value; FUM A$84bn (FY24). Zoning, taxes and incentives swing IRRs (property +5–20%; green +1–3%); political cycles move cap‑rates (AU 10yr ~4.2% 2024).
| Factor | Impact | Data |
|---|---|---|
| Trade | Demand | US$5.7tn 2023 |
| Infra | Value | FUM A$84bn |
| Policy | IRR/cap‑rate | +5–20% cost; AU 10yr 4.2% |
What is included in the product
 Detailed Word Document
Explores how Political, Economic, Social, Technological, Environmental and Legal forces uniquely affect Goodman Group, with data-backed insights and region-specific trends. Designed for executives and investors, it highlights threats, opportunities and forward-looking scenarios to inform strategy and funding decisions.

 Customizable Excel Spreadsheet
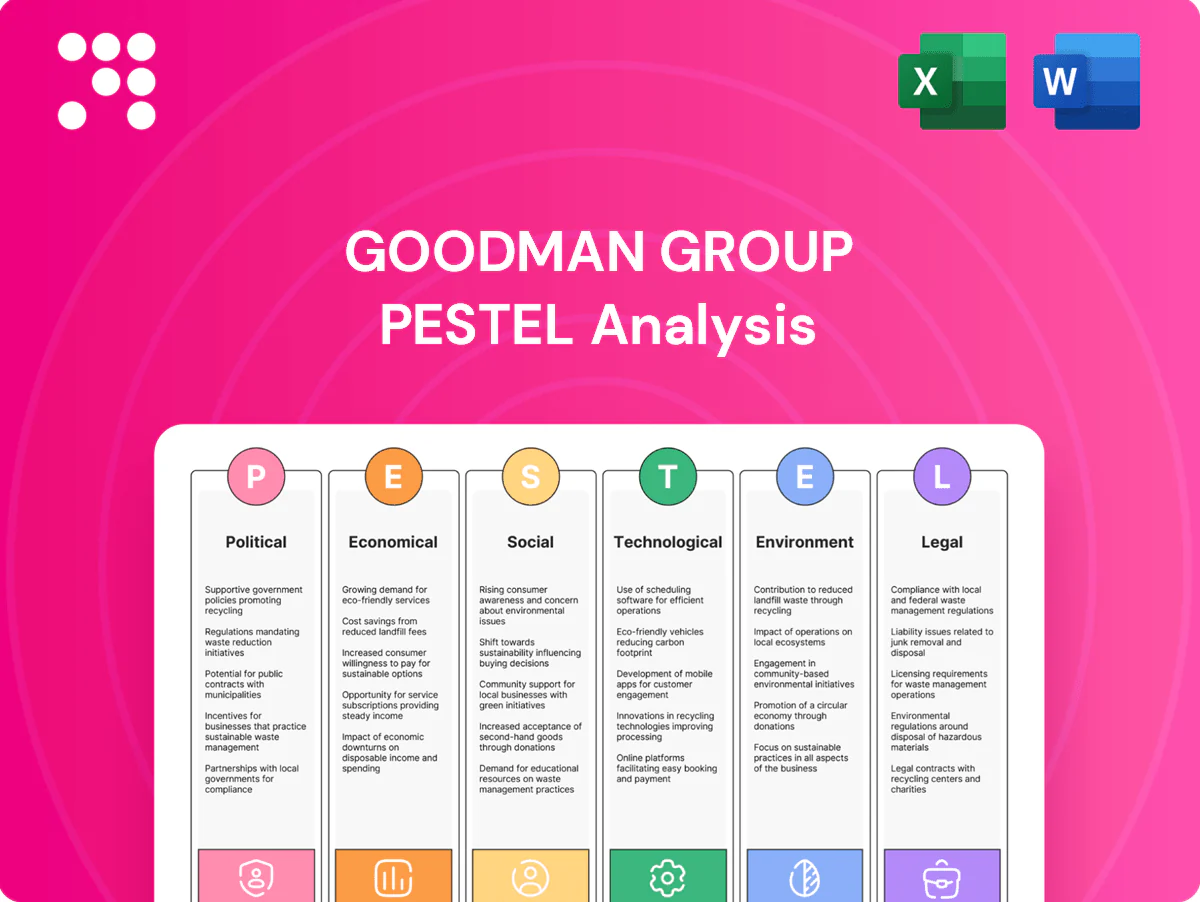
A concise, visually segmented PESTLE summary of Goodman Group that eases meeting prep, supports external risk and market-positioning discussions, is easily shared or dropped into presentations, and editable for region- or business-line–specific notes.
Economic factors

Interest rates and cap rate dynamics
Financing costs directly influence development yields and valuations; with the RBA cash rate around 4.35% and US 10y near 4.2% in mid-2025, borrowing costs are higher. Rising rates typically push cap rates up; industrial cap rates have widened roughly 100–150bps since 2021, pressuring NAV and recycling decisions. Access to low-cost capital supports speculative builds and pre-lease strategies, while active hedging and staggered debt maturities manage rate risk.
E-commerce growth and omnichannel logistics
Global e-commerce penetration reached about 25% of retail sales in 2024, driving strong demand for last-mile and regional distribution centers as retailers and 3PLs seek larger, higher-spec warehouses near consumers. Cyclicality in retail sales can modulate leasing velocity, but ultra-low industrial vacancy in major markets (around 1–2% in 2024) and prime logistics rent growth (~7% in 2024) help location quality and building functionality sustain rent outperformance through cycles.

Macro growth, inflation, and labor markets
Moderate GDP growth (IMF 2024 Australia forecast 1.6%) and inventory normalisation are reshaping tenants toward right-sized logistics space. Construction inflation—Rawlinsons and industry reports show building costs up roughly 7–9% YoY in 2023–24—raises replacement costs, supporting rents but squeezing development margins. Tight labour markets (ABS unemployment ~3.7% mid‑2024) push tenants to automation-ready facilities. Index-linked leases help preserve real income in high-inflation periods (~4% CPI 2024).

Global capital flows into logistics real estate
Institutional allocations to core logistics underpin liquidity and joint-development deals for Goodman, while global e-commerce (≈US$5.7 trillion in 2023) sustains demand; currency moves (AUD vs USD/EUR) influence cross-border investor returns and timing, and market dislocations in 2022–24 opened acquisition windows at higher yields; robust asset management supports stable cash generation for Goodman-managed vehicles.
- Institutional allocations: support liquidity
- US$5.7T e‑commerce: demand driver
- FX swings: affect cross-border returns
- Dislocations 2022–24: acquisition opportunities
- Asset management: stabilises cashflow
Tenant credit quality and sector diversification
Goodman’s diversified exposure across 3PL, retail, FMCG, manufacturing and healthcare cushions cash flow volatility, with FY24 portfolio WALE ~6.5 years and built-in escalations improving earnings visibility; active tenant monitoring limited rent arrears to low single digits in 2024 and reduces default/downtime risk; a balanced spec-to-suit pipeline aligns leasing risk with cycle conditions.
- WALE: ~6.5 years (FY24)
- Sector mix: 3PL/retail/FMCG/manufacturing/healthcare
- Low arrears (FY24)
- Spec-to-suit balance reduces cyclical leasing risk
Reshoring lifts near-port logistics; e-commerce US$5.7tn, FUM A$84bn
Higher global rates (RBA ~4.35% mid‑2025; US 10y ~4.2%) lift borrowing costs and cap rates, pressuring NAV and development margins; tight industrial vacancy (~1–2% 2024) and rent growth (~7% 2024) sustain income; moderate GDP (Australia IMF 2024 est 1.6%) and inventory normalisation shift demand to right-sized, automation-ready logistics; FY24 WALE ~6.5y improves cashflow visibility.
| Metric | Value |
|---|---|
| RBA cash rate | ~4.35% (mid‑2025) |
| US 10y | ~4.2% (mid‑2025) |
| Australia GDP | 1.6% (IMF 2024) |
| CPI | ~4% (2024) |
| Industrial vacancy | ~1–2% (2024) |
| Prime rent growth | ~7% (2024) |
| WALE (Goodman) | ~6.5 yrs (FY24) |
Full Version Awaits
Goodman Group PESTLE Analysis
The Goodman Group PESTLE Analysis preview shown here is the exact document you’ll receive after purchase—fully formatted and ready to use. It contains the complete political, economic, social, technological, legal and environmental assessment. No placeholders or teasers—this is the final, downloadable file.

Your Competitive Advantage Starts with This Report
Our PESTLE Analysis for Goodman Group distils the political, economic, social, technological, legal and environmental forces shaping its logistics and industrial property strategy, revealing key risks and growth levers. Tailored for investors and strategists, it highlights regulatory exposures, macro trends and innovation drivers that will affect valuation and expansion. Purchase the full report to get the complete, actionable breakdown and ready-to-use data.
Political factors
Geopolitical trade and supply chain policies
Trade tensions, tariffs and reshoring incentives—highlighted by the US CHIPS Act (~US$280bn)—are shifting demand toward logistics real estate near ports, airports and consumption hubs as global e-commerce topped roughly US$5.7tn in 2023. Government supply-chain resilience programs are accelerating warehouse development in priority corridors, while sanctions or export controls can dampen tenant activity in affected sectors. Goodman must align its pipeline with evolving trade routes and policy-backed infrastructure.
Infrastructure spending and public investment
National and local infrastructure programs (roads, rail, ports, inland hubs) directly lift site attractiveness and rental growth for Goodman, supported by its FY24 funds under management of about A$84bn; public-private partnerships enable strategic brownfield conversions to logistics use. Delays or cutbacks in funded transport upgrades can impair access and reduce asset values. Proactive engagement with planners helps sequence projects with committed transport upgrades to protect rental upside.
Zoning, land-use, and permitting regimes
Zoning, land-use and permitting — industrial zoning approvals, height limits, truck-access rules and community approvals — drive timeline and cost certainty; permitting commonly adds 6–24 months to projects and community benefit/design requirements now frequently add 1–5% to development cost. Prolonged entitlements can tighten supply while delaying cash flows; early stakeholder engagement and flexible design cut entitlement risk.
Fiscal and incentive frameworks
Fiscal and incentive frameworks materially shift Goodman Group project IRRs: property tax regimes and development charges can add 5–20% to land/project costs, while green building incentives (eg. Australia NSW grants, EU subsidies) and NABERS/NZEB premiums can lift IRRs by 1–3%. OECD Pillar Two minimum tax (15% from 2024) and cross-border withholding changes can redirect capital; TIF/abatements in US infill projects commonly add 300–600 basis points to feasibility.
- Property tax & charges: +5–20% cost impact
- Green incentives: +1–3% IRR uplift
- TIF/abatements: +3–6% IRR
- Pillar Two/withholding: alters fund flows, affects REIT returns
- Policy instability: +50–100 bps cap‑rate volatility
Political stability and regulatory predictability
Stable governments and clear policy cycles compress risk premiums and cap rates — Australian 10-year bond yields averaged around 4.2% in 2024, lowering borrowing costs relevant to Goodman’s cap rate assumptions. Elections can reset priorities on industrial land, immigration and climate programs; populist or protectionist swings may disrupt tenant expansion plans. Geographic diversification across APAC, Europe and the US mitigates policy volatility; Goodman’s global portfolio (~A$45bn market cap mid-2025) spreads exposure.
- Lower yields ≈ lower cap rates
- Elections reset land, immigration, climate policy
- Populism risks tenant expansion
- Regional diversification mitigates volatility
Reshoring lifts near-port logistics; e-commerce US$5.7tn, FUM A$84bn
Trade/reshoring shifts demand to near‑port logistics; CHIPS/resilience programs and US$5.7tn e‑commerce (2023) boost corridors. Infrastructure/PPPs lift site value; FUM A$84bn (FY24). Zoning, taxes and incentives swing IRRs (property +5–20%; green +1–3%); political cycles move cap‑rates (AU 10yr ~4.2% 2024).
| Factor | Impact | Data |
|---|---|---|
| Trade | Demand | US$5.7tn 2023 |
| Infra | Value | FUM A$84bn |
| Policy | IRR/cap‑rate | +5–20% cost; AU 10yr 4.2% |
What is included in the product
Detailed Word Document
Explores how Political, Economic, Social, Technological, Environmental and Legal forces uniquely affect Goodman Group, with data-backed insights and region-specific trends. Designed for executives and investors, it highlights threats, opportunities and forward-looking scenarios to inform strategy and funding decisions.
Customizable Excel Spreadsheet
A concise, visually segmented PESTLE summary of Goodman Group that eases meeting prep, supports external risk and market-positioning discussions, is easily shared or dropped into presentations, and editable for region- or business-line–specific notes.
Economic factors
Interest rates and cap rate dynamics
Financing costs directly influence development yields and valuations; with the RBA cash rate around 4.35% and US 10y near 4.2% in mid-2025, borrowing costs are higher. Rising rates typically push cap rates up; industrial cap rates have widened roughly 100–150bps since 2021, pressuring NAV and recycling decisions. Access to low-cost capital supports speculative builds and pre-lease strategies, while active hedging and staggered debt maturities manage rate risk.
E-commerce growth and omnichannel logistics
Global e-commerce penetration reached about 25% of retail sales in 2024, driving strong demand for last-mile and regional distribution centers as retailers and 3PLs seek larger, higher-spec warehouses near consumers. Cyclicality in retail sales can modulate leasing velocity, but ultra-low industrial vacancy in major markets (around 1–2% in 2024) and prime logistics rent growth (~7% in 2024) help location quality and building functionality sustain rent outperformance through cycles.
Macro growth, inflation, and labor markets
Moderate GDP growth (IMF 2024 Australia forecast 1.6%) and inventory normalisation are reshaping tenants toward right-sized logistics space. Construction inflation—Rawlinsons and industry reports show building costs up roughly 7–9% YoY in 2023–24—raises replacement costs, supporting rents but squeezing development margins. Tight labour markets (ABS unemployment ~3.7% mid‑2024) push tenants to automation-ready facilities. Index-linked leases help preserve real income in high-inflation periods (~4% CPI 2024).
Global capital flows into logistics real estate
Institutional allocations to core logistics underpin liquidity and joint-development deals for Goodman, while global e-commerce (≈US$5.7 trillion in 2023) sustains demand; currency moves (AUD vs USD/EUR) influence cross-border investor returns and timing, and market dislocations in 2022–24 opened acquisition windows at higher yields; robust asset management supports stable cash generation for Goodman-managed vehicles.
- Institutional allocations: support liquidity
- US$5.7T e‑commerce: demand driver
- FX swings: affect cross-border returns
- Dislocations 2022–24: acquisition opportunities
- Asset management: stabilises cashflow
Tenant credit quality and sector diversification
Goodman’s diversified exposure across 3PL, retail, FMCG, manufacturing and healthcare cushions cash flow volatility, with FY24 portfolio WALE ~6.5 years and built-in escalations improving earnings visibility; active tenant monitoring limited rent arrears to low single digits in 2024 and reduces default/downtime risk; a balanced spec-to-suit pipeline aligns leasing risk with cycle conditions.
- WALE: ~6.5 years (FY24)
- Sector mix: 3PL/retail/FMCG/manufacturing/healthcare
- Low arrears (FY24)
- Spec-to-suit balance reduces cyclical leasing risk
Reshoring lifts near-port logistics; e-commerce US$5.7tn, FUM A$84bn
Higher global rates (RBA ~4.35% mid‑2025; US 10y ~4.2%) lift borrowing costs and cap rates, pressuring NAV and development margins; tight industrial vacancy (~1–2% 2024) and rent growth (~7% 2024) sustain income; moderate GDP (Australia IMF 2024 est 1.6%) and inventory normalisation shift demand to right-sized, automation-ready logistics; FY24 WALE ~6.5y improves cashflow visibility.
| Metric | Value |
|---|---|
| RBA cash rate | ~4.35% (mid‑2025) |
| US 10y | ~4.2% (mid‑2025) |
| Australia GDP | 1.6% (IMF 2024) |
| CPI | ~4% (2024) |
| Industrial vacancy | ~1–2% (2024) |
| Prime rent growth | ~7% (2024) |
| WALE (Goodman) | ~6.5 yrs (FY24) |
Full Version Awaits
Goodman Group PESTLE Analysis
The Goodman Group PESTLE Analysis preview shown here is the exact document you’ll receive after purchase—fully formatted and ready to use. It contains the complete political, economic, social, technological, legal and environmental assessment. No placeholders or teasers—this is the final, downloadable file.
Original: $10.00
-65%$10.00
$3.50Description
Your Competitive Advantage Starts with This Report
Our PESTLE Analysis for Goodman Group distils the political, economic, social, technological, legal and environmental forces shaping its logistics and industrial property strategy, revealing key risks and growth levers. Tailored for investors and strategists, it highlights regulatory exposures, macro trends and innovation drivers that will affect valuation and expansion. Purchase the full report to get the complete, actionable breakdown and ready-to-use data.
Political factors
Geopolitical trade and supply chain policies
Trade tensions, tariffs and reshoring incentives—highlighted by the US CHIPS Act (~US$280bn)—are shifting demand toward logistics real estate near ports, airports and consumption hubs as global e-commerce topped roughly US$5.7tn in 2023. Government supply-chain resilience programs are accelerating warehouse development in priority corridors, while sanctions or export controls can dampen tenant activity in affected sectors. Goodman must align its pipeline with evolving trade routes and policy-backed infrastructure.
Infrastructure spending and public investment
National and local infrastructure programs (roads, rail, ports, inland hubs) directly lift site attractiveness and rental growth for Goodman, supported by its FY24 funds under management of about A$84bn; public-private partnerships enable strategic brownfield conversions to logistics use. Delays or cutbacks in funded transport upgrades can impair access and reduce asset values. Proactive engagement with planners helps sequence projects with committed transport upgrades to protect rental upside.
Zoning, land-use, and permitting regimes
Zoning, land-use and permitting — industrial zoning approvals, height limits, truck-access rules and community approvals — drive timeline and cost certainty; permitting commonly adds 6–24 months to projects and community benefit/design requirements now frequently add 1–5% to development cost. Prolonged entitlements can tighten supply while delaying cash flows; early stakeholder engagement and flexible design cut entitlement risk.
Fiscal and incentive frameworks
Fiscal and incentive frameworks materially shift Goodman Group project IRRs: property tax regimes and development charges can add 5–20% to land/project costs, while green building incentives (eg. Australia NSW grants, EU subsidies) and NABERS/NZEB premiums can lift IRRs by 1–3%. OECD Pillar Two minimum tax (15% from 2024) and cross-border withholding changes can redirect capital; TIF/abatements in US infill projects commonly add 300–600 basis points to feasibility.
- Property tax & charges: +5–20% cost impact
- Green incentives: +1–3% IRR uplift
- TIF/abatements: +3–6% IRR
- Pillar Two/withholding: alters fund flows, affects REIT returns
- Policy instability: +50–100 bps cap‑rate volatility
Political stability and regulatory predictability
Stable governments and clear policy cycles compress risk premiums and cap rates — Australian 10-year bond yields averaged around 4.2% in 2024, lowering borrowing costs relevant to Goodman’s cap rate assumptions. Elections can reset priorities on industrial land, immigration and climate programs; populist or protectionist swings may disrupt tenant expansion plans. Geographic diversification across APAC, Europe and the US mitigates policy volatility; Goodman’s global portfolio (~A$45bn market cap mid-2025) spreads exposure.
- Lower yields ≈ lower cap rates
- Elections reset land, immigration, climate policy
- Populism risks tenant expansion
- Regional diversification mitigates volatility
Reshoring lifts near-port logistics; e-commerce US$5.7tn, FUM A$84bn
Trade/reshoring shifts demand to near‑port logistics; CHIPS/resilience programs and US$5.7tn e‑commerce (2023) boost corridors. Infrastructure/PPPs lift site value; FUM A$84bn (FY24). Zoning, taxes and incentives swing IRRs (property +5–20%; green +1–3%); political cycles move cap‑rates (AU 10yr ~4.2% 2024).
| Factor | Impact | Data |
|---|---|---|
| Trade | Demand | US$5.7tn 2023 |
| Infra | Value | FUM A$84bn |
| Policy | IRR/cap‑rate | +5–20% cost; AU 10yr 4.2% |
What is included in the product
Detailed Word Document
Explores how Political, Economic, Social, Technological, Environmental and Legal forces uniquely affect Goodman Group, with data-backed insights and region-specific trends. Designed for executives and investors, it highlights threats, opportunities and forward-looking scenarios to inform strategy and funding decisions.
Customizable Excel Spreadsheet
A concise, visually segmented PESTLE summary of Goodman Group that eases meeting prep, supports external risk and market-positioning discussions, is easily shared or dropped into presentations, and editable for region- or business-line–specific notes.
Economic factors
Interest rates and cap rate dynamics
Financing costs directly influence development yields and valuations; with the RBA cash rate around 4.35% and US 10y near 4.2% in mid-2025, borrowing costs are higher. Rising rates typically push cap rates up; industrial cap rates have widened roughly 100–150bps since 2021, pressuring NAV and recycling decisions. Access to low-cost capital supports speculative builds and pre-lease strategies, while active hedging and staggered debt maturities manage rate risk.
E-commerce growth and omnichannel logistics
Global e-commerce penetration reached about 25% of retail sales in 2024, driving strong demand for last-mile and regional distribution centers as retailers and 3PLs seek larger, higher-spec warehouses near consumers. Cyclicality in retail sales can modulate leasing velocity, but ultra-low industrial vacancy in major markets (around 1–2% in 2024) and prime logistics rent growth (~7% in 2024) help location quality and building functionality sustain rent outperformance through cycles.
Macro growth, inflation, and labor markets
Moderate GDP growth (IMF 2024 Australia forecast 1.6%) and inventory normalisation are reshaping tenants toward right-sized logistics space. Construction inflation—Rawlinsons and industry reports show building costs up roughly 7–9% YoY in 2023–24—raises replacement costs, supporting rents but squeezing development margins. Tight labour markets (ABS unemployment ~3.7% mid‑2024) push tenants to automation-ready facilities. Index-linked leases help preserve real income in high-inflation periods (~4% CPI 2024).
Global capital flows into logistics real estate
Institutional allocations to core logistics underpin liquidity and joint-development deals for Goodman, while global e-commerce (≈US$5.7 trillion in 2023) sustains demand; currency moves (AUD vs USD/EUR) influence cross-border investor returns and timing, and market dislocations in 2022–24 opened acquisition windows at higher yields; robust asset management supports stable cash generation for Goodman-managed vehicles.
- Institutional allocations: support liquidity
- US$5.7T e‑commerce: demand driver
- FX swings: affect cross-border returns
- Dislocations 2022–24: acquisition opportunities
- Asset management: stabilises cashflow
Tenant credit quality and sector diversification
Goodman’s diversified exposure across 3PL, retail, FMCG, manufacturing and healthcare cushions cash flow volatility, with FY24 portfolio WALE ~6.5 years and built-in escalations improving earnings visibility; active tenant monitoring limited rent arrears to low single digits in 2024 and reduces default/downtime risk; a balanced spec-to-suit pipeline aligns leasing risk with cycle conditions.
- WALE: ~6.5 years (FY24)
- Sector mix: 3PL/retail/FMCG/manufacturing/healthcare
- Low arrears (FY24)
- Spec-to-suit balance reduces cyclical leasing risk
Reshoring lifts near-port logistics; e-commerce US$5.7tn, FUM A$84bn
Higher global rates (RBA ~4.35% mid‑2025; US 10y ~4.2%) lift borrowing costs and cap rates, pressuring NAV and development margins; tight industrial vacancy (~1–2% 2024) and rent growth (~7% 2024) sustain income; moderate GDP (Australia IMF 2024 est 1.6%) and inventory normalisation shift demand to right-sized, automation-ready logistics; FY24 WALE ~6.5y improves cashflow visibility.
| Metric | Value |
|---|---|
| RBA cash rate | ~4.35% (mid‑2025) |
| US 10y | ~4.2% (mid‑2025) |
| Australia GDP | 1.6% (IMF 2024) |
| CPI | ~4% (2024) |
| Industrial vacancy | ~1–2% (2024) |
| Prime rent growth | ~7% (2024) |
| WALE (Goodman) | ~6.5 yrs (FY24) |
Full Version Awaits
Goodman Group PESTLE Analysis
The Goodman Group PESTLE Analysis preview shown here is the exact document you’ll receive after purchase—fully formatted and ready to use. It contains the complete political, economic, social, technological, legal and environmental assessment. No placeholders or teasers—this is the final, downloadable file.











