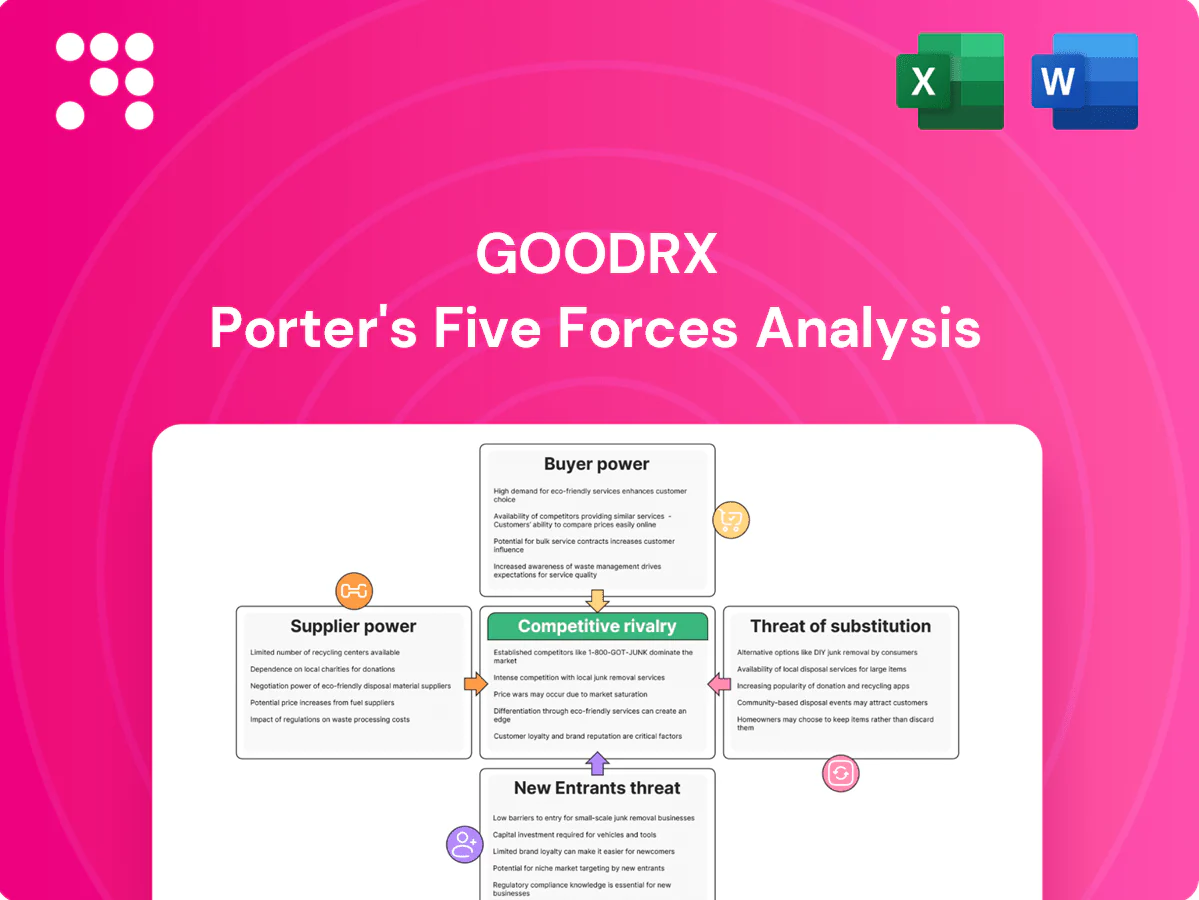
GoodRx Porter's Five Forces Analysis

Go Beyond the Preview—Access the Full Strategic Report
GoodRx faces intense buyer scrutiny, growing substitute threats from telehealth and PBMs, moderate supplier leverage, and rising regulatory and entrant pressures shaping its margins and growth.
This brief snapshot highlights core competitive dynamics but only scratches the surface of force interactions and strategic implications for GoodRx.
Unlock the full Porter's Five Forces Analysis to get force-by-force ratings, visuals, and actionable recommendations tailored to investment and strategy decisions.
Get a consultant-grade Word and Excel report to deploy immediately in due diligence, presentations, or strategic planning.
Suppliers Bargaining Power

Dependence on PBMs for rates
GoodRx’s discounts largely derive from PBM-negotiated pharmacy rates, and the three largest PBMs—CVS Caremark, Express Scripts, OptumRx—control roughly 80% of the US PBM market (2023–24), concentrating supplier power. Contract fee or term changes can compress GoodRx’s margins; PBMs that operate rival consumer brands may steer volume to their platforms, and renegotiations or terminations can quickly reduce coverage and economics.
Large pharmacy chains’ leverage
National chains such as CVS (about 9,900 U.S. locations in 2024), Walgreens (roughly 8,200) and Walmart (≈4,700 pharmacies) control large fill volumes and in-store execution, giving them significant bargaining power over GoodRx. If a chain restricts coupon acceptance or alters EHR/point-of-sale integrations, patient UX and prescription redemption rates decline. Chains can promote own discount programs (e.g., store-branded $4 lists), squeezing GoodRx margins, while store-level compliance variability creates operational friction and reconciliation costs.

Drug manufacturers and copay programs
Manufacturers influence net prices through copay cards, affordability programs, and list-price strategies, and generous manufacturer copay support can reduce insured patients reliance on GoodRx coupons. Manufacturers may tighten eligibility or data-sharing terms for partner access, directly affecting coupon availability. The 2023 Inflation Reduction Act cap of 35 on Medicare insulin highlights how policy and manufacturer programs reshape patient cost dynamics and GoodRx’s value proposition.

Telehealth clinician network and platforms
Supply of licensed clinicians for GoodRx telehealth directly shapes coverage, pricing, and quality; limited clinician availability raises wait times and drives up compensation as competing telehealth marketplaces bid for talent. Regulatory changes on prescribing and telehealth modalities can abruptly constrain clinician supply, while EMR/eRx integration costs create dependency and switching frictions for providers.
- Clinician supply → coverage, price, quality
- Market competition bids up pay
- Regulatory shifts pressure supply
- EMR/eRx integration adds dependency
Data, API, and POS integrations
Accurate, timely price feeds and POS acceptance for GoodRx depend on partner pharmacy and POS systems, with 60,000+ US retail pharmacy endpoints increasing integration complexity. API access limits, per-call data fees, and outages can materially degrade price transparency and user trust. Frequent pharmacy system updates require maintenance and certification, creating switching friction that gives suppliers negotiation leverage.
- 60,000+ retail pharmacy endpoints
- API limits/data fees risk price opacity
- Maintenance & certification cycles raise costs
- Technical dependence increases supplier leverage
PBM concentration (~80%) and 60,000+ endpoints pressure margins
GoodRx relies on three PBMs (~80% US PBM market 2023–24), major chains (CVS 9,900; Walgreens 8,200; Walmart 4,700 pharmacies in 2024) and manufacturers for copay support; contract, POS or clinician-supply shifts can quickly compress margins and coverage. 60,000+ retail pharmacy endpoints and API/data fees raise integration costs and supplier leverage.
| Metric | Value |
|---|---|
| Top PBM share | ~80% (2023–24) |
| Major chain pharmacies (2024) | CVS 9,900; Walgreens 8,200; Walmart 4,700 |
| Pharmacy endpoints | 60,000+ |
| Medicare insulin cap | $35 (2023) |
What is included in the product
 Detailed Word Document
Concise Porter's Five Forces overview for GoodRx that uncovers key competitive drivers, buyer and supplier power, substitute threats, and entry barriers shaping its pricing and profitability. Tailored strategic commentary highlights disruptive entrants, regulatory risks, and defensive advantages to inform investor, strategic, or academic use.

 Customizable Excel Spreadsheet
A concise one-sheet Porter's Five Forces for GoodRx that highlights competitive pressures and pain-point reliefs—ready to drop into decks; adjustable force levels and an instant radar chart visualize strategic risk so teams can act fast.
Customers Bargaining Power

Highly price-sensitive, low switching costs
Highly price-sensitive customers can compare coupon codes across apps within seconds and face minimal lock-in, allowing them to switch per prescription; this forces GoodRx to surface the best net price every time. The low switching costs amplify sensitivity to small price deltas, pressuring margin and promotional strategy. Continuous real-time price visibility in 2024 raises churn risk if competitors post slightly better discounts.
Multi-homing across rival discount cards
Users commonly multi-home across rival discount cards, trying a median of 2 options at checkout, which dilutes loyalty and reduces GoodRx’s ability to monetize repeat usage; GoodRx reported roughly $1.03 billion revenue in 2023, highlighting scale but not immunity to churn. Multi-homing forces sustained promotional and SEO spend to win transient clicks, shrinking marketing ROI. PBM arrangements face compressed take rates as price competition intensifies between platforms.

Prescriber influence and workflow fit
Physicians can actively steer patients toward specific pharmacies or discount methods by selecting default pharmacies or messaging at the point of care. With e-prescribing adoption in the US exceeding 90% per ONC 2024, defaults that favor insurer benefits or rival cards can sharply reduce GoodRx usage. Winning prescriber mindshare minimizes patient friction and boosts redemptions, while lack of integration forces extra steps that increase patient disengagement.

Insured vs uninsured dynamics
Insured users often only redeem GoodRx coupons when the discounted price undercuts their copay, reducing coupon use frequency, while uninsured and high-deductible plan holders—about 30% of the privately insured in 2024 (KFF)—are far more price elastic and shop aggressively. Fluctuating pharmacy prices and price differences between the app and checkout can erode trust, driving demands for clearer, consistent pricing and transparency.
- Insured: use only if < copay; Uninsured/high-deductible: highly price-sensitive (~30% of privately insured)
Enterprise and channel partners’ bargaining power
Employers, benefits platforms and payers can bundle rival prescription tools and leverage scale to negotiate lower economics for traffic and data access, constraining GoodRx pricing and margins; for context GoodRx reported roughly $1.0B revenue in 2023, so channel terms meaningfully impact profitability.
Their endorsements shape consumer adoption paths and losing a major channel or payer relationship can materially reduce volume and customer acquisition velocity.
- Channel concentration risk
- Negotiation leverage on fees/data
- Endorsement-driven adoption
- Volume sensitivity to partner loss
Price-sensitive buyers; eRx >90%, ~30% elastic
Customers are highly price-sensitive with low switching costs, forcing GoodRx to surface best net prices; multi-homing (median 2 apps at checkout) and real-time visibility raise churn. e-prescribing >90% (ONC 2024) lets prescribers steer choices; GoodRx scale ($1.03B revenue 2023) not immune while ~30% of privately insured (2024 KFF) remain very price-elastic.
| Metric | Value | Source/Year |
|---|---|---|
| Revenue | $1.03B | GoodRx 2023 |
| e-prescribing | >90% | ONC 2024 |
| Multi-home | ~2 apps | Checkout surveys 2024 |
| High-deductible | ~30% | KFF 2024 |
Preview Before You Purchase
GoodRx Porter's Five Forces Analysis
This preview shows the exact GoodRx Porter’s Five Forces analysis you’ll receive—no placeholders or samples. It’s the complete, professionally formatted document, ready for immediate download and use upon purchase. What you see is precisely what will be delivered.

Go Beyond the Preview—Access the Full Strategic Report
GoodRx faces intense buyer scrutiny, growing substitute threats from telehealth and PBMs, moderate supplier leverage, and rising regulatory and entrant pressures shaping its margins and growth.
This brief snapshot highlights core competitive dynamics but only scratches the surface of force interactions and strategic implications for GoodRx.
Unlock the full Porter's Five Forces Analysis to get force-by-force ratings, visuals, and actionable recommendations tailored to investment and strategy decisions.
Get a consultant-grade Word and Excel report to deploy immediately in due diligence, presentations, or strategic planning.
Suppliers Bargaining Power
Dependence on PBMs for rates
GoodRx’s discounts largely derive from PBM-negotiated pharmacy rates, and the three largest PBMs—CVS Caremark, Express Scripts, OptumRx—control roughly 80% of the US PBM market (2023–24), concentrating supplier power. Contract fee or term changes can compress GoodRx’s margins; PBMs that operate rival consumer brands may steer volume to their platforms, and renegotiations or terminations can quickly reduce coverage and economics.
Large pharmacy chains’ leverage
National chains such as CVS (about 9,900 U.S. locations in 2024), Walgreens (roughly 8,200) and Walmart (≈4,700 pharmacies) control large fill volumes and in-store execution, giving them significant bargaining power over GoodRx. If a chain restricts coupon acceptance or alters EHR/point-of-sale integrations, patient UX and prescription redemption rates decline. Chains can promote own discount programs (e.g., store-branded $4 lists), squeezing GoodRx margins, while store-level compliance variability creates operational friction and reconciliation costs.
Drug manufacturers and copay programs
Manufacturers influence net prices through copay cards, affordability programs, and list-price strategies, and generous manufacturer copay support can reduce insured patients reliance on GoodRx coupons. Manufacturers may tighten eligibility or data-sharing terms for partner access, directly affecting coupon availability. The 2023 Inflation Reduction Act cap of 35 on Medicare insulin highlights how policy and manufacturer programs reshape patient cost dynamics and GoodRx’s value proposition.
Telehealth clinician network and platforms
Supply of licensed clinicians for GoodRx telehealth directly shapes coverage, pricing, and quality; limited clinician availability raises wait times and drives up compensation as competing telehealth marketplaces bid for talent. Regulatory changes on prescribing and telehealth modalities can abruptly constrain clinician supply, while EMR/eRx integration costs create dependency and switching frictions for providers.
- Clinician supply → coverage, price, quality
- Market competition bids up pay
- Regulatory shifts pressure supply
- EMR/eRx integration adds dependency
Data, API, and POS integrations
Accurate, timely price feeds and POS acceptance for GoodRx depend on partner pharmacy and POS systems, with 60,000+ US retail pharmacy endpoints increasing integration complexity. API access limits, per-call data fees, and outages can materially degrade price transparency and user trust. Frequent pharmacy system updates require maintenance and certification, creating switching friction that gives suppliers negotiation leverage.
- 60,000+ retail pharmacy endpoints
- API limits/data fees risk price opacity
- Maintenance & certification cycles raise costs
- Technical dependence increases supplier leverage
PBM concentration (~80%) and 60,000+ endpoints pressure margins
GoodRx relies on three PBMs (~80% US PBM market 2023–24), major chains (CVS 9,900; Walgreens 8,200; Walmart 4,700 pharmacies in 2024) and manufacturers for copay support; contract, POS or clinician-supply shifts can quickly compress margins and coverage. 60,000+ retail pharmacy endpoints and API/data fees raise integration costs and supplier leverage.
| Metric | Value |
|---|---|
| Top PBM share | ~80% (2023–24) |
| Major chain pharmacies (2024) | CVS 9,900; Walgreens 8,200; Walmart 4,700 |
| Pharmacy endpoints | 60,000+ |
| Medicare insulin cap | $35 (2023) |
What is included in the product
Detailed Word Document
Concise Porter's Five Forces overview for GoodRx that uncovers key competitive drivers, buyer and supplier power, substitute threats, and entry barriers shaping its pricing and profitability. Tailored strategic commentary highlights disruptive entrants, regulatory risks, and defensive advantages to inform investor, strategic, or academic use.
Customizable Excel Spreadsheet
A concise one-sheet Porter's Five Forces for GoodRx that highlights competitive pressures and pain-point reliefs—ready to drop into decks; adjustable force levels and an instant radar chart visualize strategic risk so teams can act fast.
Customers Bargaining Power
Highly price-sensitive, low switching costs
Highly price-sensitive customers can compare coupon codes across apps within seconds and face minimal lock-in, allowing them to switch per prescription; this forces GoodRx to surface the best net price every time. The low switching costs amplify sensitivity to small price deltas, pressuring margin and promotional strategy. Continuous real-time price visibility in 2024 raises churn risk if competitors post slightly better discounts.
Multi-homing across rival discount cards
Users commonly multi-home across rival discount cards, trying a median of 2 options at checkout, which dilutes loyalty and reduces GoodRx’s ability to monetize repeat usage; GoodRx reported roughly $1.03 billion revenue in 2023, highlighting scale but not immunity to churn. Multi-homing forces sustained promotional and SEO spend to win transient clicks, shrinking marketing ROI. PBM arrangements face compressed take rates as price competition intensifies between platforms.
Prescriber influence and workflow fit
Physicians can actively steer patients toward specific pharmacies or discount methods by selecting default pharmacies or messaging at the point of care. With e-prescribing adoption in the US exceeding 90% per ONC 2024, defaults that favor insurer benefits or rival cards can sharply reduce GoodRx usage. Winning prescriber mindshare minimizes patient friction and boosts redemptions, while lack of integration forces extra steps that increase patient disengagement.
Insured vs uninsured dynamics
Insured users often only redeem GoodRx coupons when the discounted price undercuts their copay, reducing coupon use frequency, while uninsured and high-deductible plan holders—about 30% of the privately insured in 2024 (KFF)—are far more price elastic and shop aggressively. Fluctuating pharmacy prices and price differences between the app and checkout can erode trust, driving demands for clearer, consistent pricing and transparency.
- Insured: use only if < copay; Uninsured/high-deductible: highly price-sensitive (~30% of privately insured)
Enterprise and channel partners’ bargaining power
Employers, benefits platforms and payers can bundle rival prescription tools and leverage scale to negotiate lower economics for traffic and data access, constraining GoodRx pricing and margins; for context GoodRx reported roughly $1.0B revenue in 2023, so channel terms meaningfully impact profitability.
Their endorsements shape consumer adoption paths and losing a major channel or payer relationship can materially reduce volume and customer acquisition velocity.
- Channel concentration risk
- Negotiation leverage on fees/data
- Endorsement-driven adoption
- Volume sensitivity to partner loss
Price-sensitive buyers; eRx >90%, ~30% elastic
Customers are highly price-sensitive with low switching costs, forcing GoodRx to surface best net prices; multi-homing (median 2 apps at checkout) and real-time visibility raise churn. e-prescribing >90% (ONC 2024) lets prescribers steer choices; GoodRx scale ($1.03B revenue 2023) not immune while ~30% of privately insured (2024 KFF) remain very price-elastic.
| Metric | Value | Source/Year |
|---|---|---|
| Revenue | $1.03B | GoodRx 2023 |
| e-prescribing | >90% | ONC 2024 |
| Multi-home | ~2 apps | Checkout surveys 2024 |
| High-deductible | ~30% | KFF 2024 |
Preview Before You Purchase
GoodRx Porter's Five Forces Analysis
This preview shows the exact GoodRx Porter’s Five Forces analysis you’ll receive—no placeholders or samples. It’s the complete, professionally formatted document, ready for immediate download and use upon purchase. What you see is precisely what will be delivered.
Original: $10.00
-65%$10.00
$3.50Description
Go Beyond the Preview—Access the Full Strategic Report
GoodRx faces intense buyer scrutiny, growing substitute threats from telehealth and PBMs, moderate supplier leverage, and rising regulatory and entrant pressures shaping its margins and growth.
This brief snapshot highlights core competitive dynamics but only scratches the surface of force interactions and strategic implications for GoodRx.
Unlock the full Porter's Five Forces Analysis to get force-by-force ratings, visuals, and actionable recommendations tailored to investment and strategy decisions.
Get a consultant-grade Word and Excel report to deploy immediately in due diligence, presentations, or strategic planning.
Suppliers Bargaining Power
Dependence on PBMs for rates
GoodRx’s discounts largely derive from PBM-negotiated pharmacy rates, and the three largest PBMs—CVS Caremark, Express Scripts, OptumRx—control roughly 80% of the US PBM market (2023–24), concentrating supplier power. Contract fee or term changes can compress GoodRx’s margins; PBMs that operate rival consumer brands may steer volume to their platforms, and renegotiations or terminations can quickly reduce coverage and economics.
Large pharmacy chains’ leverage
National chains such as CVS (about 9,900 U.S. locations in 2024), Walgreens (roughly 8,200) and Walmart (≈4,700 pharmacies) control large fill volumes and in-store execution, giving them significant bargaining power over GoodRx. If a chain restricts coupon acceptance or alters EHR/point-of-sale integrations, patient UX and prescription redemption rates decline. Chains can promote own discount programs (e.g., store-branded $4 lists), squeezing GoodRx margins, while store-level compliance variability creates operational friction and reconciliation costs.
Drug manufacturers and copay programs
Manufacturers influence net prices through copay cards, affordability programs, and list-price strategies, and generous manufacturer copay support can reduce insured patients reliance on GoodRx coupons. Manufacturers may tighten eligibility or data-sharing terms for partner access, directly affecting coupon availability. The 2023 Inflation Reduction Act cap of 35 on Medicare insulin highlights how policy and manufacturer programs reshape patient cost dynamics and GoodRx’s value proposition.
Telehealth clinician network and platforms
Supply of licensed clinicians for GoodRx telehealth directly shapes coverage, pricing, and quality; limited clinician availability raises wait times and drives up compensation as competing telehealth marketplaces bid for talent. Regulatory changes on prescribing and telehealth modalities can abruptly constrain clinician supply, while EMR/eRx integration costs create dependency and switching frictions for providers.
- Clinician supply → coverage, price, quality
- Market competition bids up pay
- Regulatory shifts pressure supply
- EMR/eRx integration adds dependency
Data, API, and POS integrations
Accurate, timely price feeds and POS acceptance for GoodRx depend on partner pharmacy and POS systems, with 60,000+ US retail pharmacy endpoints increasing integration complexity. API access limits, per-call data fees, and outages can materially degrade price transparency and user trust. Frequent pharmacy system updates require maintenance and certification, creating switching friction that gives suppliers negotiation leverage.
- 60,000+ retail pharmacy endpoints
- API limits/data fees risk price opacity
- Maintenance & certification cycles raise costs
- Technical dependence increases supplier leverage
PBM concentration (~80%) and 60,000+ endpoints pressure margins
GoodRx relies on three PBMs (~80% US PBM market 2023–24), major chains (CVS 9,900; Walgreens 8,200; Walmart 4,700 pharmacies in 2024) and manufacturers for copay support; contract, POS or clinician-supply shifts can quickly compress margins and coverage. 60,000+ retail pharmacy endpoints and API/data fees raise integration costs and supplier leverage.
| Metric | Value |
|---|---|
| Top PBM share | ~80% (2023–24) |
| Major chain pharmacies (2024) | CVS 9,900; Walgreens 8,200; Walmart 4,700 |
| Pharmacy endpoints | 60,000+ |
| Medicare insulin cap | $35 (2023) |
What is included in the product
Detailed Word Document
Concise Porter's Five Forces overview for GoodRx that uncovers key competitive drivers, buyer and supplier power, substitute threats, and entry barriers shaping its pricing and profitability. Tailored strategic commentary highlights disruptive entrants, regulatory risks, and defensive advantages to inform investor, strategic, or academic use.
Customizable Excel Spreadsheet
A concise one-sheet Porter's Five Forces for GoodRx that highlights competitive pressures and pain-point reliefs—ready to drop into decks; adjustable force levels and an instant radar chart visualize strategic risk so teams can act fast.
Customers Bargaining Power
Highly price-sensitive, low switching costs
Highly price-sensitive customers can compare coupon codes across apps within seconds and face minimal lock-in, allowing them to switch per prescription; this forces GoodRx to surface the best net price every time. The low switching costs amplify sensitivity to small price deltas, pressuring margin and promotional strategy. Continuous real-time price visibility in 2024 raises churn risk if competitors post slightly better discounts.
Multi-homing across rival discount cards
Users commonly multi-home across rival discount cards, trying a median of 2 options at checkout, which dilutes loyalty and reduces GoodRx’s ability to monetize repeat usage; GoodRx reported roughly $1.03 billion revenue in 2023, highlighting scale but not immunity to churn. Multi-homing forces sustained promotional and SEO spend to win transient clicks, shrinking marketing ROI. PBM arrangements face compressed take rates as price competition intensifies between platforms.
Prescriber influence and workflow fit
Physicians can actively steer patients toward specific pharmacies or discount methods by selecting default pharmacies or messaging at the point of care. With e-prescribing adoption in the US exceeding 90% per ONC 2024, defaults that favor insurer benefits or rival cards can sharply reduce GoodRx usage. Winning prescriber mindshare minimizes patient friction and boosts redemptions, while lack of integration forces extra steps that increase patient disengagement.
Insured vs uninsured dynamics
Insured users often only redeem GoodRx coupons when the discounted price undercuts their copay, reducing coupon use frequency, while uninsured and high-deductible plan holders—about 30% of the privately insured in 2024 (KFF)—are far more price elastic and shop aggressively. Fluctuating pharmacy prices and price differences between the app and checkout can erode trust, driving demands for clearer, consistent pricing and transparency.
- Insured: use only if < copay; Uninsured/high-deductible: highly price-sensitive (~30% of privately insured)
Enterprise and channel partners’ bargaining power
Employers, benefits platforms and payers can bundle rival prescription tools and leverage scale to negotiate lower economics for traffic and data access, constraining GoodRx pricing and margins; for context GoodRx reported roughly $1.0B revenue in 2023, so channel terms meaningfully impact profitability.
Their endorsements shape consumer adoption paths and losing a major channel or payer relationship can materially reduce volume and customer acquisition velocity.
- Channel concentration risk
- Negotiation leverage on fees/data
- Endorsement-driven adoption
- Volume sensitivity to partner loss
Price-sensitive buyers; eRx >90%, ~30% elastic
Customers are highly price-sensitive with low switching costs, forcing GoodRx to surface best net prices; multi-homing (median 2 apps at checkout) and real-time visibility raise churn. e-prescribing >90% (ONC 2024) lets prescribers steer choices; GoodRx scale ($1.03B revenue 2023) not immune while ~30% of privately insured (2024 KFF) remain very price-elastic.
| Metric | Value | Source/Year |
|---|---|---|
| Revenue | $1.03B | GoodRx 2023 |
| e-prescribing | >90% | ONC 2024 |
| Multi-home | ~2 apps | Checkout surveys 2024 |
| High-deductible | ~30% | KFF 2024 |
Preview Before You Purchase
GoodRx Porter's Five Forces Analysis
This preview shows the exact GoodRx Porter’s Five Forces analysis you’ll receive—no placeholders or samples. It’s the complete, professionally formatted document, ready for immediate download and use upon purchase. What you see is precisely what will be delivered.











