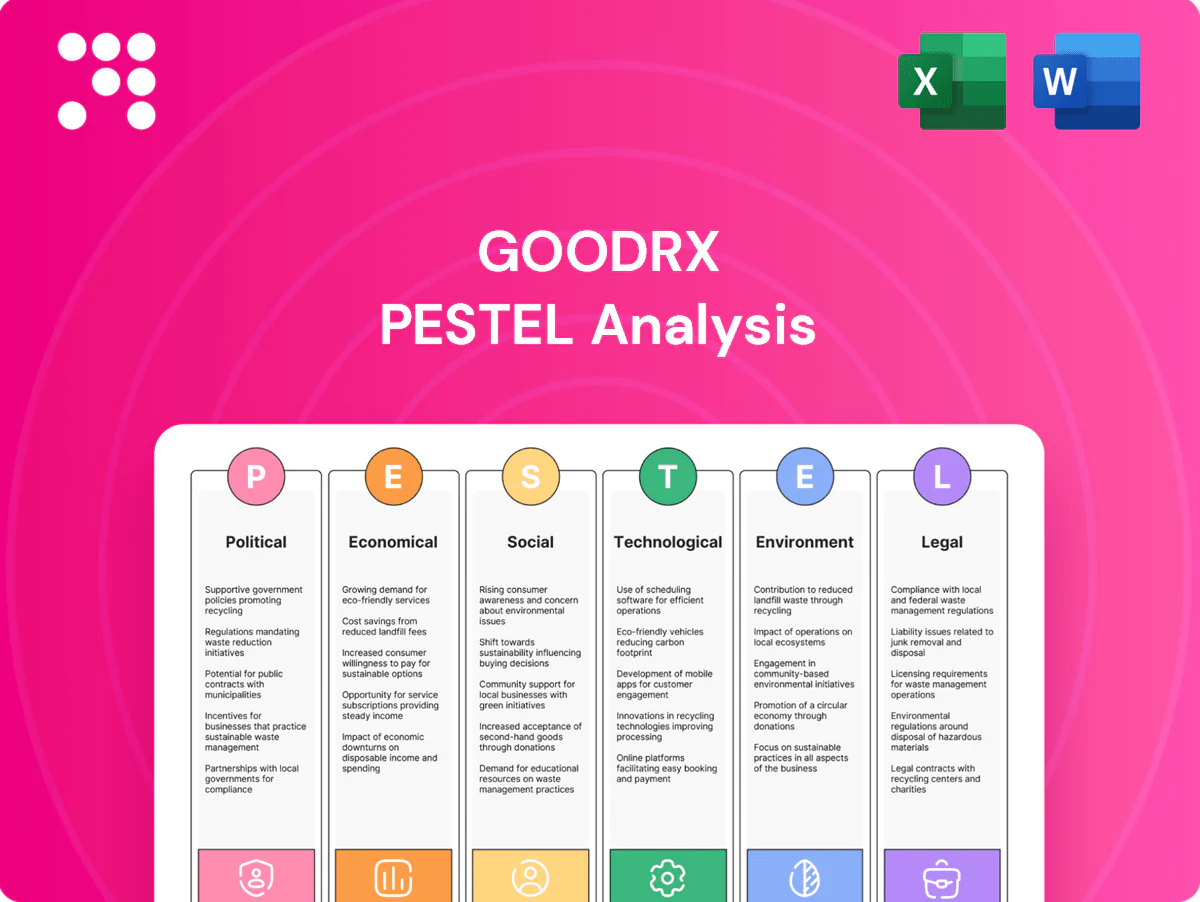
GoodRx PESTLE Analysis

Your Shortcut to Market Insight Starts Here
Unlock how political, economic, social, technological, legal, and environmental forces are reshaping GoodRx’s strategy and margins in our concise PESTLE Analysis. Packed with actionable insights for investors and strategists, it pinpoints risks and growth levers. Purchase the full report to get the complete, editable breakdown and make smarter decisions today.
Political factors

Drug pricing reform momentum
US and state policymakers continue targeting high prescription costs, reshaping discount and rebate flows. GoodRx could benefit from expanded transparency mandates, but tighter rebate controls risk margin compression. The Inflation Reduction Act set Medicare drug negotiation to start with 10 drugs announced Aug 2023 for 2026, and broader negotiation/reference pricing could shift the listed prices GoodRx aggregates. Ongoing 2024–25 congressional hearings keep pricing in the political spotlight, driving pharmacy and PBM volatility.
PBM transparency and regulation
Heightened scrutiny of PBMs — where the top three manage roughly 80% of US prescriptions — is pushing for clearer pass-through of rebates and fee structures, with rebates often exceeding 20% on branded drugs. This could force renegotiation of pharmacy network contracts that underpin GoodRx coupons and alter consumer price dynamics. If spread pricing is curtailed, net savings to consumers and retail partners may compress. GoodRx must adapt to evolving PBM reporting and contracting practices.

Telehealth policy continuity
Temporary telehealth flexibilities tied to the public health emergency (ended May 11, 2023) remain in phased transition, creating uncertain continuity for GoodRx telehealth services. Federal and state choices on cross-state practice — the Interstate Medical Licensure Compact covered 39 jurisdictions by 2024 — and prescribing rules directly shape platform usage. Reimbursement parity, present in roughly 23 states in 2024, affects provider supply and patient adoption. Policy rollbacks could raise friction and materially reduce utilization.

Healthcare coverage expansions
Medicaid redeterminations eliminated roughly 15 million enrollees during 2023–24, while ACA marketplace enrollment topped 16 million in 2024, shifting out-of-pocket demand for discounts. Expanded coverage typically reduces coupon reliance, but coverage losses drove spikes in GoodRx use; subsidy policy swings can rapidly change user volumes. GoodRx must tailor offers to payer coverage gaps and redetermination timing.
- Medicaid losses ≈ 15M (2023–24)
- ACA enrollees >16M (2024)
- Coverage loss → higher coupon use
- Subsidy shifts → rapid volume swings
Competition policy and consolidation
Political resistance to healthcare consolidation is intensifying and shapes pharmacy, PBM and telehealth M&A; tighter antitrust scrutiny—with the top three PBMs controlling roughly 80% of US prescription claims as of 2024—could slow rival integration and preserve GoodRx’s competitive position, while payer or pharmacy vertical integration could marginalize third-party platforms and erode GoodRx’s access and pricing leverage.
- PBM concentration ~80% (top 3) in 2024
- US retail prescriptions ~4.5 billion annually
- Antitrust enforcement rising—risks to rival M&A
- Policy shifts directly affect GoodRx bargaining power
Drug pricing reforms, Medicare 2026 negotiations and PBM dominance heighten margin pressure
US/state actions on drug pricing and rebate transparency (IRA Medicare negotiations starting 2026) heighten regulatory risk and could compress GoodRx margins. PBM scrutiny—top three PBMs ~80% share in 2024—threatens network/rebate structures that underpin coupon economics. Coverage shifts (Medicaid −≈15M 2023–24; ACA enrollees >16M 2024) drive rapid demand swings for discounts.
| Metric | 2023–24/2024 |
|---|---|
| Medicaid losses | ≈15M |
| ACA enrollment | >16M |
| Top 3 PBM share | ≈80% |
| US annual scripts | ≈4.5B |
| Medicare negotiation | 10 drugs announced (Aug 2023) for 2026 |
What is included in the product
 Detailed Word Document
Explores how macro-environmental factors uniquely affect GoodRx across Political, Economic, Social, Technological, Environmental, and Legal dimensions, with data-backed trends and examples specific to the U.S. prescription discount and telehealth market. Designed for executives and investors, it highlights risks, opportunities, and forward-looking insights ready for inclusion in strategy documents and pitch materials.

 Customizable Excel Spreadsheet
A concise, PESTLE-segmented summary that highlights regulatory, economic, technological and competitive risks and opportunities for GoodRx, designed for quick sharing in presentations or team alignment to guide risk mitigation and strategic decisions.
Economic factors

Consumer out-of-pocket pressure
High inflation in everyday goods (U.S. CPI ~3.0% in 2024) amplifies sensitivity to drug prices, driving higher coupon use. Rising HDHP enrollment (about 31% of covered workers in 2024 per KFF) and larger deductibles increase price shopping for prescriptions. Recessionary strains in 2023–24 elevated discount-seeking, strengthening GoodRx’s budget-focused value proposition.
Pharmacy margin dynamics
Pharmacy reimbursement and DIR fee shifts have tightened margins and reduce willingness to honor third-party discounts, pressuring network participation.
If margins compress, chains may limit GoodRx acceptance or steer patients to in-house savings, while independents—about 21,000 U.S. stores—may lean on GoodRx to drive foot traffic.
GoodRx’s network spans over 70,000 pharmacies, so reimbursement cycles materially affect its breadth and economics.

Advertising and CAC volatility
Digital ad pricing and signal loss have pushed industry CPA estimates as much as 20% higher, increasing GoodRx’s customer acquisition costs and making paid performance channels more volatile. Economic slowdowns can lower CPMs but sharpen competition for clicks and conversions. Strong retention, SEO and organic pharmacy referrals reduce paid-channel dependence. Maintaining strict CAC discipline is critical to preserve GoodRx’s unit economics.

Generic vs brand mix
Generics drive the bulk of GoodRx coupon volume, reflecting that nearly 90% of U.S. prescriptions are generics (FDA), yielding sizable relative savings versus brands. Brand price inflation can boost reported headline savings but faces tighter overlap with manufacturer copay and rebate programs. Patent cliffs and rising biosimilar approvals (over 40 FDA approvals through 2024) shift category economics and competitive mix, altering revenue and margin per fill.
- Generics share: nearly 90% of dispensed prescriptions (FDA)
- Brand inflation: raises headline savings but competes with manufacturer programs
- Biosimilars: 40+ FDA approvals through 2024, changing biologic economics
- Mix impact: shifts revenue and margin per fill
Telehealth monetization elasticity
Consumer willingness to pay for virtual visits varies with income, copays, and employer benefits; US median household income was about 74,580 in 2023, and telehealth stabilized at roughly 5–10% of outpatient visits post‑pandemic, so price sensitivity is high among lower‑income cohorts. Price points must match perceived convenience and access; bundling telehealth with medication savings historically raises conversion and retention for platforms like GoodRx. Macro cycles—employment, disposable income, and insurance coverage—shift cash‑pay telehealth demand noticeably across economic expansions and downturns.
- Income sensitivity: median HH income 74,580 (2023)
- Telehealth share: ~5–10% of visits post‑pandemic
- Bundling boosts conversion: proven in integrated Rx+telehealth models
- Macro impact: demand rises in expansions, falls in downturns
Drug pricing reforms, Medicare 2026 negotiations and PBM dominance heighten margin pressure
High 2024 inflation (U.S. CPI ~3.0%) and 31% HDHP penetration drive price‑sensitive coupon use; GoodRx’s 70,000‑pharmacy network and 21,000 independents amplify both risk and opportunity. Margin pressure from DIR/reimbursement shifts and ~20% higher digital CPA raise CAC, while generics (~90% of fills) and 40+ biosimilar approvals through 2024 reshape fill economics.
| Metric | Value |
|---|---|
| U.S. CPI (2024) | ~3.0% |
| HDHP enrollment (2024) | ~31% |
| Pharmacies in network | ~70,000 |
| Independent pharmacies | ~21,000 |
| Generics share | ~90% |
| Biosimilar approvals (through 2024) | 40+ |
| Digital CPA change | ~+20% |
Same Document Delivered
GoodRx PESTLE Analysis
The preview shown here is the exact GoodRx PESTLE Analysis you’ll receive after purchase—fully formatted and ready to use. This screenshot reflects the final content, layout, and structure with no placeholders. After checkout you’ll instantly download this exact file.

Your Shortcut to Market Insight Starts Here
Unlock how political, economic, social, technological, legal, and environmental forces are reshaping GoodRx’s strategy and margins in our concise PESTLE Analysis. Packed with actionable insights for investors and strategists, it pinpoints risks and growth levers. Purchase the full report to get the complete, editable breakdown and make smarter decisions today.
Political factors
Drug pricing reform momentum
US and state policymakers continue targeting high prescription costs, reshaping discount and rebate flows. GoodRx could benefit from expanded transparency mandates, but tighter rebate controls risk margin compression. The Inflation Reduction Act set Medicare drug negotiation to start with 10 drugs announced Aug 2023 for 2026, and broader negotiation/reference pricing could shift the listed prices GoodRx aggregates. Ongoing 2024–25 congressional hearings keep pricing in the political spotlight, driving pharmacy and PBM volatility.
PBM transparency and regulation
Heightened scrutiny of PBMs — where the top three manage roughly 80% of US prescriptions — is pushing for clearer pass-through of rebates and fee structures, with rebates often exceeding 20% on branded drugs. This could force renegotiation of pharmacy network contracts that underpin GoodRx coupons and alter consumer price dynamics. If spread pricing is curtailed, net savings to consumers and retail partners may compress. GoodRx must adapt to evolving PBM reporting and contracting practices.
Telehealth policy continuity
Temporary telehealth flexibilities tied to the public health emergency (ended May 11, 2023) remain in phased transition, creating uncertain continuity for GoodRx telehealth services. Federal and state choices on cross-state practice — the Interstate Medical Licensure Compact covered 39 jurisdictions by 2024 — and prescribing rules directly shape platform usage. Reimbursement parity, present in roughly 23 states in 2024, affects provider supply and patient adoption. Policy rollbacks could raise friction and materially reduce utilization.
Healthcare coverage expansions
Medicaid redeterminations eliminated roughly 15 million enrollees during 2023–24, while ACA marketplace enrollment topped 16 million in 2024, shifting out-of-pocket demand for discounts. Expanded coverage typically reduces coupon reliance, but coverage losses drove spikes in GoodRx use; subsidy policy swings can rapidly change user volumes. GoodRx must tailor offers to payer coverage gaps and redetermination timing.
- Medicaid losses ≈ 15M (2023–24)
- ACA enrollees >16M (2024)
- Coverage loss → higher coupon use
- Subsidy shifts → rapid volume swings
Competition policy and consolidation
Political resistance to healthcare consolidation is intensifying and shapes pharmacy, PBM and telehealth M&A; tighter antitrust scrutiny—with the top three PBMs controlling roughly 80% of US prescription claims as of 2024—could slow rival integration and preserve GoodRx’s competitive position, while payer or pharmacy vertical integration could marginalize third-party platforms and erode GoodRx’s access and pricing leverage.
- PBM concentration ~80% (top 3) in 2024
- US retail prescriptions ~4.5 billion annually
- Antitrust enforcement rising—risks to rival M&A
- Policy shifts directly affect GoodRx bargaining power
Drug pricing reforms, Medicare 2026 negotiations and PBM dominance heighten margin pressure
US/state actions on drug pricing and rebate transparency (IRA Medicare negotiations starting 2026) heighten regulatory risk and could compress GoodRx margins. PBM scrutiny—top three PBMs ~80% share in 2024—threatens network/rebate structures that underpin coupon economics. Coverage shifts (Medicaid −≈15M 2023–24; ACA enrollees >16M 2024) drive rapid demand swings for discounts.
| Metric | 2023–24/2024 |
|---|---|
| Medicaid losses | ≈15M |
| ACA enrollment | >16M |
| Top 3 PBM share | ≈80% |
| US annual scripts | ≈4.5B |
| Medicare negotiation | 10 drugs announced (Aug 2023) for 2026 |
What is included in the product
Detailed Word Document
Explores how macro-environmental factors uniquely affect GoodRx across Political, Economic, Social, Technological, Environmental, and Legal dimensions, with data-backed trends and examples specific to the U.S. prescription discount and telehealth market. Designed for executives and investors, it highlights risks, opportunities, and forward-looking insights ready for inclusion in strategy documents and pitch materials.
Customizable Excel Spreadsheet
A concise, PESTLE-segmented summary that highlights regulatory, economic, technological and competitive risks and opportunities for GoodRx, designed for quick sharing in presentations or team alignment to guide risk mitigation and strategic decisions.
Economic factors
Consumer out-of-pocket pressure
High inflation in everyday goods (U.S. CPI ~3.0% in 2024) amplifies sensitivity to drug prices, driving higher coupon use. Rising HDHP enrollment (about 31% of covered workers in 2024 per KFF) and larger deductibles increase price shopping for prescriptions. Recessionary strains in 2023–24 elevated discount-seeking, strengthening GoodRx’s budget-focused value proposition.
Pharmacy margin dynamics
Pharmacy reimbursement and DIR fee shifts have tightened margins and reduce willingness to honor third-party discounts, pressuring network participation.
If margins compress, chains may limit GoodRx acceptance or steer patients to in-house savings, while independents—about 21,000 U.S. stores—may lean on GoodRx to drive foot traffic.
GoodRx’s network spans over 70,000 pharmacies, so reimbursement cycles materially affect its breadth and economics.
Advertising and CAC volatility
Digital ad pricing and signal loss have pushed industry CPA estimates as much as 20% higher, increasing GoodRx’s customer acquisition costs and making paid performance channels more volatile. Economic slowdowns can lower CPMs but sharpen competition for clicks and conversions. Strong retention, SEO and organic pharmacy referrals reduce paid-channel dependence. Maintaining strict CAC discipline is critical to preserve GoodRx’s unit economics.
Generic vs brand mix
Generics drive the bulk of GoodRx coupon volume, reflecting that nearly 90% of U.S. prescriptions are generics (FDA), yielding sizable relative savings versus brands. Brand price inflation can boost reported headline savings but faces tighter overlap with manufacturer copay and rebate programs. Patent cliffs and rising biosimilar approvals (over 40 FDA approvals through 2024) shift category economics and competitive mix, altering revenue and margin per fill.
- Generics share: nearly 90% of dispensed prescriptions (FDA)
- Brand inflation: raises headline savings but competes with manufacturer programs
- Biosimilars: 40+ FDA approvals through 2024, changing biologic economics
- Mix impact: shifts revenue and margin per fill
Telehealth monetization elasticity
Consumer willingness to pay for virtual visits varies with income, copays, and employer benefits; US median household income was about 74,580 in 2023, and telehealth stabilized at roughly 5–10% of outpatient visits post‑pandemic, so price sensitivity is high among lower‑income cohorts. Price points must match perceived convenience and access; bundling telehealth with medication savings historically raises conversion and retention for platforms like GoodRx. Macro cycles—employment, disposable income, and insurance coverage—shift cash‑pay telehealth demand noticeably across economic expansions and downturns.
- Income sensitivity: median HH income 74,580 (2023)
- Telehealth share: ~5–10% of visits post‑pandemic
- Bundling boosts conversion: proven in integrated Rx+telehealth models
- Macro impact: demand rises in expansions, falls in downturns
Drug pricing reforms, Medicare 2026 negotiations and PBM dominance heighten margin pressure
High 2024 inflation (U.S. CPI ~3.0%) and 31% HDHP penetration drive price‑sensitive coupon use; GoodRx’s 70,000‑pharmacy network and 21,000 independents amplify both risk and opportunity. Margin pressure from DIR/reimbursement shifts and ~20% higher digital CPA raise CAC, while generics (~90% of fills) and 40+ biosimilar approvals through 2024 reshape fill economics.
| Metric | Value |
|---|---|
| U.S. CPI (2024) | ~3.0% |
| HDHP enrollment (2024) | ~31% |
| Pharmacies in network | ~70,000 |
| Independent pharmacies | ~21,000 |
| Generics share | ~90% |
| Biosimilar approvals (through 2024) | 40+ |
| Digital CPA change | ~+20% |
Same Document Delivered
GoodRx PESTLE Analysis
The preview shown here is the exact GoodRx PESTLE Analysis you’ll receive after purchase—fully formatted and ready to use. This screenshot reflects the final content, layout, and structure with no placeholders. After checkout you’ll instantly download this exact file.
Original: $10.00
-65%$10.00
$3.50Description
Your Shortcut to Market Insight Starts Here
Unlock how political, economic, social, technological, legal, and environmental forces are reshaping GoodRx’s strategy and margins in our concise PESTLE Analysis. Packed with actionable insights for investors and strategists, it pinpoints risks and growth levers. Purchase the full report to get the complete, editable breakdown and make smarter decisions today.
Political factors
Drug pricing reform momentum
US and state policymakers continue targeting high prescription costs, reshaping discount and rebate flows. GoodRx could benefit from expanded transparency mandates, but tighter rebate controls risk margin compression. The Inflation Reduction Act set Medicare drug negotiation to start with 10 drugs announced Aug 2023 for 2026, and broader negotiation/reference pricing could shift the listed prices GoodRx aggregates. Ongoing 2024–25 congressional hearings keep pricing in the political spotlight, driving pharmacy and PBM volatility.
PBM transparency and regulation
Heightened scrutiny of PBMs — where the top three manage roughly 80% of US prescriptions — is pushing for clearer pass-through of rebates and fee structures, with rebates often exceeding 20% on branded drugs. This could force renegotiation of pharmacy network contracts that underpin GoodRx coupons and alter consumer price dynamics. If spread pricing is curtailed, net savings to consumers and retail partners may compress. GoodRx must adapt to evolving PBM reporting and contracting practices.
Telehealth policy continuity
Temporary telehealth flexibilities tied to the public health emergency (ended May 11, 2023) remain in phased transition, creating uncertain continuity for GoodRx telehealth services. Federal and state choices on cross-state practice — the Interstate Medical Licensure Compact covered 39 jurisdictions by 2024 — and prescribing rules directly shape platform usage. Reimbursement parity, present in roughly 23 states in 2024, affects provider supply and patient adoption. Policy rollbacks could raise friction and materially reduce utilization.
Healthcare coverage expansions
Medicaid redeterminations eliminated roughly 15 million enrollees during 2023–24, while ACA marketplace enrollment topped 16 million in 2024, shifting out-of-pocket demand for discounts. Expanded coverage typically reduces coupon reliance, but coverage losses drove spikes in GoodRx use; subsidy policy swings can rapidly change user volumes. GoodRx must tailor offers to payer coverage gaps and redetermination timing.
- Medicaid losses ≈ 15M (2023–24)
- ACA enrollees >16M (2024)
- Coverage loss → higher coupon use
- Subsidy shifts → rapid volume swings
Competition policy and consolidation
Political resistance to healthcare consolidation is intensifying and shapes pharmacy, PBM and telehealth M&A; tighter antitrust scrutiny—with the top three PBMs controlling roughly 80% of US prescription claims as of 2024—could slow rival integration and preserve GoodRx’s competitive position, while payer or pharmacy vertical integration could marginalize third-party platforms and erode GoodRx’s access and pricing leverage.
- PBM concentration ~80% (top 3) in 2024
- US retail prescriptions ~4.5 billion annually
- Antitrust enforcement rising—risks to rival M&A
- Policy shifts directly affect GoodRx bargaining power
Drug pricing reforms, Medicare 2026 negotiations and PBM dominance heighten margin pressure
US/state actions on drug pricing and rebate transparency (IRA Medicare negotiations starting 2026) heighten regulatory risk and could compress GoodRx margins. PBM scrutiny—top three PBMs ~80% share in 2024—threatens network/rebate structures that underpin coupon economics. Coverage shifts (Medicaid −≈15M 2023–24; ACA enrollees >16M 2024) drive rapid demand swings for discounts.
| Metric | 2023–24/2024 |
|---|---|
| Medicaid losses | ≈15M |
| ACA enrollment | >16M |
| Top 3 PBM share | ≈80% |
| US annual scripts | ≈4.5B |
| Medicare negotiation | 10 drugs announced (Aug 2023) for 2026 |
What is included in the product
Detailed Word Document
Explores how macro-environmental factors uniquely affect GoodRx across Political, Economic, Social, Technological, Environmental, and Legal dimensions, with data-backed trends and examples specific to the U.S. prescription discount and telehealth market. Designed for executives and investors, it highlights risks, opportunities, and forward-looking insights ready for inclusion in strategy documents and pitch materials.
Customizable Excel Spreadsheet
A concise, PESTLE-segmented summary that highlights regulatory, economic, technological and competitive risks and opportunities for GoodRx, designed for quick sharing in presentations or team alignment to guide risk mitigation and strategic decisions.
Economic factors
Consumer out-of-pocket pressure
High inflation in everyday goods (U.S. CPI ~3.0% in 2024) amplifies sensitivity to drug prices, driving higher coupon use. Rising HDHP enrollment (about 31% of covered workers in 2024 per KFF) and larger deductibles increase price shopping for prescriptions. Recessionary strains in 2023–24 elevated discount-seeking, strengthening GoodRx’s budget-focused value proposition.
Pharmacy margin dynamics
Pharmacy reimbursement and DIR fee shifts have tightened margins and reduce willingness to honor third-party discounts, pressuring network participation.
If margins compress, chains may limit GoodRx acceptance or steer patients to in-house savings, while independents—about 21,000 U.S. stores—may lean on GoodRx to drive foot traffic.
GoodRx’s network spans over 70,000 pharmacies, so reimbursement cycles materially affect its breadth and economics.
Advertising and CAC volatility
Digital ad pricing and signal loss have pushed industry CPA estimates as much as 20% higher, increasing GoodRx’s customer acquisition costs and making paid performance channels more volatile. Economic slowdowns can lower CPMs but sharpen competition for clicks and conversions. Strong retention, SEO and organic pharmacy referrals reduce paid-channel dependence. Maintaining strict CAC discipline is critical to preserve GoodRx’s unit economics.
Generic vs brand mix
Generics drive the bulk of GoodRx coupon volume, reflecting that nearly 90% of U.S. prescriptions are generics (FDA), yielding sizable relative savings versus brands. Brand price inflation can boost reported headline savings but faces tighter overlap with manufacturer copay and rebate programs. Patent cliffs and rising biosimilar approvals (over 40 FDA approvals through 2024) shift category economics and competitive mix, altering revenue and margin per fill.
- Generics share: nearly 90% of dispensed prescriptions (FDA)
- Brand inflation: raises headline savings but competes with manufacturer programs
- Biosimilars: 40+ FDA approvals through 2024, changing biologic economics
- Mix impact: shifts revenue and margin per fill
Telehealth monetization elasticity
Consumer willingness to pay for virtual visits varies with income, copays, and employer benefits; US median household income was about 74,580 in 2023, and telehealth stabilized at roughly 5–10% of outpatient visits post‑pandemic, so price sensitivity is high among lower‑income cohorts. Price points must match perceived convenience and access; bundling telehealth with medication savings historically raises conversion and retention for platforms like GoodRx. Macro cycles—employment, disposable income, and insurance coverage—shift cash‑pay telehealth demand noticeably across economic expansions and downturns.
- Income sensitivity: median HH income 74,580 (2023)
- Telehealth share: ~5–10% of visits post‑pandemic
- Bundling boosts conversion: proven in integrated Rx+telehealth models
- Macro impact: demand rises in expansions, falls in downturns
Drug pricing reforms, Medicare 2026 negotiations and PBM dominance heighten margin pressure
High 2024 inflation (U.S. CPI ~3.0%) and 31% HDHP penetration drive price‑sensitive coupon use; GoodRx’s 70,000‑pharmacy network and 21,000 independents amplify both risk and opportunity. Margin pressure from DIR/reimbursement shifts and ~20% higher digital CPA raise CAC, while generics (~90% of fills) and 40+ biosimilar approvals through 2024 reshape fill economics.
| Metric | Value |
|---|---|
| U.S. CPI (2024) | ~3.0% |
| HDHP enrollment (2024) | ~31% |
| Pharmacies in network | ~70,000 |
| Independent pharmacies | ~21,000 |
| Generics share | ~90% |
| Biosimilar approvals (through 2024) | 40+ |
| Digital CPA change | ~+20% |
Same Document Delivered
GoodRx PESTLE Analysis
The preview shown here is the exact GoodRx PESTLE Analysis you’ll receive after purchase—fully formatted and ready to use. This screenshot reflects the final content, layout, and structure with no placeholders. After checkout you’ll instantly download this exact file.











