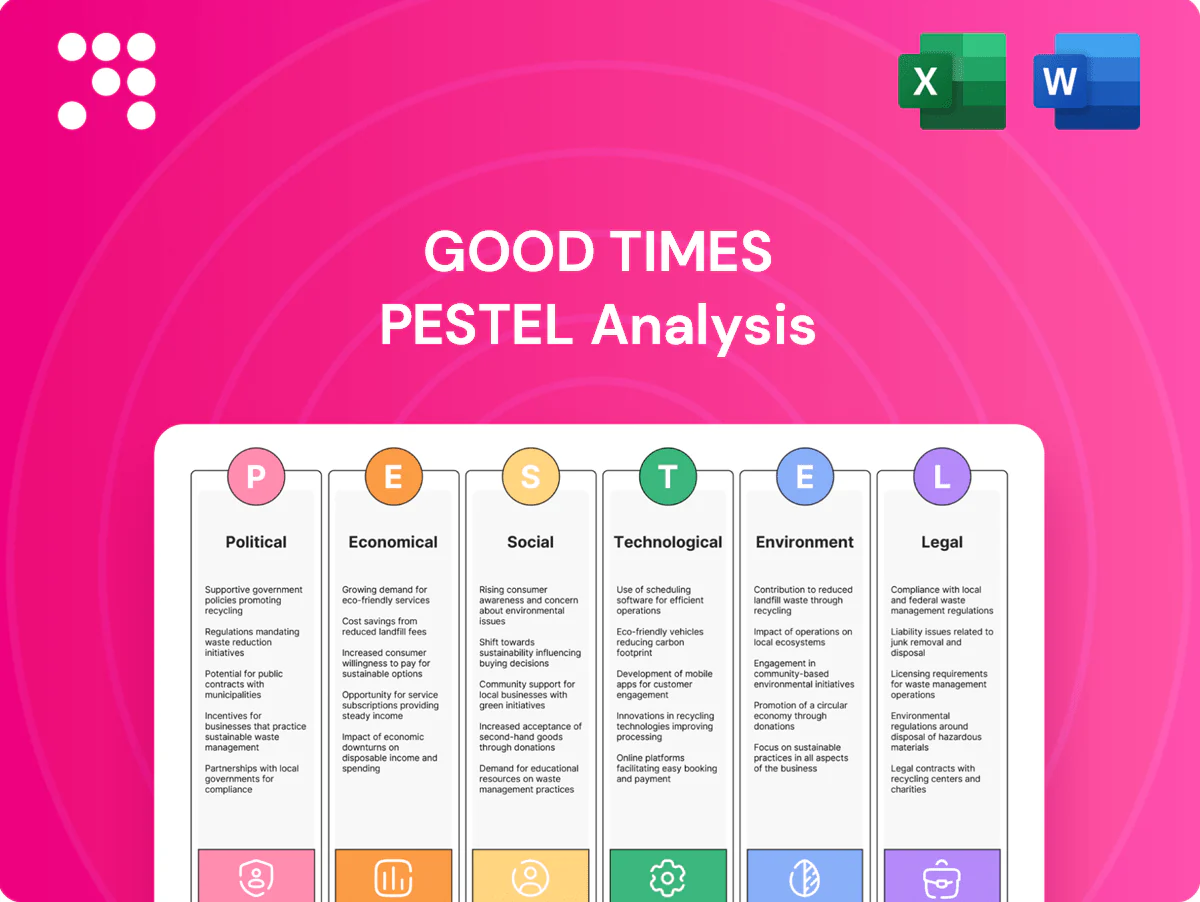
Good Times PESTLE Analysis

Plan Smarter. Present Sharper. Compete Stronger.
Unlock strategic clarity with our targeted PESTLE Analysis of Good Times—three to five sentences won’t cut it, so get the full picture: political, economic, social, technological, legal and environmental forces analyzed for real decisions. Ideal for investors, consultants, and managers, this report translates trends into actionable risks and opportunities. Purchase the complete analysis to download editable insights and start shaping strategy today.
Political factors

Food policy and agricultural subsidies
Changes in U.S. agricultural policy can shift beef, dairy and produce costs for Good Times; USDA projected 2024 net farm income at about $128.6 billion, affecting suppliers' pricing power. Shifts in subsidies or import rules alter input costs and availability, with tariff adjustments and commodity support changing margins. Good Times must monitor USDA rulemakings and market reports to hedge volatility. Active advocacy through industry groups can help mitigate adverse policy impacts.
Minimum wage and labor agendas
State and local wage floors now span from the federal $7.25 to $16+ in California, and cities such as New York City and Seattle have predictive-scheduling and living-wage rules that raise compliance complexity across company and franchised units. Political momentum for living-wage ordinances and scheduling laws pressures operators to adopt proactive workforce planning and index menu pricing to labor cost changes. Optimizing geographic mix—favoring lower-mandate regions or higher-margin formats—becomes a key lever to protect EBITDA.

Franchise regulation and local permitting
Zoning, permitting, and local political climates materially affect new-unit approvals and remodel timelines, often adding months to openings. Municipal preferences for reduced drive-thru congestion—seen in Berkeley’s 2021 drive-thru restrictions—shape format choices and site selection. The FTC’s Franchise Rule mandates a 23-item Franchise Disclosure Document and many states add registration/relationship rules. Strong community relations typically speed permitting and reduce opposition.

Trade policy and supply chain resiliency
Tariffs and geopolitical tensions — including US tariffs covering about 370 billion dollars of Chinese imports — can disrupt packaging, equipment, and specialty-ingredient sourcing, raising input costs and lead times. Diversified suppliers and nearshoring have cut exposure and helped maintain continuity in 2024, while political stability in key supplier regions supports steady operations. Contingency inventory planning (commonly 30–60 days of buffer) limits downtime and production stops.
- Tariff exposure: ~370bn USD (US-China)
- Nearshoring/diversification: lowers single-source risk
- Political stability: critical for continuity
- Contingency inventory: 30–60 days buffer
Public health directives
Policy responses to health crises can force indoor capacity limits (commonly 25–50% in 2020–21) and shift demand toward off-premise and delivery; operators must be able to pivot quickly as off-premise became the dominant channel in many markets during pandemic peaks. Preparedness for rapid rollout of delivery and curbside preserves revenue; active coordination with local health departments reduces closure risk and supports uninterrupted operations. Clear, transparent communication sustains guest trust and repeat visits.
- Capacity limits: 25–50%
- Off-premise: dominant channel in peak periods
- Essential: delivery/curbside readiness
- Action: coordinate with health departments
- Priority: clear guest communication
Cost squeeze: $128.6B, ~$370B
USDA 2024 net farm income ~$128.6B influences supplier pricing; tariff exposure (~$370B US-China) raises packaging/ingredient costs. State/local wage floors reach $16+ and expanding scheduling laws increase labor complexity; FTC Franchise Rule requires 23-item FDD, affecting franchised growth and compliance.
| Metric | Value |
|---|---|
| Net farm income (2024) | $128.6B |
| Tariff exposure | ~$370B |
| Max state min wage | $16+ |
| Contingency inventory | 30–60 days |
What is included in the product
 Detailed Word Document
Explores how Political, Economic, Social, Technological, Environmental, and Legal forces uniquely affect the Good Times, with data-backed insights and forward-looking implications tailored to its industry and region to inform strategy, risk mitigation, and investor-ready planning.

 Customizable Excel Spreadsheet
Good Times PESTLE Analysis offers a clean, visually segmented summary of external risks and opportunities for quick reference in meetings, easily editable for regional or business-specific notes and perfectly shareable for rapid team alignment.
Economic factors

Consumer spending and discretionary demand
Quick-service and premium burger spend closely tracks real disposable income; food-away-from-home accounted for about 52% of US food spending in 2023 (USDA ERS). In slowdowns, value menus and limited-time offers sustain traffic, as seen in past downturns. Premium, all-natural positioning retains higher-income segments willing to pay up. Monitoring CPI, real DPI and unemployment guides promotional cadence.
Food inflation and protein costs
Beef and dairy price volatility—retail beef near $8–9/lb in 2024 and food-at-home inflation easing to ~2% YoY—compressed burger and custard margins materially, prompting menu engineering and portion optimization to reduce basket protein by 5–10%. Strategic hedging and fixed supplier contracts stabilized input costs, while transparent pricing and ingredient callouts preserved brand trust during 2024–2025 volatility.

Labor market tightness
High competition for hourly workers—with U.S. unemployment near 3.7% (2024 annual average) and average hourly wages up roughly 4.5% YoY in 2024—pushes wages and turnover higher. Targeted investments in training and scheduling tech (reducing turnover by 10–20% in pilot studies) improve retention. Automation and simplified prep cut labor hours per unit, offsetting intensity. Unit-level margins remain highly sensitive to staffing stability and wage swings.

Interest rates and capital access
Delivery economics
Third-party aggregators expand reach but compress margins—U.S. platforms charged average commissions of 20–25% in 2023–24. Menu price differentials and virtual combos can recover economics, lifting AOV by ~8–10%. Own-channel ordering cuts take rates toward card-processing levels (~2–3%) and captures data. Mix management preserves the dine-in experience at Bad Daddy’s.
- Aggregator take rates: 20–25%
- Virtual combos lift AOV: ~8–10%
- Own-channel take rate: ~2–3%
Cost squeeze: $128.6B, ~$370B
Quick-service spend tracks real DPI; food-away-from-home was ~52% of US food spend in 2023. Beef at $8–9/lb in 2024 and food-at-home inflation ~2% YoY compressed margins, prompting hedging and menu engineering. Unemployment ~3.7% (2024) and fed funds 5.25–5.50% raised wages and capex; aggregator take 20–25% vs own-channel 2–3%.
| Metric | Value |
|---|---|
| Food-away-from-home | ~52% (2023) |
| Beef price | $8–9/lb (2024) |
| Unemployment | ~3.7% (2024) |
What You See Is What You Get
Good Times PESTLE Analysis
The Good Times PESTLE Analysis preview shown here is the exact document you’ll receive after purchase—fully formatted and ready to use. It contains the complete political, economic, social, technological, legal and environmental assessment as displayed. No placeholders or teasers—this is the final, professionally structured file you’ll download immediately after payment.

Plan Smarter. Present Sharper. Compete Stronger.
Unlock strategic clarity with our targeted PESTLE Analysis of Good Times—three to five sentences won’t cut it, so get the full picture: political, economic, social, technological, legal and environmental forces analyzed for real decisions. Ideal for investors, consultants, and managers, this report translates trends into actionable risks and opportunities. Purchase the complete analysis to download editable insights and start shaping strategy today.
Political factors
Food policy and agricultural subsidies
Changes in U.S. agricultural policy can shift beef, dairy and produce costs for Good Times; USDA projected 2024 net farm income at about $128.6 billion, affecting suppliers' pricing power. Shifts in subsidies or import rules alter input costs and availability, with tariff adjustments and commodity support changing margins. Good Times must monitor USDA rulemakings and market reports to hedge volatility. Active advocacy through industry groups can help mitigate adverse policy impacts.
Minimum wage and labor agendas
State and local wage floors now span from the federal $7.25 to $16+ in California, and cities such as New York City and Seattle have predictive-scheduling and living-wage rules that raise compliance complexity across company and franchised units. Political momentum for living-wage ordinances and scheduling laws pressures operators to adopt proactive workforce planning and index menu pricing to labor cost changes. Optimizing geographic mix—favoring lower-mandate regions or higher-margin formats—becomes a key lever to protect EBITDA.
Franchise regulation and local permitting
Zoning, permitting, and local political climates materially affect new-unit approvals and remodel timelines, often adding months to openings. Municipal preferences for reduced drive-thru congestion—seen in Berkeley’s 2021 drive-thru restrictions—shape format choices and site selection. The FTC’s Franchise Rule mandates a 23-item Franchise Disclosure Document and many states add registration/relationship rules. Strong community relations typically speed permitting and reduce opposition.
Trade policy and supply chain resiliency
Tariffs and geopolitical tensions — including US tariffs covering about 370 billion dollars of Chinese imports — can disrupt packaging, equipment, and specialty-ingredient sourcing, raising input costs and lead times. Diversified suppliers and nearshoring have cut exposure and helped maintain continuity in 2024, while political stability in key supplier regions supports steady operations. Contingency inventory planning (commonly 30–60 days of buffer) limits downtime and production stops.
- Tariff exposure: ~370bn USD (US-China)
- Nearshoring/diversification: lowers single-source risk
- Political stability: critical for continuity
- Contingency inventory: 30–60 days buffer
Public health directives
Policy responses to health crises can force indoor capacity limits (commonly 25–50% in 2020–21) and shift demand toward off-premise and delivery; operators must be able to pivot quickly as off-premise became the dominant channel in many markets during pandemic peaks. Preparedness for rapid rollout of delivery and curbside preserves revenue; active coordination with local health departments reduces closure risk and supports uninterrupted operations. Clear, transparent communication sustains guest trust and repeat visits.
- Capacity limits: 25–50%
- Off-premise: dominant channel in peak periods
- Essential: delivery/curbside readiness
- Action: coordinate with health departments
- Priority: clear guest communication
Cost squeeze: $128.6B, ~$370B
USDA 2024 net farm income ~$128.6B influences supplier pricing; tariff exposure (~$370B US-China) raises packaging/ingredient costs. State/local wage floors reach $16+ and expanding scheduling laws increase labor complexity; FTC Franchise Rule requires 23-item FDD, affecting franchised growth and compliance.
| Metric | Value |
|---|---|
| Net farm income (2024) | $128.6B |
| Tariff exposure | ~$370B |
| Max state min wage | $16+ |
| Contingency inventory | 30–60 days |
What is included in the product
Detailed Word Document
Explores how Political, Economic, Social, Technological, Environmental, and Legal forces uniquely affect the Good Times, with data-backed insights and forward-looking implications tailored to its industry and region to inform strategy, risk mitigation, and investor-ready planning.
Customizable Excel Spreadsheet
Good Times PESTLE Analysis offers a clean, visually segmented summary of external risks and opportunities for quick reference in meetings, easily editable for regional or business-specific notes and perfectly shareable for rapid team alignment.
Economic factors
Consumer spending and discretionary demand
Quick-service and premium burger spend closely tracks real disposable income; food-away-from-home accounted for about 52% of US food spending in 2023 (USDA ERS). In slowdowns, value menus and limited-time offers sustain traffic, as seen in past downturns. Premium, all-natural positioning retains higher-income segments willing to pay up. Monitoring CPI, real DPI and unemployment guides promotional cadence.
Food inflation and protein costs
Beef and dairy price volatility—retail beef near $8–9/lb in 2024 and food-at-home inflation easing to ~2% YoY—compressed burger and custard margins materially, prompting menu engineering and portion optimization to reduce basket protein by 5–10%. Strategic hedging and fixed supplier contracts stabilized input costs, while transparent pricing and ingredient callouts preserved brand trust during 2024–2025 volatility.
Labor market tightness
High competition for hourly workers—with U.S. unemployment near 3.7% (2024 annual average) and average hourly wages up roughly 4.5% YoY in 2024—pushes wages and turnover higher. Targeted investments in training and scheduling tech (reducing turnover by 10–20% in pilot studies) improve retention. Automation and simplified prep cut labor hours per unit, offsetting intensity. Unit-level margins remain highly sensitive to staffing stability and wage swings.
Interest rates and capital access
Delivery economics
Third-party aggregators expand reach but compress margins—U.S. platforms charged average commissions of 20–25% in 2023–24. Menu price differentials and virtual combos can recover economics, lifting AOV by ~8–10%. Own-channel ordering cuts take rates toward card-processing levels (~2–3%) and captures data. Mix management preserves the dine-in experience at Bad Daddy’s.
- Aggregator take rates: 20–25%
- Virtual combos lift AOV: ~8–10%
- Own-channel take rate: ~2–3%
Cost squeeze: $128.6B, ~$370B
Quick-service spend tracks real DPI; food-away-from-home was ~52% of US food spend in 2023. Beef at $8–9/lb in 2024 and food-at-home inflation ~2% YoY compressed margins, prompting hedging and menu engineering. Unemployment ~3.7% (2024) and fed funds 5.25–5.50% raised wages and capex; aggregator take 20–25% vs own-channel 2–3%.
| Metric | Value |
|---|---|
| Food-away-from-home | ~52% (2023) |
| Beef price | $8–9/lb (2024) |
| Unemployment | ~3.7% (2024) |
What You See Is What You Get
Good Times PESTLE Analysis
The Good Times PESTLE Analysis preview shown here is the exact document you’ll receive after purchase—fully formatted and ready to use. It contains the complete political, economic, social, technological, legal and environmental assessment as displayed. No placeholders or teasers—this is the final, professionally structured file you’ll download immediately after payment.
Original: $10.00
-65%$10.00
$3.50Description
Plan Smarter. Present Sharper. Compete Stronger.
Unlock strategic clarity with our targeted PESTLE Analysis of Good Times—three to five sentences won’t cut it, so get the full picture: political, economic, social, technological, legal and environmental forces analyzed for real decisions. Ideal for investors, consultants, and managers, this report translates trends into actionable risks and opportunities. Purchase the complete analysis to download editable insights and start shaping strategy today.
Political factors
Food policy and agricultural subsidies
Changes in U.S. agricultural policy can shift beef, dairy and produce costs for Good Times; USDA projected 2024 net farm income at about $128.6 billion, affecting suppliers' pricing power. Shifts in subsidies or import rules alter input costs and availability, with tariff adjustments and commodity support changing margins. Good Times must monitor USDA rulemakings and market reports to hedge volatility. Active advocacy through industry groups can help mitigate adverse policy impacts.
Minimum wage and labor agendas
State and local wage floors now span from the federal $7.25 to $16+ in California, and cities such as New York City and Seattle have predictive-scheduling and living-wage rules that raise compliance complexity across company and franchised units. Political momentum for living-wage ordinances and scheduling laws pressures operators to adopt proactive workforce planning and index menu pricing to labor cost changes. Optimizing geographic mix—favoring lower-mandate regions or higher-margin formats—becomes a key lever to protect EBITDA.
Franchise regulation and local permitting
Zoning, permitting, and local political climates materially affect new-unit approvals and remodel timelines, often adding months to openings. Municipal preferences for reduced drive-thru congestion—seen in Berkeley’s 2021 drive-thru restrictions—shape format choices and site selection. The FTC’s Franchise Rule mandates a 23-item Franchise Disclosure Document and many states add registration/relationship rules. Strong community relations typically speed permitting and reduce opposition.
Trade policy and supply chain resiliency
Tariffs and geopolitical tensions — including US tariffs covering about 370 billion dollars of Chinese imports — can disrupt packaging, equipment, and specialty-ingredient sourcing, raising input costs and lead times. Diversified suppliers and nearshoring have cut exposure and helped maintain continuity in 2024, while political stability in key supplier regions supports steady operations. Contingency inventory planning (commonly 30–60 days of buffer) limits downtime and production stops.
- Tariff exposure: ~370bn USD (US-China)
- Nearshoring/diversification: lowers single-source risk
- Political stability: critical for continuity
- Contingency inventory: 30–60 days buffer
Public health directives
Policy responses to health crises can force indoor capacity limits (commonly 25–50% in 2020–21) and shift demand toward off-premise and delivery; operators must be able to pivot quickly as off-premise became the dominant channel in many markets during pandemic peaks. Preparedness for rapid rollout of delivery and curbside preserves revenue; active coordination with local health departments reduces closure risk and supports uninterrupted operations. Clear, transparent communication sustains guest trust and repeat visits.
- Capacity limits: 25–50%
- Off-premise: dominant channel in peak periods
- Essential: delivery/curbside readiness
- Action: coordinate with health departments
- Priority: clear guest communication
Cost squeeze: $128.6B, ~$370B
USDA 2024 net farm income ~$128.6B influences supplier pricing; tariff exposure (~$370B US-China) raises packaging/ingredient costs. State/local wage floors reach $16+ and expanding scheduling laws increase labor complexity; FTC Franchise Rule requires 23-item FDD, affecting franchised growth and compliance.
| Metric | Value |
|---|---|
| Net farm income (2024) | $128.6B |
| Tariff exposure | ~$370B |
| Max state min wage | $16+ |
| Contingency inventory | 30–60 days |
What is included in the product
Detailed Word Document
Explores how Political, Economic, Social, Technological, Environmental, and Legal forces uniquely affect the Good Times, with data-backed insights and forward-looking implications tailored to its industry and region to inform strategy, risk mitigation, and investor-ready planning.
Customizable Excel Spreadsheet
Good Times PESTLE Analysis offers a clean, visually segmented summary of external risks and opportunities for quick reference in meetings, easily editable for regional or business-specific notes and perfectly shareable for rapid team alignment.
Economic factors
Consumer spending and discretionary demand
Quick-service and premium burger spend closely tracks real disposable income; food-away-from-home accounted for about 52% of US food spending in 2023 (USDA ERS). In slowdowns, value menus and limited-time offers sustain traffic, as seen in past downturns. Premium, all-natural positioning retains higher-income segments willing to pay up. Monitoring CPI, real DPI and unemployment guides promotional cadence.
Food inflation and protein costs
Beef and dairy price volatility—retail beef near $8–9/lb in 2024 and food-at-home inflation easing to ~2% YoY—compressed burger and custard margins materially, prompting menu engineering and portion optimization to reduce basket protein by 5–10%. Strategic hedging and fixed supplier contracts stabilized input costs, while transparent pricing and ingredient callouts preserved brand trust during 2024–2025 volatility.
Labor market tightness
High competition for hourly workers—with U.S. unemployment near 3.7% (2024 annual average) and average hourly wages up roughly 4.5% YoY in 2024—pushes wages and turnover higher. Targeted investments in training and scheduling tech (reducing turnover by 10–20% in pilot studies) improve retention. Automation and simplified prep cut labor hours per unit, offsetting intensity. Unit-level margins remain highly sensitive to staffing stability and wage swings.
Interest rates and capital access
Delivery economics
Third-party aggregators expand reach but compress margins—U.S. platforms charged average commissions of 20–25% in 2023–24. Menu price differentials and virtual combos can recover economics, lifting AOV by ~8–10%. Own-channel ordering cuts take rates toward card-processing levels (~2–3%) and captures data. Mix management preserves the dine-in experience at Bad Daddy’s.
- Aggregator take rates: 20–25%
- Virtual combos lift AOV: ~8–10%
- Own-channel take rate: ~2–3%
Cost squeeze: $128.6B, ~$370B
Quick-service spend tracks real DPI; food-away-from-home was ~52% of US food spend in 2023. Beef at $8–9/lb in 2024 and food-at-home inflation ~2% YoY compressed margins, prompting hedging and menu engineering. Unemployment ~3.7% (2024) and fed funds 5.25–5.50% raised wages and capex; aggregator take 20–25% vs own-channel 2–3%.
| Metric | Value |
|---|---|
| Food-away-from-home | ~52% (2023) |
| Beef price | $8–9/lb (2024) |
| Unemployment | ~3.7% (2024) |
What You See Is What You Get
Good Times PESTLE Analysis
The Good Times PESTLE Analysis preview shown here is the exact document you’ll receive after purchase—fully formatted and ready to use. It contains the complete political, economic, social, technological, legal and environmental assessment as displayed. No placeholders or teasers—this is the final, professionally structured file you’ll download immediately after payment.











