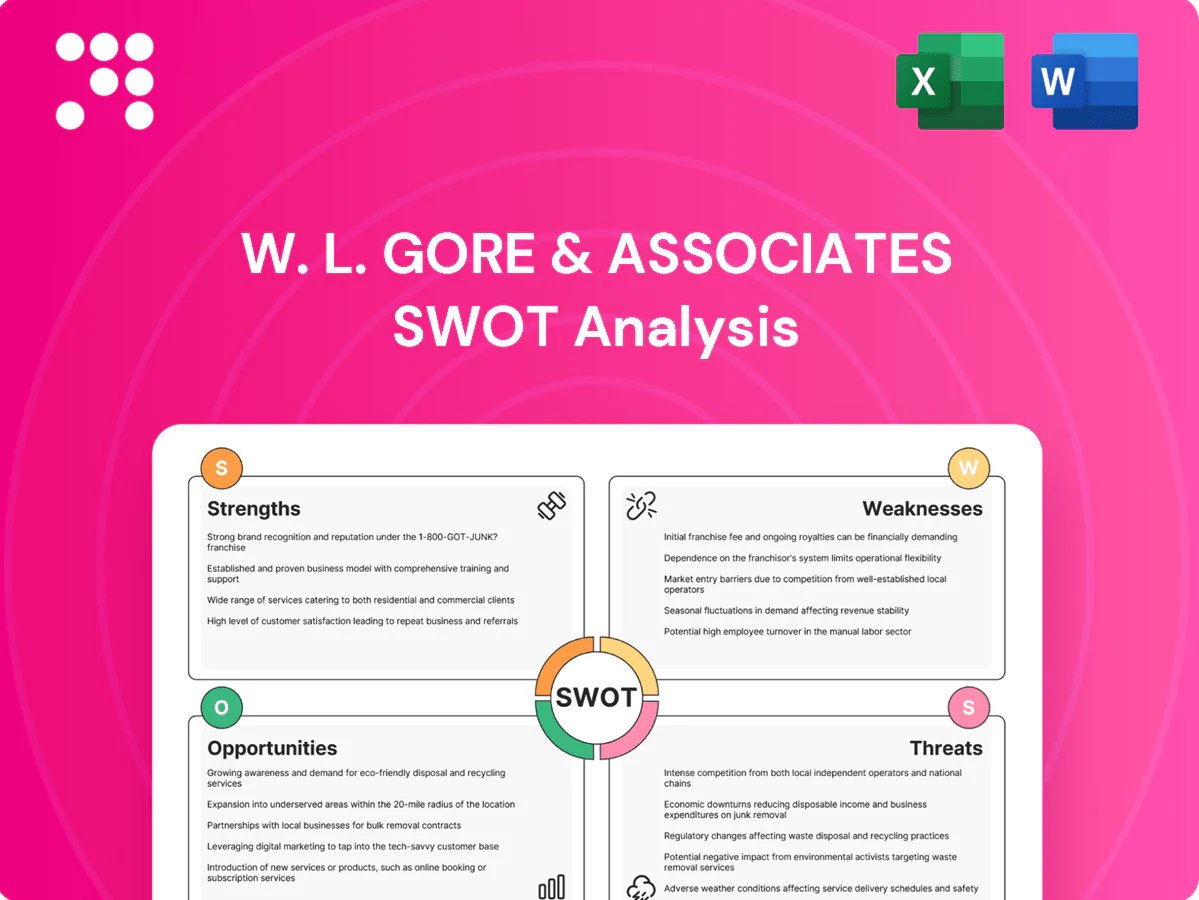
W. L. Gore & Associates SWOT Analysis

Dive Deeper Into the Company’s Strategic Blueprint
W. L. Gore & Associates' SWOT analysis highlights its innovation-driven culture, resilient specialty-materials portfolio, and global manufacturing strengths, against challenges like supply-chain exposure and competitive biotech entrants. Discover strategic risks, financial context, and growth levers in the full report. Purchase the complete SWOT—Word and Excel deliverables—for actionable insights and planning.
Strengths

Deep PTFE materials mastery
Deep PTFE mastery: over 65 years since 1958 of R&D in PTFE/ePTFE has produced hundreds of patents and a workforce of about 12,000, enabling membranes that outperform peers in medical, industrial and aerospace use-cases. Proprietary process know-how creates defensible differentiation, reducing failure rates and sustaining premium pricing. This expertise shortens innovation cycles across multiple end-markets.
Iconic GORE-TEX brand equity
GORE-TEX, introduced in 1976, is the gold standard in waterproof-breathable fabrics with strong consumer pull and OEM loyalty built over nearly 50 years. The brand drives specification wins and long-term contracts with leading apparel and footwear makers. Co-branding increases pricing power and shelf presence for partners. It also provides a proven platform to commercialize next-gen sustainable membrane technologies.

Diversified end-market portfolio
Diversified end-market portfolio spans medical devices, performance fabrics, industrial filtration, aerospace and electronics, supporting roughly $3.8 billion revenue and about 11,000 employees in 2023; this mix smooths cyclicality and balances consumer and industrial demand, while cross-market technology reuse improves R&D ROI and broadens optionality for growth investments.

High IP intensity and quality reputation
W. L. Gore leverages a robust IP estate—thousands of patents and trade secrets protecting materials, processes and applications—driving reliability in mission-critical medical and aerospace uses that raise switching costs. Qualification barriers in these sectors entrench incumbency, supporting resilient margins and recurring revenue; Gore reported annual sales in the multi‑billion dollar range in recent years.
- IP: thousands of patents
- Markets: medical, aerospace qualification barriers
- Financial: multi‑billion annual sales
- Outcome: resilient margins, recurring revenue
Unique innovation culture and manufacturing
Gore’s lattice organization empowers technical talent and rapid problem-solving, enabling cross-disciplinary teams within a company that reported roughly $3.8 billion revenue and ~11,500 employees in 2023. Close coupling of R&D and manufacturing accelerates scale-up and customization, while precision cleanroom and membrane capabilities are highly specialized and hard to replicate. This tight integration shortens time-to-value for customers through faster iteration and deployment.
- lattice org: decentralized innovation, rapid problem-solving
- R&D+manufacturing: faster scale-up, tailored solutions
- capabilities: precision, cleanroom, membrane tech hard to replicate
- impact: reduced time-to-value for customers
PTFE/ePTFE leader since 1958 — $3.8B revenue, ~11,500 employees
Market-leading PTFE/ePTFE expertise since 1958 with thousands of patents enables premium margins and fast innovation; 2023 revenue ~3.8B and ~11,500 employees. GORE-TEX brand drives OEM loyalty in apparel; medical and aerospace qualification barriers create high switching costs and recurring revenue. Lattice org + integrated R&D/manufacturing accelerates scale-up and customized solutions.
| Metric | 2023 |
|---|---|
| Revenue | $3.8B |
| Employees | ~11,500 |
| Patents | Thousands |
What is included in the product
 Detailed Word Document
Delivers a strategic overview of W. L. Gore & Associates’s internal and external business factors, outlining its strengths, weaknesses, opportunities, and threats to assess competitive position and future risks.

 Customizable Excel Spreadsheet
Provides a concise SWOT matrix tailored to W. L. Gore & Associates for fast, visual strategy alignment and cross‑unit comparisons. Perfect for executives and teams needing a clear snapshot of Gore's strategic positioning for presentations and planning.
Weaknesses

Fluoropolymer dependency
Heavy reliance on PTFE and related chemistries concentrates Gore’s materials risk, especially as the OECD catalogues roughly 4,700 PFAS substances, keeping regulatory focus intense. PFAS restrictions in the EU and US narrow material choices and force costly reformulation for validated products, where qualification cycles often span 2–5 years. Customer concerns over PFAS can further slow adoption.
Higher cost structure
Premium polymers, stringent quality systems and specialized manufacturing raise Gore’s unit costs, limiting price competitiveness versus commodity alternatives in less critical applications. Cost-to-serve for small-batch custom runs is high, constraining penetration in cost-sensitive segments. As a privately held company with roughly 11,000 associates worldwide, Gore’s high-touch model reinforces this higher cost structure.

Private company capital and visibility limits
As a privately held company, Gore faces constrained access to large-scale, low-cost equity financing compared with public peers, which can slow capital-intensive moves such as new manufacturing lines; the firm reported roughly $3.8 billion in revenue in 2023 and about 11,000 employees, yet cannot tap public markets for rapid equity. Lower disclosure limits market signaling to partners and talent, and benchmarking versus public peers remains less transparent.

Brand concentration in outdoor apparel
GORE-TEX concentration ties a meaningful share of W. L. Gore & Associates' consumer-facing revenues to discretionary outdoor apparel cycles; Gore reported roughly $3.8 billion in revenue in FY2023. Warm winters or rapid fashion shifts can depress volumes, while retail inventory swings amplify short-term volatility and margin pressure. Dependence on a few major OEMs raises channel and pricing risk.
- GORE-TEX reliance: consumer cyclicality
- Weather/fashion risk: volume sensitivity
- Retail inventory: amplifies volatility
- OEM concentration: channel risk
Supply chain and precursor exposure
PTFE value chain depends on critical precursors and fluorspar; China accounted for about 63% of global fluorspar mine production in 2023 (USGS), concentrating supply. Regional disruptions or export controls can tighten resin availability and push up prices. Qualification of new suppliers in regulated markets commonly exceeds 12 months, slowing diversification. Inventory buffers to hedge risk increase working capital requirements.
- High geographic concentration: China ~63% of fluorspar (2023)
- Supplier qualification: often >12 months in regulated sectors
- Inventory buffers raise working capital and carrying costs
PFAS reformulation slows growth; premium polymers and private ownership constrain scale
Heavy PTFE/PFAS concentration (OECD ~4,700 PFAS) and PFAS regulation force costly reformulation (product qualification 2–5 years) and slow adoption. Premium polymers and high-touch manufacturing drive higher unit costs and limit price competitiveness. Private ownership limits rapid equity access despite roughly $3.8B revenue (FY2023) and ~11,000 employees, constraining capital for expansion.
| Metric | Value |
|---|---|
| FY2023 revenue | $3.8B |
| Employees | ~11,000 |
| China fluorspar share (2023) | ~63% (USGS) |
| OECD PFAS catalog | ~4,700 |
| Supplier qual. | >12 months |
| Reformulation/qual. | 2–5 years |
Same Document Delivered
W. L. Gore & Associates SWOT Analysis
This is the actual SWOT analysis document you’ll receive upon purchase—no surprises, just professional quality. The preview below is taken directly from the full report on W. L. Gore & Associates; purchase unlocks the editable, complete version with strengths, weaknesses, opportunities and threats. Use it for strategic planning, competitive analysis, or valuation work.

Dive Deeper Into the Company’s Strategic Blueprint
W. L. Gore & Associates' SWOT analysis highlights its innovation-driven culture, resilient specialty-materials portfolio, and global manufacturing strengths, against challenges like supply-chain exposure and competitive biotech entrants. Discover strategic risks, financial context, and growth levers in the full report. Purchase the complete SWOT—Word and Excel deliverables—for actionable insights and planning.
Strengths
Deep PTFE materials mastery
Deep PTFE mastery: over 65 years since 1958 of R&D in PTFE/ePTFE has produced hundreds of patents and a workforce of about 12,000, enabling membranes that outperform peers in medical, industrial and aerospace use-cases. Proprietary process know-how creates defensible differentiation, reducing failure rates and sustaining premium pricing. This expertise shortens innovation cycles across multiple end-markets.
Iconic GORE-TEX brand equity
GORE-TEX, introduced in 1976, is the gold standard in waterproof-breathable fabrics with strong consumer pull and OEM loyalty built over nearly 50 years. The brand drives specification wins and long-term contracts with leading apparel and footwear makers. Co-branding increases pricing power and shelf presence for partners. It also provides a proven platform to commercialize next-gen sustainable membrane technologies.
Diversified end-market portfolio
Diversified end-market portfolio spans medical devices, performance fabrics, industrial filtration, aerospace and electronics, supporting roughly $3.8 billion revenue and about 11,000 employees in 2023; this mix smooths cyclicality and balances consumer and industrial demand, while cross-market technology reuse improves R&D ROI and broadens optionality for growth investments.
High IP intensity and quality reputation
W. L. Gore leverages a robust IP estate—thousands of patents and trade secrets protecting materials, processes and applications—driving reliability in mission-critical medical and aerospace uses that raise switching costs. Qualification barriers in these sectors entrench incumbency, supporting resilient margins and recurring revenue; Gore reported annual sales in the multi‑billion dollar range in recent years.
- IP: thousands of patents
- Markets: medical, aerospace qualification barriers
- Financial: multi‑billion annual sales
- Outcome: resilient margins, recurring revenue
Unique innovation culture and manufacturing
Gore’s lattice organization empowers technical talent and rapid problem-solving, enabling cross-disciplinary teams within a company that reported roughly $3.8 billion revenue and ~11,500 employees in 2023. Close coupling of R&D and manufacturing accelerates scale-up and customization, while precision cleanroom and membrane capabilities are highly specialized and hard to replicate. This tight integration shortens time-to-value for customers through faster iteration and deployment.
- lattice org: decentralized innovation, rapid problem-solving
- R&D+manufacturing: faster scale-up, tailored solutions
- capabilities: precision, cleanroom, membrane tech hard to replicate
- impact: reduced time-to-value for customers
PTFE/ePTFE leader since 1958 — $3.8B revenue, ~11,500 employees
Market-leading PTFE/ePTFE expertise since 1958 with thousands of patents enables premium margins and fast innovation; 2023 revenue ~3.8B and ~11,500 employees. GORE-TEX brand drives OEM loyalty in apparel; medical and aerospace qualification barriers create high switching costs and recurring revenue. Lattice org + integrated R&D/manufacturing accelerates scale-up and customized solutions.
| Metric | 2023 |
|---|---|
| Revenue | $3.8B |
| Employees | ~11,500 |
| Patents | Thousands |
What is included in the product
Detailed Word Document
Delivers a strategic overview of W. L. Gore & Associates’s internal and external business factors, outlining its strengths, weaknesses, opportunities, and threats to assess competitive position and future risks.
Customizable Excel Spreadsheet
Provides a concise SWOT matrix tailored to W. L. Gore & Associates for fast, visual strategy alignment and cross‑unit comparisons. Perfect for executives and teams needing a clear snapshot of Gore's strategic positioning for presentations and planning.
Weaknesses
Fluoropolymer dependency
Heavy reliance on PTFE and related chemistries concentrates Gore’s materials risk, especially as the OECD catalogues roughly 4,700 PFAS substances, keeping regulatory focus intense. PFAS restrictions in the EU and US narrow material choices and force costly reformulation for validated products, where qualification cycles often span 2–5 years. Customer concerns over PFAS can further slow adoption.
Higher cost structure
Premium polymers, stringent quality systems and specialized manufacturing raise Gore’s unit costs, limiting price competitiveness versus commodity alternatives in less critical applications. Cost-to-serve for small-batch custom runs is high, constraining penetration in cost-sensitive segments. As a privately held company with roughly 11,000 associates worldwide, Gore’s high-touch model reinforces this higher cost structure.
Private company capital and visibility limits
As a privately held company, Gore faces constrained access to large-scale, low-cost equity financing compared with public peers, which can slow capital-intensive moves such as new manufacturing lines; the firm reported roughly $3.8 billion in revenue in 2023 and about 11,000 employees, yet cannot tap public markets for rapid equity. Lower disclosure limits market signaling to partners and talent, and benchmarking versus public peers remains less transparent.
Brand concentration in outdoor apparel
GORE-TEX concentration ties a meaningful share of W. L. Gore & Associates' consumer-facing revenues to discretionary outdoor apparel cycles; Gore reported roughly $3.8 billion in revenue in FY2023. Warm winters or rapid fashion shifts can depress volumes, while retail inventory swings amplify short-term volatility and margin pressure. Dependence on a few major OEMs raises channel and pricing risk.
- GORE-TEX reliance: consumer cyclicality
- Weather/fashion risk: volume sensitivity
- Retail inventory: amplifies volatility
- OEM concentration: channel risk
Supply chain and precursor exposure
PTFE value chain depends on critical precursors and fluorspar; China accounted for about 63% of global fluorspar mine production in 2023 (USGS), concentrating supply. Regional disruptions or export controls can tighten resin availability and push up prices. Qualification of new suppliers in regulated markets commonly exceeds 12 months, slowing diversification. Inventory buffers to hedge risk increase working capital requirements.
- High geographic concentration: China ~63% of fluorspar (2023)
- Supplier qualification: often >12 months in regulated sectors
- Inventory buffers raise working capital and carrying costs
PFAS reformulation slows growth; premium polymers and private ownership constrain scale
Heavy PTFE/PFAS concentration (OECD ~4,700 PFAS) and PFAS regulation force costly reformulation (product qualification 2–5 years) and slow adoption. Premium polymers and high-touch manufacturing drive higher unit costs and limit price competitiveness. Private ownership limits rapid equity access despite roughly $3.8B revenue (FY2023) and ~11,000 employees, constraining capital for expansion.
| Metric | Value |
|---|---|
| FY2023 revenue | $3.8B |
| Employees | ~11,000 |
| China fluorspar share (2023) | ~63% (USGS) |
| OECD PFAS catalog | ~4,700 |
| Supplier qual. | >12 months |
| Reformulation/qual. | 2–5 years |
Same Document Delivered
W. L. Gore & Associates SWOT Analysis
This is the actual SWOT analysis document you’ll receive upon purchase—no surprises, just professional quality. The preview below is taken directly from the full report on W. L. Gore & Associates; purchase unlocks the editable, complete version with strengths, weaknesses, opportunities and threats. Use it for strategic planning, competitive analysis, or valuation work.
Original: $10.00
-65%$10.00
$3.50Description
Dive Deeper Into the Company’s Strategic Blueprint
W. L. Gore & Associates' SWOT analysis highlights its innovation-driven culture, resilient specialty-materials portfolio, and global manufacturing strengths, against challenges like supply-chain exposure and competitive biotech entrants. Discover strategic risks, financial context, and growth levers in the full report. Purchase the complete SWOT—Word and Excel deliverables—for actionable insights and planning.
Strengths
Deep PTFE materials mastery
Deep PTFE mastery: over 65 years since 1958 of R&D in PTFE/ePTFE has produced hundreds of patents and a workforce of about 12,000, enabling membranes that outperform peers in medical, industrial and aerospace use-cases. Proprietary process know-how creates defensible differentiation, reducing failure rates and sustaining premium pricing. This expertise shortens innovation cycles across multiple end-markets.
Iconic GORE-TEX brand equity
GORE-TEX, introduced in 1976, is the gold standard in waterproof-breathable fabrics with strong consumer pull and OEM loyalty built over nearly 50 years. The brand drives specification wins and long-term contracts with leading apparel and footwear makers. Co-branding increases pricing power and shelf presence for partners. It also provides a proven platform to commercialize next-gen sustainable membrane technologies.
Diversified end-market portfolio
Diversified end-market portfolio spans medical devices, performance fabrics, industrial filtration, aerospace and electronics, supporting roughly $3.8 billion revenue and about 11,000 employees in 2023; this mix smooths cyclicality and balances consumer and industrial demand, while cross-market technology reuse improves R&D ROI and broadens optionality for growth investments.
High IP intensity and quality reputation
W. L. Gore leverages a robust IP estate—thousands of patents and trade secrets protecting materials, processes and applications—driving reliability in mission-critical medical and aerospace uses that raise switching costs. Qualification barriers in these sectors entrench incumbency, supporting resilient margins and recurring revenue; Gore reported annual sales in the multi‑billion dollar range in recent years.
- IP: thousands of patents
- Markets: medical, aerospace qualification barriers
- Financial: multi‑billion annual sales
- Outcome: resilient margins, recurring revenue
Unique innovation culture and manufacturing
Gore’s lattice organization empowers technical talent and rapid problem-solving, enabling cross-disciplinary teams within a company that reported roughly $3.8 billion revenue and ~11,500 employees in 2023. Close coupling of R&D and manufacturing accelerates scale-up and customization, while precision cleanroom and membrane capabilities are highly specialized and hard to replicate. This tight integration shortens time-to-value for customers through faster iteration and deployment.
- lattice org: decentralized innovation, rapid problem-solving
- R&D+manufacturing: faster scale-up, tailored solutions
- capabilities: precision, cleanroom, membrane tech hard to replicate
- impact: reduced time-to-value for customers
PTFE/ePTFE leader since 1958 — $3.8B revenue, ~11,500 employees
Market-leading PTFE/ePTFE expertise since 1958 with thousands of patents enables premium margins and fast innovation; 2023 revenue ~3.8B and ~11,500 employees. GORE-TEX brand drives OEM loyalty in apparel; medical and aerospace qualification barriers create high switching costs and recurring revenue. Lattice org + integrated R&D/manufacturing accelerates scale-up and customized solutions.
| Metric | 2023 |
|---|---|
| Revenue | $3.8B |
| Employees | ~11,500 |
| Patents | Thousands |
What is included in the product
Detailed Word Document
Delivers a strategic overview of W. L. Gore & Associates’s internal and external business factors, outlining its strengths, weaknesses, opportunities, and threats to assess competitive position and future risks.
Customizable Excel Spreadsheet
Provides a concise SWOT matrix tailored to W. L. Gore & Associates for fast, visual strategy alignment and cross‑unit comparisons. Perfect for executives and teams needing a clear snapshot of Gore's strategic positioning for presentations and planning.
Weaknesses
Fluoropolymer dependency
Heavy reliance on PTFE and related chemistries concentrates Gore’s materials risk, especially as the OECD catalogues roughly 4,700 PFAS substances, keeping regulatory focus intense. PFAS restrictions in the EU and US narrow material choices and force costly reformulation for validated products, where qualification cycles often span 2–5 years. Customer concerns over PFAS can further slow adoption.
Higher cost structure
Premium polymers, stringent quality systems and specialized manufacturing raise Gore’s unit costs, limiting price competitiveness versus commodity alternatives in less critical applications. Cost-to-serve for small-batch custom runs is high, constraining penetration in cost-sensitive segments. As a privately held company with roughly 11,000 associates worldwide, Gore’s high-touch model reinforces this higher cost structure.
Private company capital and visibility limits
As a privately held company, Gore faces constrained access to large-scale, low-cost equity financing compared with public peers, which can slow capital-intensive moves such as new manufacturing lines; the firm reported roughly $3.8 billion in revenue in 2023 and about 11,000 employees, yet cannot tap public markets for rapid equity. Lower disclosure limits market signaling to partners and talent, and benchmarking versus public peers remains less transparent.
Brand concentration in outdoor apparel
GORE-TEX concentration ties a meaningful share of W. L. Gore & Associates' consumer-facing revenues to discretionary outdoor apparel cycles; Gore reported roughly $3.8 billion in revenue in FY2023. Warm winters or rapid fashion shifts can depress volumes, while retail inventory swings amplify short-term volatility and margin pressure. Dependence on a few major OEMs raises channel and pricing risk.
- GORE-TEX reliance: consumer cyclicality
- Weather/fashion risk: volume sensitivity
- Retail inventory: amplifies volatility
- OEM concentration: channel risk
Supply chain and precursor exposure
PTFE value chain depends on critical precursors and fluorspar; China accounted for about 63% of global fluorspar mine production in 2023 (USGS), concentrating supply. Regional disruptions or export controls can tighten resin availability and push up prices. Qualification of new suppliers in regulated markets commonly exceeds 12 months, slowing diversification. Inventory buffers to hedge risk increase working capital requirements.
- High geographic concentration: China ~63% of fluorspar (2023)
- Supplier qualification: often >12 months in regulated sectors
- Inventory buffers raise working capital and carrying costs
PFAS reformulation slows growth; premium polymers and private ownership constrain scale
Heavy PTFE/PFAS concentration (OECD ~4,700 PFAS) and PFAS regulation force costly reformulation (product qualification 2–5 years) and slow adoption. Premium polymers and high-touch manufacturing drive higher unit costs and limit price competitiveness. Private ownership limits rapid equity access despite roughly $3.8B revenue (FY2023) and ~11,000 employees, constraining capital for expansion.
| Metric | Value |
|---|---|
| FY2023 revenue | $3.8B |
| Employees | ~11,000 |
| China fluorspar share (2023) | ~63% (USGS) |
| OECD PFAS catalog | ~4,700 |
| Supplier qual. | >12 months |
| Reformulation/qual. | 2–5 years |
Same Document Delivered
W. L. Gore & Associates SWOT Analysis
This is the actual SWOT analysis document you’ll receive upon purchase—no surprises, just professional quality. The preview below is taken directly from the full report on W. L. Gore & Associates; purchase unlocks the editable, complete version with strengths, weaknesses, opportunities and threats. Use it for strategic planning, competitive analysis, or valuation work.











