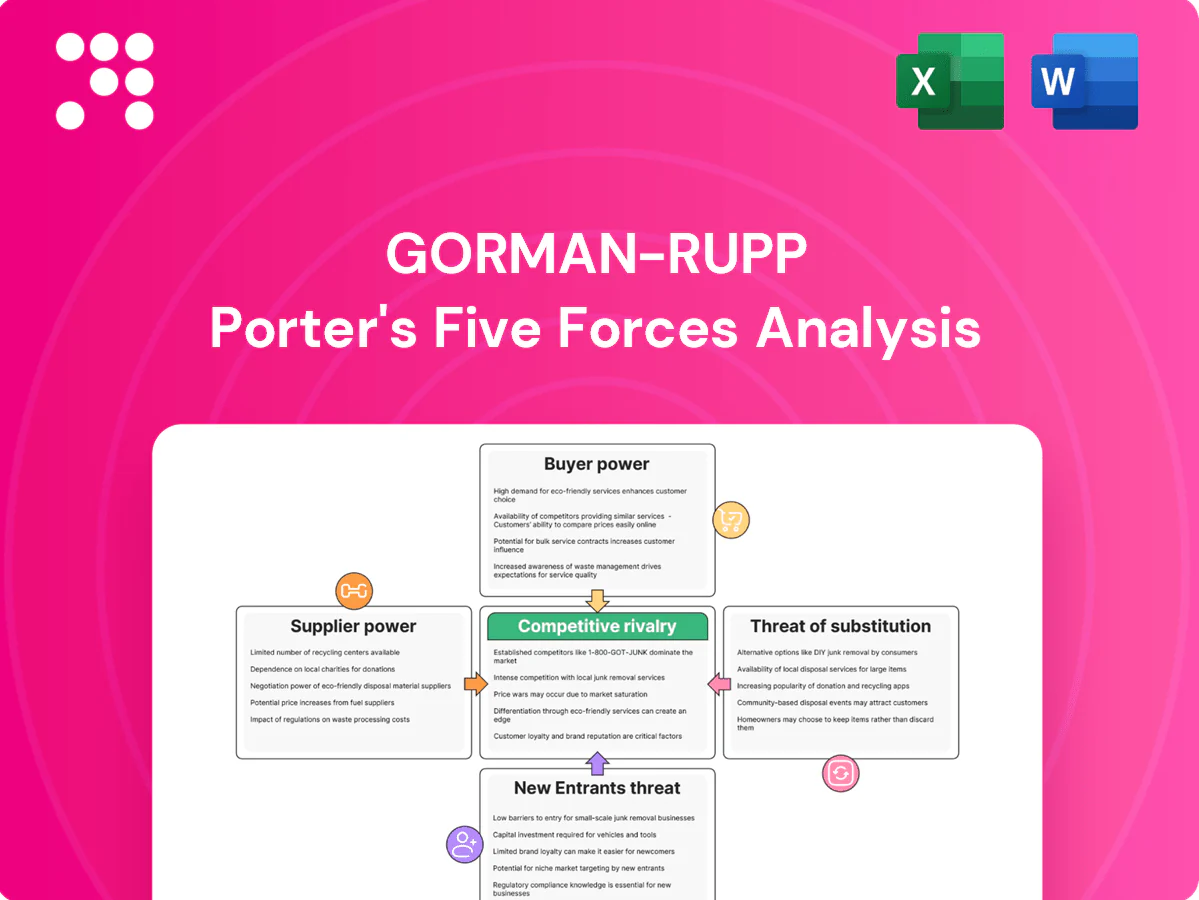
Gorman-Rupp Porter's Five Forces Analysis

A Must-Have Tool for Decision-Makers
Gorman-Rupp’s Porter's Five Forces snapshot examines supplier and buyer leverage, rivalry among pump manufacturers, substitute technologies, and barriers to entry—highlighting strengths in aftermarket services and risks from raw material cost swings. This brief snapshot only scratches the surface. Unlock the full Porter's Five Forces Analysis to explore Gorman-Rupp’s competitive dynamics, market pressures, and strategic advantages in detail.
Suppliers Bargaining Power

Specialized castings and machined parts
Many Gorman-Rupp pump components need precision castings and tight-tolerance machining, leaving a small pool of qualified suppliers; in 2024 industry reports show precision castings concentrate supply, with leading foundries handling over half of OEM demand. Tooling costs and limited foundry capacity amplify supplier leverage and raise switching risks. Dual-sourcing and long-term contracts mitigate but don’t eliminate supply-shock effects on lead times and output.
Critical subassemblies (motors, seals, controls)
Mechanical seals, electric motors and control electronics for Gorman-Rupp are high-value, concentrated inputs with relatively few global manufacturers, making suppliers more powerful. Custom specifications and lengthy qualification cycles for pumps and OEMs increase vendor dependence and slow switching. During demand upcycles lead-time volatility and allocation practices amplify supplier leverage, pressuring margins and delivery predictability.

Commodity metals price volatility
Steel HRC, iron ore and LME copper volatility in 2024 materially affected Gorman-Rupp pump cost structures — LME copper averaged roughly $9,200/ton, iron ore 62% ~ $115/ton and US HRC near $900/ton, so sudden swings compressed margins when costs could not be hedged or passed through. Index-based surcharges and supplier clauses mitigate impact but lag industry lead times, giving suppliers leverage in tight commodity markets.

Logistics and geopolitical risks
Global shipping constraints and regional disruptions in 2024 raised supplier leverage for Gorman-Rupp, with container rate volatility causing delays and cost pass-throughs; US Section 301 tariffs remain up to 25% on many Chinese imports, increasing component costs. Nearshoring reduces lead-time risk but can add ~10–20% in unit cost; safety stock and localization moderate exposure.
- Container volatility → higher delay risk
- Tariffs (up to 25%) → higher input costs
- Nearshoring +10–20% unit cost
Qualification and compliance requirements
UL/FM fire, NSF/ANSI and military specifications mandate validated vendor parts for Gorman-Rupp, meaning components must pass strict certification and traceability checks; re-qualifying alternatives often takes 6–12 months and can exceed $100,000 per supplier (industry 2024), raising switching costs and amplifying supplier leverage, while approved-vendor lists further entrench supplier positions.
- Validation mandates: UL/FM, NSF/ANSI, military specs
- Re-qualify time/cost: 6–12 months; >$100,000 (2024)
- Effect: higher switching costs, increased supplier influence
- Approved-vendor lists: entrench incumbents
Foundry concentration, input-cost surge and tariffs squeeze OEM margins and raise switching risk
Supplier base is concentrated—leading foundries supply >50% of OEM precision castings—raising leverage and switching risk. Key inputs: LME copper ~$9,200/t, iron ore ~$115/t, US HRC ~$900/t, compress margins when volatile. Re-qualification 6–12 months, >$100,000 increases lock-in; tariffs up to 25% and shipping volatility add cost and delay.
| Item | 2024 metric | Impact |
|---|---|---|
| Precision castings | >50% OEM | High leverage |
| Copper | $9,200/t | Cost pressure |
| Iron ore | $115/t | Cost pressure |
| HRC | $900/t | Cost pressure |
| Re-qual | 6–12m; >$100k | High switching cost |
| Tariffs | Up to 25% | Higher input cost |
| Nearshoring | +10–20% | Lower lead-time risk |
What is included in the product
 Detailed Word Document
Uncovers key competitive drivers—supplier and buyer power, entry barriers, substitutes, and rivalry—shaping Gorman‑Rupp’s profitability while identifying disruptive threats and strategic defenses, delivered in fully editable Word format for investor, internal, or academic use.

 Customizable Excel Spreadsheet
A single-sheet Gorman-Rupp Five Forces snapshot that clearly maps supplier, buyer, rivalry, substitutes and entrant pressures—perfect for quick strategic decisions and boardroom use. Swap in your data or toggle scenarios to instantly visualize shifts and relieve analysis bottlenecks.
Customers Bargaining Power

Municipal and utility procurement scale
Cities and water districts purchase large, planned fleets via formal RFPs—procurement cycles typically 3–7 years—concentrating buying power and driving competitive bids that pressure price and contract terms. Large municipal contracts often exceed $1M, increasing buyer leverage. Performance specifications and life-cycle cost evaluation (pump lives ~15–25 years) temper pure price focus, and long asset lives reduce rebid frequency.
Industrial and construction price sensitivity
Contractors and industrial buyers in 2024 heavily emphasized upfront cost and delivery, with the global pump market valued at about $62 billion in 2024 increasing price competition. Multiple comparable pump options and OEM commoditization intensify bargaining and price negotiations. Project timelines make lead time a decisive leverage point, while extended warranty and responsive service agreements frequently offset unit price pressure.

Switching costs from installed base
Piping layouts, bases, and controls are often tailored to specific Gorman-Rupp pump models, so switching requires re-engineering that can add 10–30% to project costs, plus days to weeks of downtime and site retraining. Aftermarket parts compatibility and OEM-certified service anchor customers, with aftermarket sales representing a significant recurring revenue stream in 2024. These factors materially reduce buyer power for replacements and capacity expansions.

Channel intermediaries and distributors
- Distributor aggregation: volume leverage
- Local service: lowers friction
- Strong ties: reduce buyer leverage
- Poor coverage: increases end-customer power (2024)
Performance-critical applications
Performance-critical uses such as fire protection, wastewater lift, and military systems prioritize reliability and certifications over price; Gartner estimates downtime can cost organizations around 300,000 per hour, so failure costs quickly eclipse small price differences. Buyers focus on total cost of ownership and uptime metrics, and proven track records and certifications regularly beat lowest bids in procurement decisions.
- Reliability over price
- Downtime ≈ 300,000/hr (Gartner)
- TCO and uptime drive purchases
- Proven track records win contracts
Municipal RFPs (3–7 yrs) & >$1M bids squeeze margins despite $62B market
Customers wield strong leverage via concentrated municipal RFPs (procurement cycles 3–7 years) and >$1M contracts, intensifying price pressure; global pump market ≈ $62B (2024) heightens competition. Long pump lives (15–25 years), switching costs (≈10–30%), and high downtime cost (~300,000/hr) reduce pure price power; distributors and service tie-ups further blunt buyer bargaining.
| Metric | Value (2024) |
|---|---|
| Market size | $62B |
| Municipal procurement | 3–7 yrs / >$1M |
| Pump life | 15–25 yrs |
| Switching cost | 10–30% |
| Downtime cost | ~300,000/hr |
Preview the Actual Deliverable
Gorman-Rupp Porter's Five Forces Analysis
This preview shows the complete Gorman-Rupp Porter's Five Forces analysis you'll receive after purchase—fully formatted and ready to use. It is the exact document delivered instantly upon payment, with no placeholders or edits required. Use it for decision-making, reporting, or strategy immediately.

A Must-Have Tool for Decision-Makers
Gorman-Rupp’s Porter's Five Forces snapshot examines supplier and buyer leverage, rivalry among pump manufacturers, substitute technologies, and barriers to entry—highlighting strengths in aftermarket services and risks from raw material cost swings. This brief snapshot only scratches the surface. Unlock the full Porter's Five Forces Analysis to explore Gorman-Rupp’s competitive dynamics, market pressures, and strategic advantages in detail.
Suppliers Bargaining Power
Specialized castings and machined parts
Many Gorman-Rupp pump components need precision castings and tight-tolerance machining, leaving a small pool of qualified suppliers; in 2024 industry reports show precision castings concentrate supply, with leading foundries handling over half of OEM demand. Tooling costs and limited foundry capacity amplify supplier leverage and raise switching risks. Dual-sourcing and long-term contracts mitigate but don’t eliminate supply-shock effects on lead times and output.
Critical subassemblies (motors, seals, controls)
Mechanical seals, electric motors and control electronics for Gorman-Rupp are high-value, concentrated inputs with relatively few global manufacturers, making suppliers more powerful. Custom specifications and lengthy qualification cycles for pumps and OEMs increase vendor dependence and slow switching. During demand upcycles lead-time volatility and allocation practices amplify supplier leverage, pressuring margins and delivery predictability.
Commodity metals price volatility
Steel HRC, iron ore and LME copper volatility in 2024 materially affected Gorman-Rupp pump cost structures — LME copper averaged roughly $9,200/ton, iron ore 62% ~ $115/ton and US HRC near $900/ton, so sudden swings compressed margins when costs could not be hedged or passed through. Index-based surcharges and supplier clauses mitigate impact but lag industry lead times, giving suppliers leverage in tight commodity markets.
Logistics and geopolitical risks
Global shipping constraints and regional disruptions in 2024 raised supplier leverage for Gorman-Rupp, with container rate volatility causing delays and cost pass-throughs; US Section 301 tariffs remain up to 25% on many Chinese imports, increasing component costs. Nearshoring reduces lead-time risk but can add ~10–20% in unit cost; safety stock and localization moderate exposure.
- Container volatility → higher delay risk
- Tariffs (up to 25%) → higher input costs
- Nearshoring +10–20% unit cost
Qualification and compliance requirements
UL/FM fire, NSF/ANSI and military specifications mandate validated vendor parts for Gorman-Rupp, meaning components must pass strict certification and traceability checks; re-qualifying alternatives often takes 6–12 months and can exceed $100,000 per supplier (industry 2024), raising switching costs and amplifying supplier leverage, while approved-vendor lists further entrench supplier positions.
- Validation mandates: UL/FM, NSF/ANSI, military specs
- Re-qualify time/cost: 6–12 months; >$100,000 (2024)
- Effect: higher switching costs, increased supplier influence
- Approved-vendor lists: entrench incumbents
Foundry concentration, input-cost surge and tariffs squeeze OEM margins and raise switching risk
Supplier base is concentrated—leading foundries supply >50% of OEM precision castings—raising leverage and switching risk. Key inputs: LME copper ~$9,200/t, iron ore ~$115/t, US HRC ~$900/t, compress margins when volatile. Re-qualification 6–12 months, >$100,000 increases lock-in; tariffs up to 25% and shipping volatility add cost and delay.
| Item | 2024 metric | Impact |
|---|---|---|
| Precision castings | >50% OEM | High leverage |
| Copper | $9,200/t | Cost pressure |
| Iron ore | $115/t | Cost pressure |
| HRC | $900/t | Cost pressure |
| Re-qual | 6–12m; >$100k | High switching cost |
| Tariffs | Up to 25% | Higher input cost |
| Nearshoring | +10–20% | Lower lead-time risk |
What is included in the product
Detailed Word Document
Uncovers key competitive drivers—supplier and buyer power, entry barriers, substitutes, and rivalry—shaping Gorman‑Rupp’s profitability while identifying disruptive threats and strategic defenses, delivered in fully editable Word format for investor, internal, or academic use.
Customizable Excel Spreadsheet
A single-sheet Gorman-Rupp Five Forces snapshot that clearly maps supplier, buyer, rivalry, substitutes and entrant pressures—perfect for quick strategic decisions and boardroom use. Swap in your data or toggle scenarios to instantly visualize shifts and relieve analysis bottlenecks.
Customers Bargaining Power
Municipal and utility procurement scale
Cities and water districts purchase large, planned fleets via formal RFPs—procurement cycles typically 3–7 years—concentrating buying power and driving competitive bids that pressure price and contract terms. Large municipal contracts often exceed $1M, increasing buyer leverage. Performance specifications and life-cycle cost evaluation (pump lives ~15–25 years) temper pure price focus, and long asset lives reduce rebid frequency.
Industrial and construction price sensitivity
Contractors and industrial buyers in 2024 heavily emphasized upfront cost and delivery, with the global pump market valued at about $62 billion in 2024 increasing price competition. Multiple comparable pump options and OEM commoditization intensify bargaining and price negotiations. Project timelines make lead time a decisive leverage point, while extended warranty and responsive service agreements frequently offset unit price pressure.
Switching costs from installed base
Piping layouts, bases, and controls are often tailored to specific Gorman-Rupp pump models, so switching requires re-engineering that can add 10–30% to project costs, plus days to weeks of downtime and site retraining. Aftermarket parts compatibility and OEM-certified service anchor customers, with aftermarket sales representing a significant recurring revenue stream in 2024. These factors materially reduce buyer power for replacements and capacity expansions.
Channel intermediaries and distributors
- Distributor aggregation: volume leverage
- Local service: lowers friction
- Strong ties: reduce buyer leverage
- Poor coverage: increases end-customer power (2024)
Performance-critical applications
Performance-critical uses such as fire protection, wastewater lift, and military systems prioritize reliability and certifications over price; Gartner estimates downtime can cost organizations around 300,000 per hour, so failure costs quickly eclipse small price differences. Buyers focus on total cost of ownership and uptime metrics, and proven track records and certifications regularly beat lowest bids in procurement decisions.
- Reliability over price
- Downtime ≈ 300,000/hr (Gartner)
- TCO and uptime drive purchases
- Proven track records win contracts
Municipal RFPs (3–7 yrs) & >$1M bids squeeze margins despite $62B market
Customers wield strong leverage via concentrated municipal RFPs (procurement cycles 3–7 years) and >$1M contracts, intensifying price pressure; global pump market ≈ $62B (2024) heightens competition. Long pump lives (15–25 years), switching costs (≈10–30%), and high downtime cost (~300,000/hr) reduce pure price power; distributors and service tie-ups further blunt buyer bargaining.
| Metric | Value (2024) |
|---|---|
| Market size | $62B |
| Municipal procurement | 3–7 yrs / >$1M |
| Pump life | 15–25 yrs |
| Switching cost | 10–30% |
| Downtime cost | ~300,000/hr |
Preview the Actual Deliverable
Gorman-Rupp Porter's Five Forces Analysis
This preview shows the complete Gorman-Rupp Porter's Five Forces analysis you'll receive after purchase—fully formatted and ready to use. It is the exact document delivered instantly upon payment, with no placeholders or edits required. Use it for decision-making, reporting, or strategy immediately.
Original: $10.00
-65%$10.00
$3.50Description
A Must-Have Tool for Decision-Makers
Gorman-Rupp’s Porter's Five Forces snapshot examines supplier and buyer leverage, rivalry among pump manufacturers, substitute technologies, and barriers to entry—highlighting strengths in aftermarket services and risks from raw material cost swings. This brief snapshot only scratches the surface. Unlock the full Porter's Five Forces Analysis to explore Gorman-Rupp’s competitive dynamics, market pressures, and strategic advantages in detail.
Suppliers Bargaining Power
Specialized castings and machined parts
Many Gorman-Rupp pump components need precision castings and tight-tolerance machining, leaving a small pool of qualified suppliers; in 2024 industry reports show precision castings concentrate supply, with leading foundries handling over half of OEM demand. Tooling costs and limited foundry capacity amplify supplier leverage and raise switching risks. Dual-sourcing and long-term contracts mitigate but don’t eliminate supply-shock effects on lead times and output.
Critical subassemblies (motors, seals, controls)
Mechanical seals, electric motors and control electronics for Gorman-Rupp are high-value, concentrated inputs with relatively few global manufacturers, making suppliers more powerful. Custom specifications and lengthy qualification cycles for pumps and OEMs increase vendor dependence and slow switching. During demand upcycles lead-time volatility and allocation practices amplify supplier leverage, pressuring margins and delivery predictability.
Commodity metals price volatility
Steel HRC, iron ore and LME copper volatility in 2024 materially affected Gorman-Rupp pump cost structures — LME copper averaged roughly $9,200/ton, iron ore 62% ~ $115/ton and US HRC near $900/ton, so sudden swings compressed margins when costs could not be hedged or passed through. Index-based surcharges and supplier clauses mitigate impact but lag industry lead times, giving suppliers leverage in tight commodity markets.
Logistics and geopolitical risks
Global shipping constraints and regional disruptions in 2024 raised supplier leverage for Gorman-Rupp, with container rate volatility causing delays and cost pass-throughs; US Section 301 tariffs remain up to 25% on many Chinese imports, increasing component costs. Nearshoring reduces lead-time risk but can add ~10–20% in unit cost; safety stock and localization moderate exposure.
- Container volatility → higher delay risk
- Tariffs (up to 25%) → higher input costs
- Nearshoring +10–20% unit cost
Qualification and compliance requirements
UL/FM fire, NSF/ANSI and military specifications mandate validated vendor parts for Gorman-Rupp, meaning components must pass strict certification and traceability checks; re-qualifying alternatives often takes 6–12 months and can exceed $100,000 per supplier (industry 2024), raising switching costs and amplifying supplier leverage, while approved-vendor lists further entrench supplier positions.
- Validation mandates: UL/FM, NSF/ANSI, military specs
- Re-qualify time/cost: 6–12 months; >$100,000 (2024)
- Effect: higher switching costs, increased supplier influence
- Approved-vendor lists: entrench incumbents
Foundry concentration, input-cost surge and tariffs squeeze OEM margins and raise switching risk
Supplier base is concentrated—leading foundries supply >50% of OEM precision castings—raising leverage and switching risk. Key inputs: LME copper ~$9,200/t, iron ore ~$115/t, US HRC ~$900/t, compress margins when volatile. Re-qualification 6–12 months, >$100,000 increases lock-in; tariffs up to 25% and shipping volatility add cost and delay.
| Item | 2024 metric | Impact |
|---|---|---|
| Precision castings | >50% OEM | High leverage |
| Copper | $9,200/t | Cost pressure |
| Iron ore | $115/t | Cost pressure |
| HRC | $900/t | Cost pressure |
| Re-qual | 6–12m; >$100k | High switching cost |
| Tariffs | Up to 25% | Higher input cost |
| Nearshoring | +10–20% | Lower lead-time risk |
What is included in the product
Detailed Word Document
Uncovers key competitive drivers—supplier and buyer power, entry barriers, substitutes, and rivalry—shaping Gorman‑Rupp’s profitability while identifying disruptive threats and strategic defenses, delivered in fully editable Word format for investor, internal, or academic use.
Customizable Excel Spreadsheet
A single-sheet Gorman-Rupp Five Forces snapshot that clearly maps supplier, buyer, rivalry, substitutes and entrant pressures—perfect for quick strategic decisions and boardroom use. Swap in your data or toggle scenarios to instantly visualize shifts and relieve analysis bottlenecks.
Customers Bargaining Power
Municipal and utility procurement scale
Cities and water districts purchase large, planned fleets via formal RFPs—procurement cycles typically 3–7 years—concentrating buying power and driving competitive bids that pressure price and contract terms. Large municipal contracts often exceed $1M, increasing buyer leverage. Performance specifications and life-cycle cost evaluation (pump lives ~15–25 years) temper pure price focus, and long asset lives reduce rebid frequency.
Industrial and construction price sensitivity
Contractors and industrial buyers in 2024 heavily emphasized upfront cost and delivery, with the global pump market valued at about $62 billion in 2024 increasing price competition. Multiple comparable pump options and OEM commoditization intensify bargaining and price negotiations. Project timelines make lead time a decisive leverage point, while extended warranty and responsive service agreements frequently offset unit price pressure.
Switching costs from installed base
Piping layouts, bases, and controls are often tailored to specific Gorman-Rupp pump models, so switching requires re-engineering that can add 10–30% to project costs, plus days to weeks of downtime and site retraining. Aftermarket parts compatibility and OEM-certified service anchor customers, with aftermarket sales representing a significant recurring revenue stream in 2024. These factors materially reduce buyer power for replacements and capacity expansions.
Channel intermediaries and distributors
- Distributor aggregation: volume leverage
- Local service: lowers friction
- Strong ties: reduce buyer leverage
- Poor coverage: increases end-customer power (2024)
Performance-critical applications
Performance-critical uses such as fire protection, wastewater lift, and military systems prioritize reliability and certifications over price; Gartner estimates downtime can cost organizations around 300,000 per hour, so failure costs quickly eclipse small price differences. Buyers focus on total cost of ownership and uptime metrics, and proven track records and certifications regularly beat lowest bids in procurement decisions.
- Reliability over price
- Downtime ≈ 300,000/hr (Gartner)
- TCO and uptime drive purchases
- Proven track records win contracts
Municipal RFPs (3–7 yrs) & >$1M bids squeeze margins despite $62B market
Customers wield strong leverage via concentrated municipal RFPs (procurement cycles 3–7 years) and >$1M contracts, intensifying price pressure; global pump market ≈ $62B (2024) heightens competition. Long pump lives (15–25 years), switching costs (≈10–30%), and high downtime cost (~300,000/hr) reduce pure price power; distributors and service tie-ups further blunt buyer bargaining.
| Metric | Value (2024) |
|---|---|
| Market size | $62B |
| Municipal procurement | 3–7 yrs / >$1M |
| Pump life | 15–25 yrs |
| Switching cost | 10–30% |
| Downtime cost | ~300,000/hr |
Preview the Actual Deliverable
Gorman-Rupp Porter's Five Forces Analysis
This preview shows the complete Gorman-Rupp Porter's Five Forces analysis you'll receive after purchase—fully formatted and ready to use. It is the exact document delivered instantly upon payment, with no placeholders or edits required. Use it for decision-making, reporting, or strategy immediately.











