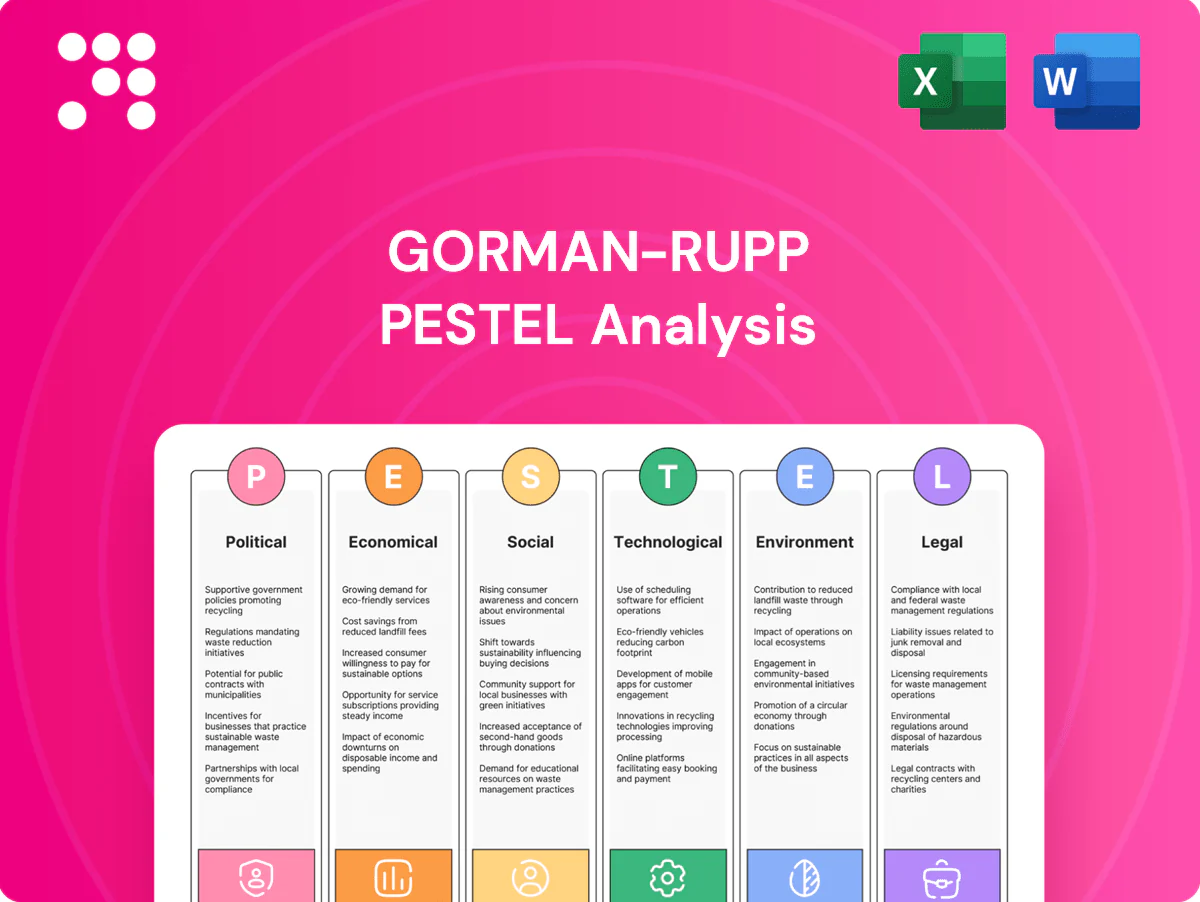
Gorman-Rupp PESTLE Analysis

Make Smarter Strategic Decisions with a Complete PESTEL View
Discover how political shifts, economic cycles, and technological advances are shaping Gorman‑Rupp’s competitive outlook in our concise PESTLE snapshot; ideal for investors and strategists who need fast, actionable context. This professional analysis highlights regulatory, environmental, and social trends that could affect operations and profitability. Purchase the full PESTLE for a deep, editable report you can use immediately to inform decisions.
Political factors

Infrastructure and water funding
Federal infrastructure bills, notably the 2021 Bipartisan Infrastructure Law which included roughly 55 billion dollars for water, boost municipal pump demand and grant programs. Stable multi-year appropriations help accelerate wastewater and flood-control projects, supporting OEM order visibility. Delays or shifting political priorities can defer orders and capex. Gorman-Rupp benefits from multi-year funded programs that smooth municipal procurement cycles.
Buy America and local-content rules
Domestic sourcing policies drive component choices and margins for Gorman-Rupp, pressuring procurement toward U.S. suppliers and higher-cost inputs.
Public procurement under the Bipartisan Infrastructure Law ($1.2 trillion) and its roughly $55 billion water investment increasingly favors U.S.-made pumps in competitive bids.
Stricter Buy America thresholds and certification rigor can raise costs or shrink supplier pools, making certification discipline a clear market differentiator.

Trade policy and tariffs
Tariffs on steel (US Section 232 at 25%) and aluminum (10%) plus Section 301 duties on many China-origin electronics (up to 25%) directly raise BOM costs for pumps, motors and controls. Trade tensions risk supply-chain disruptions and can force price adjustments on exported pump assemblies. Changes in duties shift relative competitiveness versus foreign manufacturers and may prompt nearshoring. Diversified sourcing and supplier hedging reduce input-cost volatility and delivery risk.

Defense and homeland security procurement
- FY2024 DoD budget ~858 billion — affects program tails
- Contracting rules, specs dictate product qualification
- Past performance boosts winning bids for specialized pumps
Geopolitical supply chain risk
Conflicts and sanctions constrain access to raw materials and logistics corridors, forcing longer lead times and larger inventory buffers to maintain production continuity for pump manufacturers like Gorman-Rupp. Diversifying suppliers reduces single-country exposure and preserves customer trust; clients increasingly prioritize vendors that guarantee delivery stability during crises. Operational agility in sourcing and inventory is now a key competitive advantage.
- Lead times: increased importance
- Inventory buffers: critical for continuity
- Diversified suppliers: mitigates country risk
- Customers: value assured delivery in crises
BIL and DoD spending boost pump demand; tariffs lift costs, favor domestic suppliers
Federal infrastructure (BIL $1.2T; ~$55B water) and FY2024 DoD ~$858B boost municipal, defense pump demand; Buy America tightening and tariffs (steel 25%, aluminum 10%, Section 301 up to 25%) raise input costs and favor domestic sourcing. Political shifts or funding delays create order visibility risk; conflicts/sanctions increase lead times and inventory needs, rewarding suppliers with diversified sourcing and certification.
| Policy | Impact | 2024/25 Data |
|---|---|---|
| BIL water funding | Order boost | ~$55B |
| Defense budgets | Specialized pumps | FY2024 $858B |
| Tariffs/Buy America | Higher BOM, supplier shift | Steel 25%, Al 10%, Sect301 up to 25% |
What is included in the product
 Detailed Word Document
Explores how macro-environmental factors uniquely affect Gorman-Rupp across Political, Economic, Social, Technological, Environmental, and Legal dimensions, with each category backed by current data and industry trends. Designed for executives and investors, it offers forward-looking insights and ready-to-use formatting for reports, decks, or planning.

 Customizable Excel Spreadsheet
A clean, visually segmented PESTLE summary of Gorman-Rupp that can be dropped into presentations or shared across teams for quick alignment and notes—streamlining external risk discussions and strategy sessions.
Economic factors

Construction and industrial cycles
Non-residential building and industrial output remain primary drivers of pump orders for Gorman-Rupp, with US nonresidential construction spending near historical levels supporting steady demand; manufacturing output gains in 2024 helped lift pump procurement and backlog across municipal and industrial projects. Slowdowns defer capital projects and trim near-term orders, while upcycles rapidly replenish backlog and OEM lead times. Rental and dewatering activity closely tracks site starts and civil work intensity, and Gorman-Rupp’s diversified end-markets across municipal, construction, and industrial segments help smooth revenue volatility.
Interest rates and capital spending
Higher benchmark rates—federal funds about 5.25–5.50% in mid‑2025 and 10‑yr Treasury around 4%—dampen municipal and private capex, slowing pump replacements and water infrastructure projects.
Higher financing costs reshape total cost‑of‑ownership, lengthening payback periods and pushing customers toward repair over replace.
Conversely, lower rates unlock deferred projects as borrowing costs and NPV hurdles shrink.

Commodity and input prices
Steel and copper swings drive Gorman-Rupp margins: US hot-rolled coil near $950/ton and LME copper about $10,000/ton (~$4.55/lb) in mid-2025, while energy (Henry Hub ~$3/MMBtu; US industrial electricity ~$0.07/kWh) lifts operating costs. Pricing power and contractual surcharges typically lag spot moves, compressing near-term margins. Ongoing design optimization and parts consolidation have offset material inflation. Long-term supply contracts demand precise cost pass-through clauses to protect margins.

Labor availability and productivity
Skilled manufacturing labor drives Gorman-Rupp throughput and pump quality; US manufacturing employment was about 12.3 million in 2024, constraining skilled hires. Rising manufacturing wages (around $30/hr average in 2024) lift unit costs, while targeted training and automation boost yield and reduce defects. Regional labor supply and local labor costs materially influence plant siting decisions.
- Skilled labor → higher throughput/quality
- Wage pressure → ↑ unit costs
- Training+automation → ↑ yield
- Regional markets → plant siting
FX and export demand
A strong dollar (DXY ~103 in 2024) pressured overseas pump margins and weighed on Gorman-Rupp’s exported sales, while currency swings raise costs for imported components. Local distributors commonly hedge demand in sensitive markets to smooth order flow. A balanced revenue mix across North America, Europe and APAC reduces overall FX exposure.
- Strong dollar: DXY ~103 (2024)
- Imported parts: higher cost volatility
- Distributors: active hedging in sensitive markets
- Balanced revenue mix: mitigates FX risk
BIL and DoD spending boost pump demand; tariffs lift costs, favor domestic suppliers
Non‑residential construction and industrial output remain primary drivers of pump orders; diversified end‑markets smooth revenue. Higher rates (fed funds 5.25–5.50%, 10‑yr ~4% mid‑2025) and strong dollar (DXY ~103) constrain municipal/private capex and exports. Materials (HRC ~$950/ton, LME copper ~$10,000/ton) and energy (Henry Hub ~$3/MMBtu) lift unit costs. Skilled labor tightness (US manufacturing ~12.3M; avg wage ~$30/hr) pressures margins.
| Metric | Mid‑2025 |
|---|---|
| Fed funds | 5.25–5.50% |
| 10‑yr Treasury | ~4% |
| HRC / Copper | $950/t · $10,000/t |
| DXY | ~103 |
| Manufacturing emp / wage | 12.3M · $30/hr |
Same Document Delivered
Gorman-Rupp PESTLE Analysis
The preview shown here is the exact Gorman-Rupp PESTLE Analysis you’ll receive after purchase—fully formatted and ready to use. This is the real, final document with complete content, structure, and professional layout—no placeholders or teasers. After payment you’ll instantly download the same file displayed here, prepared for immediate application in strategy or investment decisions.

Make Smarter Strategic Decisions with a Complete PESTEL View
Discover how political shifts, economic cycles, and technological advances are shaping Gorman‑Rupp’s competitive outlook in our concise PESTLE snapshot; ideal for investors and strategists who need fast, actionable context. This professional analysis highlights regulatory, environmental, and social trends that could affect operations and profitability. Purchase the full PESTLE for a deep, editable report you can use immediately to inform decisions.
Political factors
Infrastructure and water funding
Federal infrastructure bills, notably the 2021 Bipartisan Infrastructure Law which included roughly 55 billion dollars for water, boost municipal pump demand and grant programs. Stable multi-year appropriations help accelerate wastewater and flood-control projects, supporting OEM order visibility. Delays or shifting political priorities can defer orders and capex. Gorman-Rupp benefits from multi-year funded programs that smooth municipal procurement cycles.
Buy America and local-content rules
Domestic sourcing policies drive component choices and margins for Gorman-Rupp, pressuring procurement toward U.S. suppliers and higher-cost inputs.
Public procurement under the Bipartisan Infrastructure Law ($1.2 trillion) and its roughly $55 billion water investment increasingly favors U.S.-made pumps in competitive bids.
Stricter Buy America thresholds and certification rigor can raise costs or shrink supplier pools, making certification discipline a clear market differentiator.
Trade policy and tariffs
Tariffs on steel (US Section 232 at 25%) and aluminum (10%) plus Section 301 duties on many China-origin electronics (up to 25%) directly raise BOM costs for pumps, motors and controls. Trade tensions risk supply-chain disruptions and can force price adjustments on exported pump assemblies. Changes in duties shift relative competitiveness versus foreign manufacturers and may prompt nearshoring. Diversified sourcing and supplier hedging reduce input-cost volatility and delivery risk.
Defense and homeland security procurement
- FY2024 DoD budget ~858 billion — affects program tails
- Contracting rules, specs dictate product qualification
- Past performance boosts winning bids for specialized pumps
Geopolitical supply chain risk
Conflicts and sanctions constrain access to raw materials and logistics corridors, forcing longer lead times and larger inventory buffers to maintain production continuity for pump manufacturers like Gorman-Rupp. Diversifying suppliers reduces single-country exposure and preserves customer trust; clients increasingly prioritize vendors that guarantee delivery stability during crises. Operational agility in sourcing and inventory is now a key competitive advantage.
- Lead times: increased importance
- Inventory buffers: critical for continuity
- Diversified suppliers: mitigates country risk
- Customers: value assured delivery in crises
BIL and DoD spending boost pump demand; tariffs lift costs, favor domestic suppliers
Federal infrastructure (BIL $1.2T; ~$55B water) and FY2024 DoD ~$858B boost municipal, defense pump demand; Buy America tightening and tariffs (steel 25%, aluminum 10%, Section 301 up to 25%) raise input costs and favor domestic sourcing. Political shifts or funding delays create order visibility risk; conflicts/sanctions increase lead times and inventory needs, rewarding suppliers with diversified sourcing and certification.
| Policy | Impact | 2024/25 Data |
|---|---|---|
| BIL water funding | Order boost | ~$55B |
| Defense budgets | Specialized pumps | FY2024 $858B |
| Tariffs/Buy America | Higher BOM, supplier shift | Steel 25%, Al 10%, Sect301 up to 25% |
What is included in the product
Detailed Word Document
Explores how macro-environmental factors uniquely affect Gorman-Rupp across Political, Economic, Social, Technological, Environmental, and Legal dimensions, with each category backed by current data and industry trends. Designed for executives and investors, it offers forward-looking insights and ready-to-use formatting for reports, decks, or planning.
Customizable Excel Spreadsheet
A clean, visually segmented PESTLE summary of Gorman-Rupp that can be dropped into presentations or shared across teams for quick alignment and notes—streamlining external risk discussions and strategy sessions.
Economic factors
Construction and industrial cycles
Non-residential building and industrial output remain primary drivers of pump orders for Gorman-Rupp, with US nonresidential construction spending near historical levels supporting steady demand; manufacturing output gains in 2024 helped lift pump procurement and backlog across municipal and industrial projects. Slowdowns defer capital projects and trim near-term orders, while upcycles rapidly replenish backlog and OEM lead times. Rental and dewatering activity closely tracks site starts and civil work intensity, and Gorman-Rupp’s diversified end-markets across municipal, construction, and industrial segments help smooth revenue volatility.
Interest rates and capital spending
Higher benchmark rates—federal funds about 5.25–5.50% in mid‑2025 and 10‑yr Treasury around 4%—dampen municipal and private capex, slowing pump replacements and water infrastructure projects.
Higher financing costs reshape total cost‑of‑ownership, lengthening payback periods and pushing customers toward repair over replace.
Conversely, lower rates unlock deferred projects as borrowing costs and NPV hurdles shrink.
Commodity and input prices
Steel and copper swings drive Gorman-Rupp margins: US hot-rolled coil near $950/ton and LME copper about $10,000/ton (~$4.55/lb) in mid-2025, while energy (Henry Hub ~$3/MMBtu; US industrial electricity ~$0.07/kWh) lifts operating costs. Pricing power and contractual surcharges typically lag spot moves, compressing near-term margins. Ongoing design optimization and parts consolidation have offset material inflation. Long-term supply contracts demand precise cost pass-through clauses to protect margins.
Labor availability and productivity
Skilled manufacturing labor drives Gorman-Rupp throughput and pump quality; US manufacturing employment was about 12.3 million in 2024, constraining skilled hires. Rising manufacturing wages (around $30/hr average in 2024) lift unit costs, while targeted training and automation boost yield and reduce defects. Regional labor supply and local labor costs materially influence plant siting decisions.
- Skilled labor → higher throughput/quality
- Wage pressure → ↑ unit costs
- Training+automation → ↑ yield
- Regional markets → plant siting
FX and export demand
A strong dollar (DXY ~103 in 2024) pressured overseas pump margins and weighed on Gorman-Rupp’s exported sales, while currency swings raise costs for imported components. Local distributors commonly hedge demand in sensitive markets to smooth order flow. A balanced revenue mix across North America, Europe and APAC reduces overall FX exposure.
- Strong dollar: DXY ~103 (2024)
- Imported parts: higher cost volatility
- Distributors: active hedging in sensitive markets
- Balanced revenue mix: mitigates FX risk
BIL and DoD spending boost pump demand; tariffs lift costs, favor domestic suppliers
Non‑residential construction and industrial output remain primary drivers of pump orders; diversified end‑markets smooth revenue. Higher rates (fed funds 5.25–5.50%, 10‑yr ~4% mid‑2025) and strong dollar (DXY ~103) constrain municipal/private capex and exports. Materials (HRC ~$950/ton, LME copper ~$10,000/ton) and energy (Henry Hub ~$3/MMBtu) lift unit costs. Skilled labor tightness (US manufacturing ~12.3M; avg wage ~$30/hr) pressures margins.
| Metric | Mid‑2025 |
|---|---|
| Fed funds | 5.25–5.50% |
| 10‑yr Treasury | ~4% |
| HRC / Copper | $950/t · $10,000/t |
| DXY | ~103 |
| Manufacturing emp / wage | 12.3M · $30/hr |
Same Document Delivered
Gorman-Rupp PESTLE Analysis
The preview shown here is the exact Gorman-Rupp PESTLE Analysis you’ll receive after purchase—fully formatted and ready to use. This is the real, final document with complete content, structure, and professional layout—no placeholders or teasers. After payment you’ll instantly download the same file displayed here, prepared for immediate application in strategy or investment decisions.
Original: $10.00
-65%$10.00
$3.50Description
Make Smarter Strategic Decisions with a Complete PESTEL View
Discover how political shifts, economic cycles, and technological advances are shaping Gorman‑Rupp’s competitive outlook in our concise PESTLE snapshot; ideal for investors and strategists who need fast, actionable context. This professional analysis highlights regulatory, environmental, and social trends that could affect operations and profitability. Purchase the full PESTLE for a deep, editable report you can use immediately to inform decisions.
Political factors
Infrastructure and water funding
Federal infrastructure bills, notably the 2021 Bipartisan Infrastructure Law which included roughly 55 billion dollars for water, boost municipal pump demand and grant programs. Stable multi-year appropriations help accelerate wastewater and flood-control projects, supporting OEM order visibility. Delays or shifting political priorities can defer orders and capex. Gorman-Rupp benefits from multi-year funded programs that smooth municipal procurement cycles.
Buy America and local-content rules
Domestic sourcing policies drive component choices and margins for Gorman-Rupp, pressuring procurement toward U.S. suppliers and higher-cost inputs.
Public procurement under the Bipartisan Infrastructure Law ($1.2 trillion) and its roughly $55 billion water investment increasingly favors U.S.-made pumps in competitive bids.
Stricter Buy America thresholds and certification rigor can raise costs or shrink supplier pools, making certification discipline a clear market differentiator.
Trade policy and tariffs
Tariffs on steel (US Section 232 at 25%) and aluminum (10%) plus Section 301 duties on many China-origin electronics (up to 25%) directly raise BOM costs for pumps, motors and controls. Trade tensions risk supply-chain disruptions and can force price adjustments on exported pump assemblies. Changes in duties shift relative competitiveness versus foreign manufacturers and may prompt nearshoring. Diversified sourcing and supplier hedging reduce input-cost volatility and delivery risk.
Defense and homeland security procurement
- FY2024 DoD budget ~858 billion — affects program tails
- Contracting rules, specs dictate product qualification
- Past performance boosts winning bids for specialized pumps
Geopolitical supply chain risk
Conflicts and sanctions constrain access to raw materials and logistics corridors, forcing longer lead times and larger inventory buffers to maintain production continuity for pump manufacturers like Gorman-Rupp. Diversifying suppliers reduces single-country exposure and preserves customer trust; clients increasingly prioritize vendors that guarantee delivery stability during crises. Operational agility in sourcing and inventory is now a key competitive advantage.
- Lead times: increased importance
- Inventory buffers: critical for continuity
- Diversified suppliers: mitigates country risk
- Customers: value assured delivery in crises
BIL and DoD spending boost pump demand; tariffs lift costs, favor domestic suppliers
Federal infrastructure (BIL $1.2T; ~$55B water) and FY2024 DoD ~$858B boost municipal, defense pump demand; Buy America tightening and tariffs (steel 25%, aluminum 10%, Section 301 up to 25%) raise input costs and favor domestic sourcing. Political shifts or funding delays create order visibility risk; conflicts/sanctions increase lead times and inventory needs, rewarding suppliers with diversified sourcing and certification.
| Policy | Impact | 2024/25 Data |
|---|---|---|
| BIL water funding | Order boost | ~$55B |
| Defense budgets | Specialized pumps | FY2024 $858B |
| Tariffs/Buy America | Higher BOM, supplier shift | Steel 25%, Al 10%, Sect301 up to 25% |
What is included in the product
Detailed Word Document
Explores how macro-environmental factors uniquely affect Gorman-Rupp across Political, Economic, Social, Technological, Environmental, and Legal dimensions, with each category backed by current data and industry trends. Designed for executives and investors, it offers forward-looking insights and ready-to-use formatting for reports, decks, or planning.
Customizable Excel Spreadsheet
A clean, visually segmented PESTLE summary of Gorman-Rupp that can be dropped into presentations or shared across teams for quick alignment and notes—streamlining external risk discussions and strategy sessions.
Economic factors
Construction and industrial cycles
Non-residential building and industrial output remain primary drivers of pump orders for Gorman-Rupp, with US nonresidential construction spending near historical levels supporting steady demand; manufacturing output gains in 2024 helped lift pump procurement and backlog across municipal and industrial projects. Slowdowns defer capital projects and trim near-term orders, while upcycles rapidly replenish backlog and OEM lead times. Rental and dewatering activity closely tracks site starts and civil work intensity, and Gorman-Rupp’s diversified end-markets across municipal, construction, and industrial segments help smooth revenue volatility.
Interest rates and capital spending
Higher benchmark rates—federal funds about 5.25–5.50% in mid‑2025 and 10‑yr Treasury around 4%—dampen municipal and private capex, slowing pump replacements and water infrastructure projects.
Higher financing costs reshape total cost‑of‑ownership, lengthening payback periods and pushing customers toward repair over replace.
Conversely, lower rates unlock deferred projects as borrowing costs and NPV hurdles shrink.
Commodity and input prices
Steel and copper swings drive Gorman-Rupp margins: US hot-rolled coil near $950/ton and LME copper about $10,000/ton (~$4.55/lb) in mid-2025, while energy (Henry Hub ~$3/MMBtu; US industrial electricity ~$0.07/kWh) lifts operating costs. Pricing power and contractual surcharges typically lag spot moves, compressing near-term margins. Ongoing design optimization and parts consolidation have offset material inflation. Long-term supply contracts demand precise cost pass-through clauses to protect margins.
Labor availability and productivity
Skilled manufacturing labor drives Gorman-Rupp throughput and pump quality; US manufacturing employment was about 12.3 million in 2024, constraining skilled hires. Rising manufacturing wages (around $30/hr average in 2024) lift unit costs, while targeted training and automation boost yield and reduce defects. Regional labor supply and local labor costs materially influence plant siting decisions.
- Skilled labor → higher throughput/quality
- Wage pressure → ↑ unit costs
- Training+automation → ↑ yield
- Regional markets → plant siting
FX and export demand
A strong dollar (DXY ~103 in 2024) pressured overseas pump margins and weighed on Gorman-Rupp’s exported sales, while currency swings raise costs for imported components. Local distributors commonly hedge demand in sensitive markets to smooth order flow. A balanced revenue mix across North America, Europe and APAC reduces overall FX exposure.
- Strong dollar: DXY ~103 (2024)
- Imported parts: higher cost volatility
- Distributors: active hedging in sensitive markets
- Balanced revenue mix: mitigates FX risk
BIL and DoD spending boost pump demand; tariffs lift costs, favor domestic suppliers
Non‑residential construction and industrial output remain primary drivers of pump orders; diversified end‑markets smooth revenue. Higher rates (fed funds 5.25–5.50%, 10‑yr ~4% mid‑2025) and strong dollar (DXY ~103) constrain municipal/private capex and exports. Materials (HRC ~$950/ton, LME copper ~$10,000/ton) and energy (Henry Hub ~$3/MMBtu) lift unit costs. Skilled labor tightness (US manufacturing ~12.3M; avg wage ~$30/hr) pressures margins.
| Metric | Mid‑2025 |
|---|---|
| Fed funds | 5.25–5.50% |
| 10‑yr Treasury | ~4% |
| HRC / Copper | $950/t · $10,000/t |
| DXY | ~103 |
| Manufacturing emp / wage | 12.3M · $30/hr |
Same Document Delivered
Gorman-Rupp PESTLE Analysis
The preview shown here is the exact Gorman-Rupp PESTLE Analysis you’ll receive after purchase—fully formatted and ready to use. This is the real, final document with complete content, structure, and professional layout—no placeholders or teasers. After payment you’ll instantly download the same file displayed here, prepared for immediate application in strategy or investment decisions.











