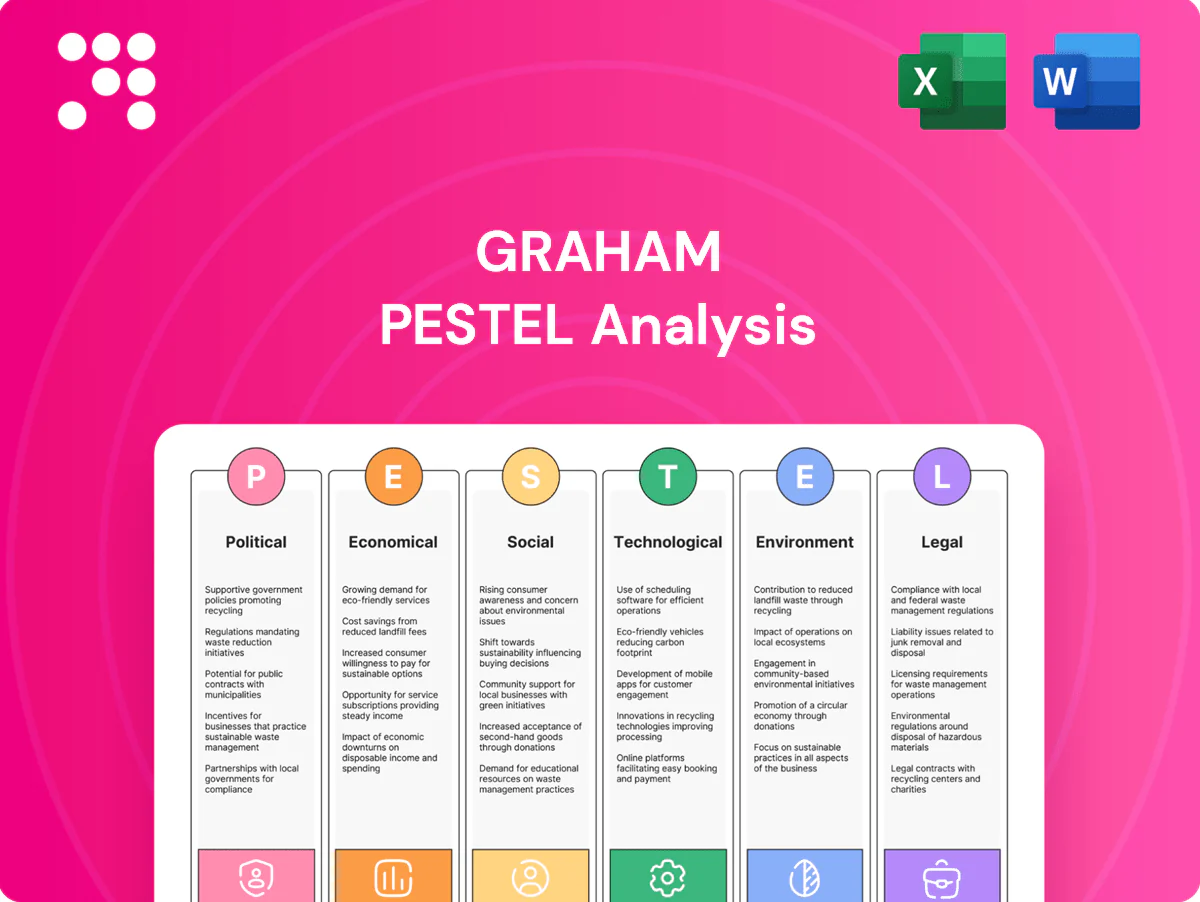
Graham PESTLE Analysis

Your Shortcut to Market Insight Starts Here
Unlock strategic advantage with our Graham PESTLE Analysis—concise, evidence-based insight into political, economic, social, technological, legal and environmental forces shaping the company. Ideal for investors, consultants and planners, it highlights risks and growth levers you can act on. Purchase the full, editable report for immediate, board-ready intelligence.
Political factors

Defense procurement and budget cycles
Defense spending levels, with the US budget exceeding $800 billion annually and global military expenditure topping $2.2 trillion in 2023 (SIPRI), directly drive orders for vacuum and heat-transfer systems on naval and defense platforms. Multi-year appropriations and shifts between shipbuilding and modernization affect timing and mix, while continuing resolutions can delay awards and cash conversion; stable policy supports capacity planning and long-lead materials.
Export controls and geopolitical risk
ITAR and EAR govern design data and shipments for defense and dual-use kit, with DDTC ITAR reviews commonly taking 90–120 days and BIS EAR reviews often 30–60 days, raising program timelines. Licensing timelines and denied‑party screening add compliance costs of several percentage points and operational complexity to international deals. Geopolitical tensions have lifted global military spending to about $2.4 trillion in 2023 (SIPRI) while sanctions and export controls have rerouted supply chains and closed markets to sanctioned regimes.

Energy policy and industrial incentives
National energy policies redirect capex between oil, gas, nuclear and renewables, with the US Inflation Reduction Act mobilizing roughly 369 billion USD in clean energy incentives that tilt investment toward low‑temperature and high‑temperature heat technologies. Tax credits such as ITC up to 30% and a domestic‑content bonus up to 10% plus EU Innovation Fund ~25 billion EUR through 2030 catalyze advanced heat‑transfer upgrades, while subsidy withdrawal can pause projects and local‑content rules reshape site selection and partner structures.

Trade policy, tariffs, and localization
Tariffs on metals and fabricated components—notably US Section 232 levies of 25% on steel and 10% on aluminum—raise input costs and squeeze bid competitiveness for Graham projects. Cross-border procurement increasingly triggers offset/local-fabrication requirements under many contracts, raising capex and lead times. Growing reshoring/nearshoring trends favor domestic manufacturing footprints and reduce exposure to customs delays, which can cause schedule slippage and penalty risk.
- Tariffs: 25% steel, 10% aluminum
- Higher bid costs and margin compression
- Offsets/local fabrication increase CAPEX
- Reshoring reduces customs exposure
Infrastructure and public-sector programs
Government-backed chemical, water, and hydrogen initiatives—driven by programs such as the US Bipartisan Infrastructure Law ($1.2 trillion) and EU NextGenerationEU (€750 billion)—boost demand for thermal systems, aligning with the EU target of 10 Mt renewable hydrogen by 2030. Public infrastructure upgrades increasingly specify higher efficiency, lowering lifecycle costs and favoring modern thermal technologies. Procurement rules now mandate transparency, cybersecurity, and supplier diversity, and compliance unlocks multi-year frameworks often exceeding $100m.
- Policy drivers: US $1.2T BIL; EU €750B
- Hydrogen target: EU 10 Mt by 2030
- Frameworks: >$100m multi-year contracts
- Procurement focus: transparency, cybersecurity, supplier diversity
US > $800B, global ~$2.4T; tariffs ITAR shift naval capex
US defense budgets >800B/yr and global military spend ~2.4T (2024 SIPRI) sustain naval/defense orders; multi‑year appropriations aid planning but CRs delay awards. ITAR/EAR reviews (30–120 days) and sanctions raise compliance costs; tariffs (25% steel, 10% Al) squeeze bids. Clean‑energy laws (IRA ~$369B, BIL $1.2T, NextGenerationEU €750B) shift capex to thermal upgrades.
| Factor | 2024/25 Data |
|---|---|
| Global military spend | ~$2.4T |
| US defense | >$800B/yr |
| IRA clean energy | $369B |
| Tariffs | Steel 25% / Al 10% |
What is included in the product
 Detailed Word Document
Explores how external macro-environmental factors uniquely affect the Graham across six dimensions—Political, Economic, Social, Technological, Environmental, and Legal—each backed by relevant data and current trends to provide a reliable evaluation. Designed for executives, consultants, and entrepreneurs, it highlights threats and opportunities with forward-looking insights ready for strategic planning and investor communications.

 Customizable Excel Spreadsheet
Graham PESTLE Analysis condenses complex external factors into a clear, visually segmented summary for quick reference in meetings or presentations, easily annotated for region- or business-specific context and shareable across teams.
Economic factors

Capex cycles in energy and chemicals
Oil and gas, petrochemical and specialty chemical capex cycles govern large-project awards: Brent averaged about $86/bbl in 2024 and upstream capex recovered to roughly $350bn, prompting expansions and debottlenecking, while commodity dips shift spending to maintenance and brownfield work; backlog mix and margins for EPC players have swung materially, with project awards and margin profiles varying by ±20–30% across cycles.
Interest rates and financing conditions
Higher interest rates (US federal funds 5.25–5.50% and 10-year Treasury ≈4.2% in mid‑2025) raise hurdle rates for industrial projects, slowing approvals and extending internal valuation timelines. Customers often delay FIDs, elongating sales cycles and pushing milestone billing further out. Longer projects increase working capital needs and financing costs; conversely, future rate cuts can release pent‑up orders.

Input costs and supply chain volatility
Steel, alloys, forgings and specialty components remain exposed to sharp price swings, with China producing about 1,026 Mt of crude steel in 2023 (World Steel Association), amplifying global volatility. Long-lead procurement and hedging are critical to protect margins, while logistics bottlenecks can trigger liquidated damages if schedules slip. Supplier consolidation tightens availability and supplier bargaining power.

Labor availability and productivity
Skilled welders, machinists and engineers drive throughput and quality; BLS shows median welder wage ~$47,000 (2023) and engineers ~$100,000, while US unemployment ran ~3.9% in 2024, tightening labor supply and lifting labor costs and overtime exposure.
- Skilled labor = higher yield / lower rework
- Tight market → wage pressure
- Training boosts productivity
- Regional supply shapes site capacity
FX and export demand
Currency moves directly alter export competitiveness and project pricing; a stronger home currency (US dollar trade-weighted index ~104 in mid-2025) narrows margins on international contracts. Hedging (typical forward premia ~0.5–1.5% p.a.) reduces volatility but raises costs. Broad global diversification evens out regional demand swings and stabilizes revenue streams.
- FX shifts affect bid pricing and contract margins
- Strong home currency compresses international margins
- Hedging mitigates risk at ~0.5–1.5% p.a. cost
- Geographic diversification smooths regional downturns
US > $800B, global ~$2.4T; tariffs ITAR shift naval capex
Capital cycles in oil, gas and petrochemicals drive large-project awards: Brent ≈$86/bbl (2024) and upstream capex ≈$350bn (2024) cause ±20–30% swings in EPC backlog and margins. Higher rates (Fed funds 5.25–5.50%, 10‑yr ≈4.2% mid‑2025) raise hurdle rates, delay FIDs and increase financing/working capital needs. Input volatility (crude steel 1,026 Mt in 2023), tight labor (unemployment ~3.9% in 2024; welders ~$47k, engineers ~$100k) and USD TWI ≈104 compress international margins.
Preview the Actual Deliverable
Graham PESTLE Analysis
The Graham PESTLE Analysis preview shown here is the exact document you’ll receive after purchase—fully formatted and ready to use. It contains a comprehensive PESTLE review tailored to Graham-style investing with clear strategic insights and action points. No placeholders, no surprises.

Your Shortcut to Market Insight Starts Here
Unlock strategic advantage with our Graham PESTLE Analysis—concise, evidence-based insight into political, economic, social, technological, legal and environmental forces shaping the company. Ideal for investors, consultants and planners, it highlights risks and growth levers you can act on. Purchase the full, editable report for immediate, board-ready intelligence.
Political factors
Defense procurement and budget cycles
Defense spending levels, with the US budget exceeding $800 billion annually and global military expenditure topping $2.2 trillion in 2023 (SIPRI), directly drive orders for vacuum and heat-transfer systems on naval and defense platforms. Multi-year appropriations and shifts between shipbuilding and modernization affect timing and mix, while continuing resolutions can delay awards and cash conversion; stable policy supports capacity planning and long-lead materials.
Export controls and geopolitical risk
ITAR and EAR govern design data and shipments for defense and dual-use kit, with DDTC ITAR reviews commonly taking 90–120 days and BIS EAR reviews often 30–60 days, raising program timelines. Licensing timelines and denied‑party screening add compliance costs of several percentage points and operational complexity to international deals. Geopolitical tensions have lifted global military spending to about $2.4 trillion in 2023 (SIPRI) while sanctions and export controls have rerouted supply chains and closed markets to sanctioned regimes.
Energy policy and industrial incentives
National energy policies redirect capex between oil, gas, nuclear and renewables, with the US Inflation Reduction Act mobilizing roughly 369 billion USD in clean energy incentives that tilt investment toward low‑temperature and high‑temperature heat technologies. Tax credits such as ITC up to 30% and a domestic‑content bonus up to 10% plus EU Innovation Fund ~25 billion EUR through 2030 catalyze advanced heat‑transfer upgrades, while subsidy withdrawal can pause projects and local‑content rules reshape site selection and partner structures.
Trade policy, tariffs, and localization
Tariffs on metals and fabricated components—notably US Section 232 levies of 25% on steel and 10% on aluminum—raise input costs and squeeze bid competitiveness for Graham projects. Cross-border procurement increasingly triggers offset/local-fabrication requirements under many contracts, raising capex and lead times. Growing reshoring/nearshoring trends favor domestic manufacturing footprints and reduce exposure to customs delays, which can cause schedule slippage and penalty risk.
- Tariffs: 25% steel, 10% aluminum
- Higher bid costs and margin compression
- Offsets/local fabrication increase CAPEX
- Reshoring reduces customs exposure
Infrastructure and public-sector programs
Government-backed chemical, water, and hydrogen initiatives—driven by programs such as the US Bipartisan Infrastructure Law ($1.2 trillion) and EU NextGenerationEU (€750 billion)—boost demand for thermal systems, aligning with the EU target of 10 Mt renewable hydrogen by 2030. Public infrastructure upgrades increasingly specify higher efficiency, lowering lifecycle costs and favoring modern thermal technologies. Procurement rules now mandate transparency, cybersecurity, and supplier diversity, and compliance unlocks multi-year frameworks often exceeding $100m.
- Policy drivers: US $1.2T BIL; EU €750B
- Hydrogen target: EU 10 Mt by 2030
- Frameworks: >$100m multi-year contracts
- Procurement focus: transparency, cybersecurity, supplier diversity
US > $800B, global ~$2.4T; tariffs ITAR shift naval capex
US defense budgets >800B/yr and global military spend ~2.4T (2024 SIPRI) sustain naval/defense orders; multi‑year appropriations aid planning but CRs delay awards. ITAR/EAR reviews (30–120 days) and sanctions raise compliance costs; tariffs (25% steel, 10% Al) squeeze bids. Clean‑energy laws (IRA ~$369B, BIL $1.2T, NextGenerationEU €750B) shift capex to thermal upgrades.
| Factor | 2024/25 Data |
|---|---|
| Global military spend | ~$2.4T |
| US defense | >$800B/yr |
| IRA clean energy | $369B |
| Tariffs | Steel 25% / Al 10% |
What is included in the product
Detailed Word Document
Explores how external macro-environmental factors uniquely affect the Graham across six dimensions—Political, Economic, Social, Technological, Environmental, and Legal—each backed by relevant data and current trends to provide a reliable evaluation. Designed for executives, consultants, and entrepreneurs, it highlights threats and opportunities with forward-looking insights ready for strategic planning and investor communications.
Customizable Excel Spreadsheet
Graham PESTLE Analysis condenses complex external factors into a clear, visually segmented summary for quick reference in meetings or presentations, easily annotated for region- or business-specific context and shareable across teams.
Economic factors
Capex cycles in energy and chemicals
Oil and gas, petrochemical and specialty chemical capex cycles govern large-project awards: Brent averaged about $86/bbl in 2024 and upstream capex recovered to roughly $350bn, prompting expansions and debottlenecking, while commodity dips shift spending to maintenance and brownfield work; backlog mix and margins for EPC players have swung materially, with project awards and margin profiles varying by ±20–30% across cycles.
Interest rates and financing conditions
Higher interest rates (US federal funds 5.25–5.50% and 10-year Treasury ≈4.2% in mid‑2025) raise hurdle rates for industrial projects, slowing approvals and extending internal valuation timelines. Customers often delay FIDs, elongating sales cycles and pushing milestone billing further out. Longer projects increase working capital needs and financing costs; conversely, future rate cuts can release pent‑up orders.
Input costs and supply chain volatility
Steel, alloys, forgings and specialty components remain exposed to sharp price swings, with China producing about 1,026 Mt of crude steel in 2023 (World Steel Association), amplifying global volatility. Long-lead procurement and hedging are critical to protect margins, while logistics bottlenecks can trigger liquidated damages if schedules slip. Supplier consolidation tightens availability and supplier bargaining power.
Labor availability and productivity
Skilled welders, machinists and engineers drive throughput and quality; BLS shows median welder wage ~$47,000 (2023) and engineers ~$100,000, while US unemployment ran ~3.9% in 2024, tightening labor supply and lifting labor costs and overtime exposure.
- Skilled labor = higher yield / lower rework
- Tight market → wage pressure
- Training boosts productivity
- Regional supply shapes site capacity
FX and export demand
Currency moves directly alter export competitiveness and project pricing; a stronger home currency (US dollar trade-weighted index ~104 in mid-2025) narrows margins on international contracts. Hedging (typical forward premia ~0.5–1.5% p.a.) reduces volatility but raises costs. Broad global diversification evens out regional demand swings and stabilizes revenue streams.
- FX shifts affect bid pricing and contract margins
- Strong home currency compresses international margins
- Hedging mitigates risk at ~0.5–1.5% p.a. cost
- Geographic diversification smooths regional downturns
US > $800B, global ~$2.4T; tariffs ITAR shift naval capex
Capital cycles in oil, gas and petrochemicals drive large-project awards: Brent ≈$86/bbl (2024) and upstream capex ≈$350bn (2024) cause ±20–30% swings in EPC backlog and margins. Higher rates (Fed funds 5.25–5.50%, 10‑yr ≈4.2% mid‑2025) raise hurdle rates, delay FIDs and increase financing/working capital needs. Input volatility (crude steel 1,026 Mt in 2023), tight labor (unemployment ~3.9% in 2024; welders ~$47k, engineers ~$100k) and USD TWI ≈104 compress international margins.
Preview the Actual Deliverable
Graham PESTLE Analysis
The Graham PESTLE Analysis preview shown here is the exact document you’ll receive after purchase—fully formatted and ready to use. It contains a comprehensive PESTLE review tailored to Graham-style investing with clear strategic insights and action points. No placeholders, no surprises.
Original: $10.00
-65%$10.00
$3.50Description
Your Shortcut to Market Insight Starts Here
Unlock strategic advantage with our Graham PESTLE Analysis—concise, evidence-based insight into political, economic, social, technological, legal and environmental forces shaping the company. Ideal for investors, consultants and planners, it highlights risks and growth levers you can act on. Purchase the full, editable report for immediate, board-ready intelligence.
Political factors
Defense procurement and budget cycles
Defense spending levels, with the US budget exceeding $800 billion annually and global military expenditure topping $2.2 trillion in 2023 (SIPRI), directly drive orders for vacuum and heat-transfer systems on naval and defense platforms. Multi-year appropriations and shifts between shipbuilding and modernization affect timing and mix, while continuing resolutions can delay awards and cash conversion; stable policy supports capacity planning and long-lead materials.
Export controls and geopolitical risk
ITAR and EAR govern design data and shipments for defense and dual-use kit, with DDTC ITAR reviews commonly taking 90–120 days and BIS EAR reviews often 30–60 days, raising program timelines. Licensing timelines and denied‑party screening add compliance costs of several percentage points and operational complexity to international deals. Geopolitical tensions have lifted global military spending to about $2.4 trillion in 2023 (SIPRI) while sanctions and export controls have rerouted supply chains and closed markets to sanctioned regimes.
Energy policy and industrial incentives
National energy policies redirect capex between oil, gas, nuclear and renewables, with the US Inflation Reduction Act mobilizing roughly 369 billion USD in clean energy incentives that tilt investment toward low‑temperature and high‑temperature heat technologies. Tax credits such as ITC up to 30% and a domestic‑content bonus up to 10% plus EU Innovation Fund ~25 billion EUR through 2030 catalyze advanced heat‑transfer upgrades, while subsidy withdrawal can pause projects and local‑content rules reshape site selection and partner structures.
Trade policy, tariffs, and localization
Tariffs on metals and fabricated components—notably US Section 232 levies of 25% on steel and 10% on aluminum—raise input costs and squeeze bid competitiveness for Graham projects. Cross-border procurement increasingly triggers offset/local-fabrication requirements under many contracts, raising capex and lead times. Growing reshoring/nearshoring trends favor domestic manufacturing footprints and reduce exposure to customs delays, which can cause schedule slippage and penalty risk.
- Tariffs: 25% steel, 10% aluminum
- Higher bid costs and margin compression
- Offsets/local fabrication increase CAPEX
- Reshoring reduces customs exposure
Infrastructure and public-sector programs
Government-backed chemical, water, and hydrogen initiatives—driven by programs such as the US Bipartisan Infrastructure Law ($1.2 trillion) and EU NextGenerationEU (€750 billion)—boost demand for thermal systems, aligning with the EU target of 10 Mt renewable hydrogen by 2030. Public infrastructure upgrades increasingly specify higher efficiency, lowering lifecycle costs and favoring modern thermal technologies. Procurement rules now mandate transparency, cybersecurity, and supplier diversity, and compliance unlocks multi-year frameworks often exceeding $100m.
- Policy drivers: US $1.2T BIL; EU €750B
- Hydrogen target: EU 10 Mt by 2030
- Frameworks: >$100m multi-year contracts
- Procurement focus: transparency, cybersecurity, supplier diversity
US > $800B, global ~$2.4T; tariffs ITAR shift naval capex
US defense budgets >800B/yr and global military spend ~2.4T (2024 SIPRI) sustain naval/defense orders; multi‑year appropriations aid planning but CRs delay awards. ITAR/EAR reviews (30–120 days) and sanctions raise compliance costs; tariffs (25% steel, 10% Al) squeeze bids. Clean‑energy laws (IRA ~$369B, BIL $1.2T, NextGenerationEU €750B) shift capex to thermal upgrades.
| Factor | 2024/25 Data |
|---|---|
| Global military spend | ~$2.4T |
| US defense | >$800B/yr |
| IRA clean energy | $369B |
| Tariffs | Steel 25% / Al 10% |
What is included in the product
Detailed Word Document
Explores how external macro-environmental factors uniquely affect the Graham across six dimensions—Political, Economic, Social, Technological, Environmental, and Legal—each backed by relevant data and current trends to provide a reliable evaluation. Designed for executives, consultants, and entrepreneurs, it highlights threats and opportunities with forward-looking insights ready for strategic planning and investor communications.
Customizable Excel Spreadsheet
Graham PESTLE Analysis condenses complex external factors into a clear, visually segmented summary for quick reference in meetings or presentations, easily annotated for region- or business-specific context and shareable across teams.
Economic factors
Capex cycles in energy and chemicals
Oil and gas, petrochemical and specialty chemical capex cycles govern large-project awards: Brent averaged about $86/bbl in 2024 and upstream capex recovered to roughly $350bn, prompting expansions and debottlenecking, while commodity dips shift spending to maintenance and brownfield work; backlog mix and margins for EPC players have swung materially, with project awards and margin profiles varying by ±20–30% across cycles.
Interest rates and financing conditions
Higher interest rates (US federal funds 5.25–5.50% and 10-year Treasury ≈4.2% in mid‑2025) raise hurdle rates for industrial projects, slowing approvals and extending internal valuation timelines. Customers often delay FIDs, elongating sales cycles and pushing milestone billing further out. Longer projects increase working capital needs and financing costs; conversely, future rate cuts can release pent‑up orders.
Input costs and supply chain volatility
Steel, alloys, forgings and specialty components remain exposed to sharp price swings, with China producing about 1,026 Mt of crude steel in 2023 (World Steel Association), amplifying global volatility. Long-lead procurement and hedging are critical to protect margins, while logistics bottlenecks can trigger liquidated damages if schedules slip. Supplier consolidation tightens availability and supplier bargaining power.
Labor availability and productivity
Skilled welders, machinists and engineers drive throughput and quality; BLS shows median welder wage ~$47,000 (2023) and engineers ~$100,000, while US unemployment ran ~3.9% in 2024, tightening labor supply and lifting labor costs and overtime exposure.
- Skilled labor = higher yield / lower rework
- Tight market → wage pressure
- Training boosts productivity
- Regional supply shapes site capacity
FX and export demand
Currency moves directly alter export competitiveness and project pricing; a stronger home currency (US dollar trade-weighted index ~104 in mid-2025) narrows margins on international contracts. Hedging (typical forward premia ~0.5–1.5% p.a.) reduces volatility but raises costs. Broad global diversification evens out regional demand swings and stabilizes revenue streams.
- FX shifts affect bid pricing and contract margins
- Strong home currency compresses international margins
- Hedging mitigates risk at ~0.5–1.5% p.a. cost
- Geographic diversification smooths regional downturns
US > $800B, global ~$2.4T; tariffs ITAR shift naval capex
Capital cycles in oil, gas and petrochemicals drive large-project awards: Brent ≈$86/bbl (2024) and upstream capex ≈$350bn (2024) cause ±20–30% swings in EPC backlog and margins. Higher rates (Fed funds 5.25–5.50%, 10‑yr ≈4.2% mid‑2025) raise hurdle rates, delay FIDs and increase financing/working capital needs. Input volatility (crude steel 1,026 Mt in 2023), tight labor (unemployment ~3.9% in 2024; welders ~$47k, engineers ~$100k) and USD TWI ≈104 compress international margins.
Preview the Actual Deliverable
Graham PESTLE Analysis
The Graham PESTLE Analysis preview shown here is the exact document you’ll receive after purchase—fully formatted and ready to use. It contains a comprehensive PESTLE review tailored to Graham-style investing with clear strategic insights and action points. No placeholders, no surprises.











