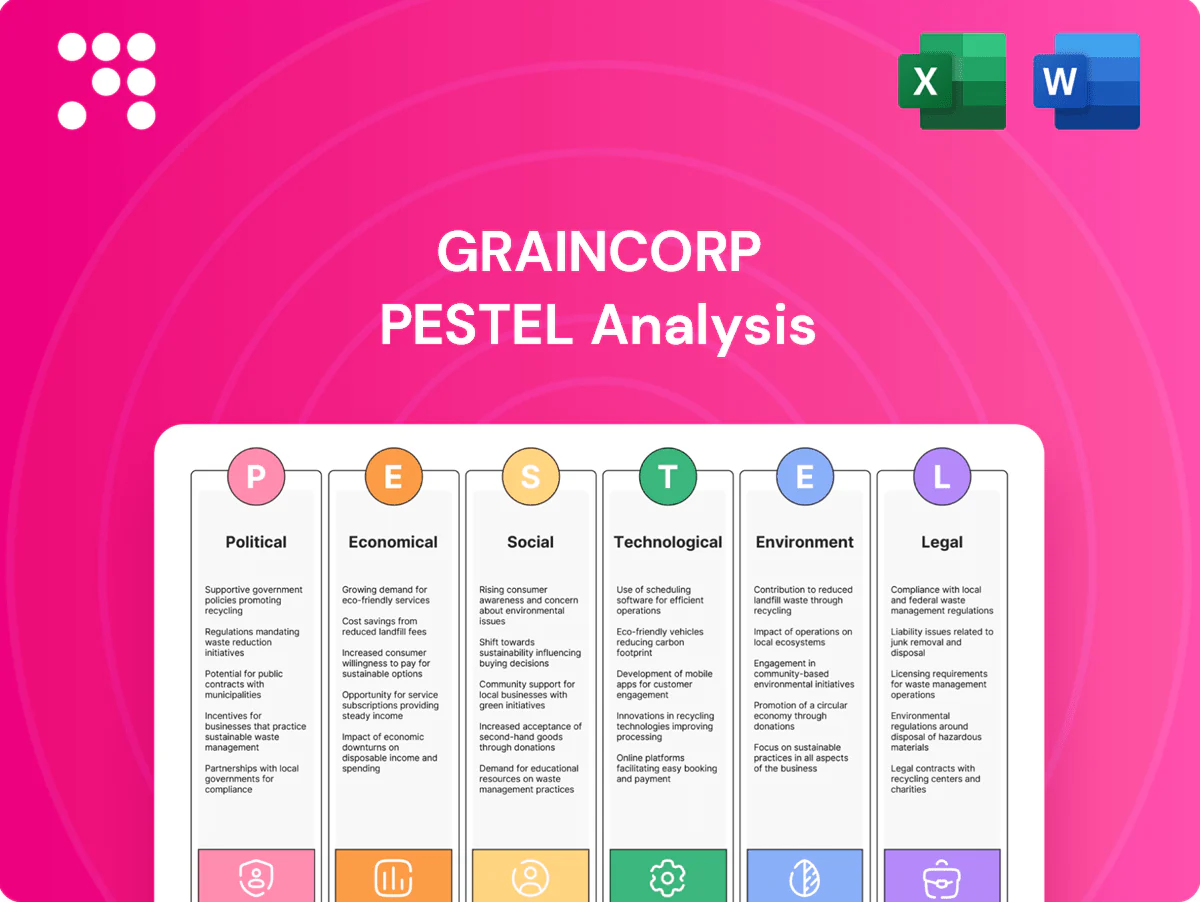
GrainCorp PESTLE Analysis

Your Competitive Advantage Starts with This Report
Unlock strategic clarity with our focused PESTLE Analysis of GrainCorp—three to five incisive sections revealing how political, economic, social, technological, legal and environmental forces shape its outlook. Ideal for investors, advisors and strategists, this concise report highlights risks and growth levers you can act on immediately. Purchase the full analysis to get the complete, editable briefing and make smarter decisions faster.
Political factors

Trade policy volatility
Shifts in export tariffs, quotas and bilateral agreements alter grain flows and price realizations, with China (≈1.4 billion) and Southeast Asia (≈680 million) key demand centers whose import rule changes can redirect volumes and squeeze GrainCorp’s margins. Sanctions or geopolitical tensions disrupt malt and edible oil trade lanes. Active government diplomacy materially affects market access for growers and GrainCorp’s network.
Biosecurity and quarantine
Stricter Australian phytosanitary standards set by the Department of Agriculture determine export eligibility and storage protocols, forcing GrainCorp to adapt facilities. Pest or disease detections trigger intensified inspection regimes that slow port logistics and scheduling. Ongoing compliance investments in fumigation, monitoring and certification raise operating costs, while strong biosecurity performance preserves GrainCorp’s brand and access to premium markets.

Infrastructure and regional policy
Public funding for projects like the AUD 10 billion Inland Rail and targeted port/road upgrades directly improves GrainCorp’s network efficiency by lowering transit times for Australia’s ~40 Mt annual grain exports. Regional development grants (Building Better Regions Fund ~AUD 2 billion total since 2015) can subsidize site expansions and modernization. Federal emphasis on supply chain resilience favors investment in strategic storage capacity, while permitting delays risk stalling critical capex.

Agricultural support programs
Agricultural support programs—subsidies, drought relief and crop insurance—shift planting incentives and throughput for GrainCorp by making some crops relatively more attractive and sustaining volumes during adverse seasons.
Government risk-sharing mechanisms stabilise grower cashflows and grain volumes, reducing revenue volatility for GrainCorp, while fuel rebates and energy credits lower handling and logistics costs.
Withdrawal or tightening of these policies would increase exposure to yield- and price-driven earnings volatility for GrainCorp.
- Subsidies influence crop mix and throughput
- Drought relief and crop insurance stabilise volumes
- Fuel rebates cut handling costs
- Policy removal raises earnings volatility
Carbon and energy policy
Australia's 2050 net‑zero pledge and 2030 target of 43% below 2005 emissions set expectations for decarbonising GrainCorp's logistics and processing. Renewables supplied about 36% of grid generation in 2024, and federal/state incentives (ARENA, state programs) can lower long‑run power costs for crushing and malting. Safeguard reforms and carbon pricing pressures (A$20–40/tCO2e in 2024–25 markets) may raise freight and thermal energy expenses; policy clarity will guide abatement sequencing and CAPEX timing.
- National targets: net‑zero 2050, 43% by 2030
- Renewables ~36% of grid (2024) — lowers long‑run power costs
- Carbon price pressure ~A$20–40/tCO2e (2024–25)
Export rules, sanctions and biosecurity reshape margins; Inland Rail AUD10bn, 43% by 2030
Export rules and diplomacy (China ≈1.4bn, SE Asia ≈680m) and sanctions reshape volumes and margins; tariff/quota shifts materially affect revenue. Biosecurity and stricter DAWE phytosanitary standards raise compliance and capex but protect market access. Infrastructure funding (Inland Rail AUD10bn) and net‑zero targets (43% by 2030; renewables ~36% in 2024) alter logistics costs and decarbonisation CAPEX.
| Item | Metric |
|---|---|
| Key markets | China 1.4bn; SE Asia 680m |
| Infra spend | Inland Rail AUD10bn |
| Emissions targets | 43% by 2030; NZ 2050 |
What is included in the product
 Detailed Word Document
Explores how external macro-environmental factors uniquely affect GrainCorp across six dimensions—Political, Economic, Social, Technological, Environmental, and Legal—backed by data and trends to help executives, investors, and strategists identify threats, opportunities and inform scenario planning.

 Customizable Excel Spreadsheet
A concise, visually segmented GrainCorp PESTLE summary that relieves meeting prep pain by distilling external risks and opportunities into editable notes for quick sharing, slide-ready use, and focused planning across teams.
Economic factors

Commodity price cycles
Volatility in wheat, barley, canola and oilseed prices—with global wheat production around 779 Mt in 2023/24 (USDA) and world rapeseed/canola ~73 Mt—directly drives GrainCorp throughput and merchandising margins. Basis swings, often A$20–60/ton in Australian origins, alter storage utilization and hedging outcomes. Profitability correlates with harvest size and shifting global supply–demand balances. Diversification across value chains smooths this cyclicality.
Currency fluctuations
AUD/USD around 0.64 in mid‑2025 and ~8% weaker year‑on‑year in 2024 directly alters GrainCorp export competitiveness and import input costs via cross rates. Translation effects dent reported earnings from international malt sales when revenues booked in USD/EUR are converted to AUD. Hedging programs reduce but do not eliminate FX exposure, leaving residual P&L volatility. Currency swings also shift farmer selling timing, often delaying sales when AUD strengthens.

Interest rates and capital intensity
Rising rates such as the RBA cash rate around 4.35% (May 2024) lift GrainCorp's financing costs for inventory, infrastructure and working capital, increasing interest expense on floating debt and leases. Higher project hurdle rates and tighter lease economics raise required returns, while bank covenants and access to capital markets shape investment pacing. Efficient asset turns and shorter inventory days become critical to offset higher carrying costs.

Freight and energy costs
Diesel, electricity and marine freight rates materially compress GrainCorp margins by driving terminal and logistics costs; rail access charges and port fees further shape routing and loading decisions. Long-term contracts reduce spot exposure volatility while spot markets can sharply raise input costs. Energy hedging and targeted efficiency upgrades protect EBITDA by stabilising cash costs and lowering fuel intensity.
- Cost drivers: diesel, electricity, marine freight, rail/port fees
- Risk exposure: long-term contracts vs spot
- Mitigants: hedging, efficiency upgrades
Global demand for malt and oils
Global beer and spirits cycles drive malt volumes and pricing; the global malt market was estimated at about USD 5.8 billion in 2024, making brew cycle swings material for GrainCorp revenue. Food manufacturers’ appetite for canola and specialty oils — amid roughly 78 million tonnes of global rapeseed/canola output in 2024 — supports higher value-added margins. Rising incomes in emerging markets (~4%–4.5% growth in 2024) expand addressable demand, while recessions compress discretionary consumption and premium mix.
- malt market: USD 5.8bn (2024 est)
- canola/rapeseed supply: ~78Mt (2024)
- EM income growth: ~4%–4.5% (2024)
- recession risk: lowers premium/mix
Export rules, sanctions and biosecurity reshape margins; Inland Rail AUD10bn, 43% by 2030
Commodity price swings (wheat 779 Mt 2023/24; canola ~78 Mt 2024) drive GrainCorp throughput, margins and storage utilisation. AUD/USD ~0.64 mid‑2025 and RBA cash ~4.35% (May 2024) affect export competitiveness and funding costs. Energy, freight and rail fees and malt market size (~USD 5.8bn 2024) materially compress or boost EBITDA depending on spot vs contracted exposure.
| Metric | Value |
|---|---|
| Wheat (2023/24) | 779 Mt |
| Canola/Rapeseed (2024) | ~78 Mt |
| AUD/USD (mid‑2025) | ~0.64 |
| RBA cash (May 2024) | 4.35% |
| Malt market (2024) | ~USD 5.8bn |
Preview the Actual Deliverable
GrainCorp PESTLE Analysis
The preview shown here is the exact GrainCorp PESTLE Analysis you’ll receive after purchase—fully formatted and ready to use. This is the final version with complete content and structure, not a teaser or placeholder. The file you see is the finished product and will be delivered instantly after payment.

Your Competitive Advantage Starts with This Report
Unlock strategic clarity with our focused PESTLE Analysis of GrainCorp—three to five incisive sections revealing how political, economic, social, technological, legal and environmental forces shape its outlook. Ideal for investors, advisors and strategists, this concise report highlights risks and growth levers you can act on immediately. Purchase the full analysis to get the complete, editable briefing and make smarter decisions faster.
Political factors
Trade policy volatility
Shifts in export tariffs, quotas and bilateral agreements alter grain flows and price realizations, with China (≈1.4 billion) and Southeast Asia (≈680 million) key demand centers whose import rule changes can redirect volumes and squeeze GrainCorp’s margins. Sanctions or geopolitical tensions disrupt malt and edible oil trade lanes. Active government diplomacy materially affects market access for growers and GrainCorp’s network.
Biosecurity and quarantine
Stricter Australian phytosanitary standards set by the Department of Agriculture determine export eligibility and storage protocols, forcing GrainCorp to adapt facilities. Pest or disease detections trigger intensified inspection regimes that slow port logistics and scheduling. Ongoing compliance investments in fumigation, monitoring and certification raise operating costs, while strong biosecurity performance preserves GrainCorp’s brand and access to premium markets.
Infrastructure and regional policy
Public funding for projects like the AUD 10 billion Inland Rail and targeted port/road upgrades directly improves GrainCorp’s network efficiency by lowering transit times for Australia’s ~40 Mt annual grain exports. Regional development grants (Building Better Regions Fund ~AUD 2 billion total since 2015) can subsidize site expansions and modernization. Federal emphasis on supply chain resilience favors investment in strategic storage capacity, while permitting delays risk stalling critical capex.
Agricultural support programs
Agricultural support programs—subsidies, drought relief and crop insurance—shift planting incentives and throughput for GrainCorp by making some crops relatively more attractive and sustaining volumes during adverse seasons.
Government risk-sharing mechanisms stabilise grower cashflows and grain volumes, reducing revenue volatility for GrainCorp, while fuel rebates and energy credits lower handling and logistics costs.
Withdrawal or tightening of these policies would increase exposure to yield- and price-driven earnings volatility for GrainCorp.
- Subsidies influence crop mix and throughput
- Drought relief and crop insurance stabilise volumes
- Fuel rebates cut handling costs
- Policy removal raises earnings volatility
Carbon and energy policy
Australia's 2050 net‑zero pledge and 2030 target of 43% below 2005 emissions set expectations for decarbonising GrainCorp's logistics and processing. Renewables supplied about 36% of grid generation in 2024, and federal/state incentives (ARENA, state programs) can lower long‑run power costs for crushing and malting. Safeguard reforms and carbon pricing pressures (A$20–40/tCO2e in 2024–25 markets) may raise freight and thermal energy expenses; policy clarity will guide abatement sequencing and CAPEX timing.
- National targets: net‑zero 2050, 43% by 2030
- Renewables ~36% of grid (2024) — lowers long‑run power costs
- Carbon price pressure ~A$20–40/tCO2e (2024–25)
Export rules, sanctions and biosecurity reshape margins; Inland Rail AUD10bn, 43% by 2030
Export rules and diplomacy (China ≈1.4bn, SE Asia ≈680m) and sanctions reshape volumes and margins; tariff/quota shifts materially affect revenue. Biosecurity and stricter DAWE phytosanitary standards raise compliance and capex but protect market access. Infrastructure funding (Inland Rail AUD10bn) and net‑zero targets (43% by 2030; renewables ~36% in 2024) alter logistics costs and decarbonisation CAPEX.
| Item | Metric |
|---|---|
| Key markets | China 1.4bn; SE Asia 680m |
| Infra spend | Inland Rail AUD10bn |
| Emissions targets | 43% by 2030; NZ 2050 |
What is included in the product
Detailed Word Document
Explores how external macro-environmental factors uniquely affect GrainCorp across six dimensions—Political, Economic, Social, Technological, Environmental, and Legal—backed by data and trends to help executives, investors, and strategists identify threats, opportunities and inform scenario planning.
Customizable Excel Spreadsheet
A concise, visually segmented GrainCorp PESTLE summary that relieves meeting prep pain by distilling external risks and opportunities into editable notes for quick sharing, slide-ready use, and focused planning across teams.
Economic factors
Commodity price cycles
Volatility in wheat, barley, canola and oilseed prices—with global wheat production around 779 Mt in 2023/24 (USDA) and world rapeseed/canola ~73 Mt—directly drives GrainCorp throughput and merchandising margins. Basis swings, often A$20–60/ton in Australian origins, alter storage utilization and hedging outcomes. Profitability correlates with harvest size and shifting global supply–demand balances. Diversification across value chains smooths this cyclicality.
Currency fluctuations
AUD/USD around 0.64 in mid‑2025 and ~8% weaker year‑on‑year in 2024 directly alters GrainCorp export competitiveness and import input costs via cross rates. Translation effects dent reported earnings from international malt sales when revenues booked in USD/EUR are converted to AUD. Hedging programs reduce but do not eliminate FX exposure, leaving residual P&L volatility. Currency swings also shift farmer selling timing, often delaying sales when AUD strengthens.
Interest rates and capital intensity
Rising rates such as the RBA cash rate around 4.35% (May 2024) lift GrainCorp's financing costs for inventory, infrastructure and working capital, increasing interest expense on floating debt and leases. Higher project hurdle rates and tighter lease economics raise required returns, while bank covenants and access to capital markets shape investment pacing. Efficient asset turns and shorter inventory days become critical to offset higher carrying costs.
Freight and energy costs
Diesel, electricity and marine freight rates materially compress GrainCorp margins by driving terminal and logistics costs; rail access charges and port fees further shape routing and loading decisions. Long-term contracts reduce spot exposure volatility while spot markets can sharply raise input costs. Energy hedging and targeted efficiency upgrades protect EBITDA by stabilising cash costs and lowering fuel intensity.
- Cost drivers: diesel, electricity, marine freight, rail/port fees
- Risk exposure: long-term contracts vs spot
- Mitigants: hedging, efficiency upgrades
Global demand for malt and oils
Global beer and spirits cycles drive malt volumes and pricing; the global malt market was estimated at about USD 5.8 billion in 2024, making brew cycle swings material for GrainCorp revenue. Food manufacturers’ appetite for canola and specialty oils — amid roughly 78 million tonnes of global rapeseed/canola output in 2024 — supports higher value-added margins. Rising incomes in emerging markets (~4%–4.5% growth in 2024) expand addressable demand, while recessions compress discretionary consumption and premium mix.
- malt market: USD 5.8bn (2024 est)
- canola/rapeseed supply: ~78Mt (2024)
- EM income growth: ~4%–4.5% (2024)
- recession risk: lowers premium/mix
Export rules, sanctions and biosecurity reshape margins; Inland Rail AUD10bn, 43% by 2030
Commodity price swings (wheat 779 Mt 2023/24; canola ~78 Mt 2024) drive GrainCorp throughput, margins and storage utilisation. AUD/USD ~0.64 mid‑2025 and RBA cash ~4.35% (May 2024) affect export competitiveness and funding costs. Energy, freight and rail fees and malt market size (~USD 5.8bn 2024) materially compress or boost EBITDA depending on spot vs contracted exposure.
| Metric | Value |
|---|---|
| Wheat (2023/24) | 779 Mt |
| Canola/Rapeseed (2024) | ~78 Mt |
| AUD/USD (mid‑2025) | ~0.64 |
| RBA cash (May 2024) | 4.35% |
| Malt market (2024) | ~USD 5.8bn |
Preview the Actual Deliverable
GrainCorp PESTLE Analysis
The preview shown here is the exact GrainCorp PESTLE Analysis you’ll receive after purchase—fully formatted and ready to use. This is the final version with complete content and structure, not a teaser or placeholder. The file you see is the finished product and will be delivered instantly after payment.
Original: $10.00
-65%$10.00
$3.50Description
Your Competitive Advantage Starts with This Report
Unlock strategic clarity with our focused PESTLE Analysis of GrainCorp—three to five incisive sections revealing how political, economic, social, technological, legal and environmental forces shape its outlook. Ideal for investors, advisors and strategists, this concise report highlights risks and growth levers you can act on immediately. Purchase the full analysis to get the complete, editable briefing and make smarter decisions faster.
Political factors
Trade policy volatility
Shifts in export tariffs, quotas and bilateral agreements alter grain flows and price realizations, with China (≈1.4 billion) and Southeast Asia (≈680 million) key demand centers whose import rule changes can redirect volumes and squeeze GrainCorp’s margins. Sanctions or geopolitical tensions disrupt malt and edible oil trade lanes. Active government diplomacy materially affects market access for growers and GrainCorp’s network.
Biosecurity and quarantine
Stricter Australian phytosanitary standards set by the Department of Agriculture determine export eligibility and storage protocols, forcing GrainCorp to adapt facilities. Pest or disease detections trigger intensified inspection regimes that slow port logistics and scheduling. Ongoing compliance investments in fumigation, monitoring and certification raise operating costs, while strong biosecurity performance preserves GrainCorp’s brand and access to premium markets.
Infrastructure and regional policy
Public funding for projects like the AUD 10 billion Inland Rail and targeted port/road upgrades directly improves GrainCorp’s network efficiency by lowering transit times for Australia’s ~40 Mt annual grain exports. Regional development grants (Building Better Regions Fund ~AUD 2 billion total since 2015) can subsidize site expansions and modernization. Federal emphasis on supply chain resilience favors investment in strategic storage capacity, while permitting delays risk stalling critical capex.
Agricultural support programs
Agricultural support programs—subsidies, drought relief and crop insurance—shift planting incentives and throughput for GrainCorp by making some crops relatively more attractive and sustaining volumes during adverse seasons.
Government risk-sharing mechanisms stabilise grower cashflows and grain volumes, reducing revenue volatility for GrainCorp, while fuel rebates and energy credits lower handling and logistics costs.
Withdrawal or tightening of these policies would increase exposure to yield- and price-driven earnings volatility for GrainCorp.
- Subsidies influence crop mix and throughput
- Drought relief and crop insurance stabilise volumes
- Fuel rebates cut handling costs
- Policy removal raises earnings volatility
Carbon and energy policy
Australia's 2050 net‑zero pledge and 2030 target of 43% below 2005 emissions set expectations for decarbonising GrainCorp's logistics and processing. Renewables supplied about 36% of grid generation in 2024, and federal/state incentives (ARENA, state programs) can lower long‑run power costs for crushing and malting. Safeguard reforms and carbon pricing pressures (A$20–40/tCO2e in 2024–25 markets) may raise freight and thermal energy expenses; policy clarity will guide abatement sequencing and CAPEX timing.
- National targets: net‑zero 2050, 43% by 2030
- Renewables ~36% of grid (2024) — lowers long‑run power costs
- Carbon price pressure ~A$20–40/tCO2e (2024–25)
Export rules, sanctions and biosecurity reshape margins; Inland Rail AUD10bn, 43% by 2030
Export rules and diplomacy (China ≈1.4bn, SE Asia ≈680m) and sanctions reshape volumes and margins; tariff/quota shifts materially affect revenue. Biosecurity and stricter DAWE phytosanitary standards raise compliance and capex but protect market access. Infrastructure funding (Inland Rail AUD10bn) and net‑zero targets (43% by 2030; renewables ~36% in 2024) alter logistics costs and decarbonisation CAPEX.
| Item | Metric |
|---|---|
| Key markets | China 1.4bn; SE Asia 680m |
| Infra spend | Inland Rail AUD10bn |
| Emissions targets | 43% by 2030; NZ 2050 |
What is included in the product
Detailed Word Document
Explores how external macro-environmental factors uniquely affect GrainCorp across six dimensions—Political, Economic, Social, Technological, Environmental, and Legal—backed by data and trends to help executives, investors, and strategists identify threats, opportunities and inform scenario planning.
Customizable Excel Spreadsheet
A concise, visually segmented GrainCorp PESTLE summary that relieves meeting prep pain by distilling external risks and opportunities into editable notes for quick sharing, slide-ready use, and focused planning across teams.
Economic factors
Commodity price cycles
Volatility in wheat, barley, canola and oilseed prices—with global wheat production around 779 Mt in 2023/24 (USDA) and world rapeseed/canola ~73 Mt—directly drives GrainCorp throughput and merchandising margins. Basis swings, often A$20–60/ton in Australian origins, alter storage utilization and hedging outcomes. Profitability correlates with harvest size and shifting global supply–demand balances. Diversification across value chains smooths this cyclicality.
Currency fluctuations
AUD/USD around 0.64 in mid‑2025 and ~8% weaker year‑on‑year in 2024 directly alters GrainCorp export competitiveness and import input costs via cross rates. Translation effects dent reported earnings from international malt sales when revenues booked in USD/EUR are converted to AUD. Hedging programs reduce but do not eliminate FX exposure, leaving residual P&L volatility. Currency swings also shift farmer selling timing, often delaying sales when AUD strengthens.
Interest rates and capital intensity
Rising rates such as the RBA cash rate around 4.35% (May 2024) lift GrainCorp's financing costs for inventory, infrastructure and working capital, increasing interest expense on floating debt and leases. Higher project hurdle rates and tighter lease economics raise required returns, while bank covenants and access to capital markets shape investment pacing. Efficient asset turns and shorter inventory days become critical to offset higher carrying costs.
Freight and energy costs
Diesel, electricity and marine freight rates materially compress GrainCorp margins by driving terminal and logistics costs; rail access charges and port fees further shape routing and loading decisions. Long-term contracts reduce spot exposure volatility while spot markets can sharply raise input costs. Energy hedging and targeted efficiency upgrades protect EBITDA by stabilising cash costs and lowering fuel intensity.
- Cost drivers: diesel, electricity, marine freight, rail/port fees
- Risk exposure: long-term contracts vs spot
- Mitigants: hedging, efficiency upgrades
Global demand for malt and oils
Global beer and spirits cycles drive malt volumes and pricing; the global malt market was estimated at about USD 5.8 billion in 2024, making brew cycle swings material for GrainCorp revenue. Food manufacturers’ appetite for canola and specialty oils — amid roughly 78 million tonnes of global rapeseed/canola output in 2024 — supports higher value-added margins. Rising incomes in emerging markets (~4%–4.5% growth in 2024) expand addressable demand, while recessions compress discretionary consumption and premium mix.
- malt market: USD 5.8bn (2024 est)
- canola/rapeseed supply: ~78Mt (2024)
- EM income growth: ~4%–4.5% (2024)
- recession risk: lowers premium/mix
Export rules, sanctions and biosecurity reshape margins; Inland Rail AUD10bn, 43% by 2030
Commodity price swings (wheat 779 Mt 2023/24; canola ~78 Mt 2024) drive GrainCorp throughput, margins and storage utilisation. AUD/USD ~0.64 mid‑2025 and RBA cash ~4.35% (May 2024) affect export competitiveness and funding costs. Energy, freight and rail fees and malt market size (~USD 5.8bn 2024) materially compress or boost EBITDA depending on spot vs contracted exposure.
| Metric | Value |
|---|---|
| Wheat (2023/24) | 779 Mt |
| Canola/Rapeseed (2024) | ~78 Mt |
| AUD/USD (mid‑2025) | ~0.64 |
| RBA cash (May 2024) | 4.35% |
| Malt market (2024) | ~USD 5.8bn |
Preview the Actual Deliverable
GrainCorp PESTLE Analysis
The preview shown here is the exact GrainCorp PESTLE Analysis you’ll receive after purchase—fully formatted and ready to use. This is the final version with complete content and structure, not a teaser or placeholder. The file you see is the finished product and will be delivered instantly after payment.











