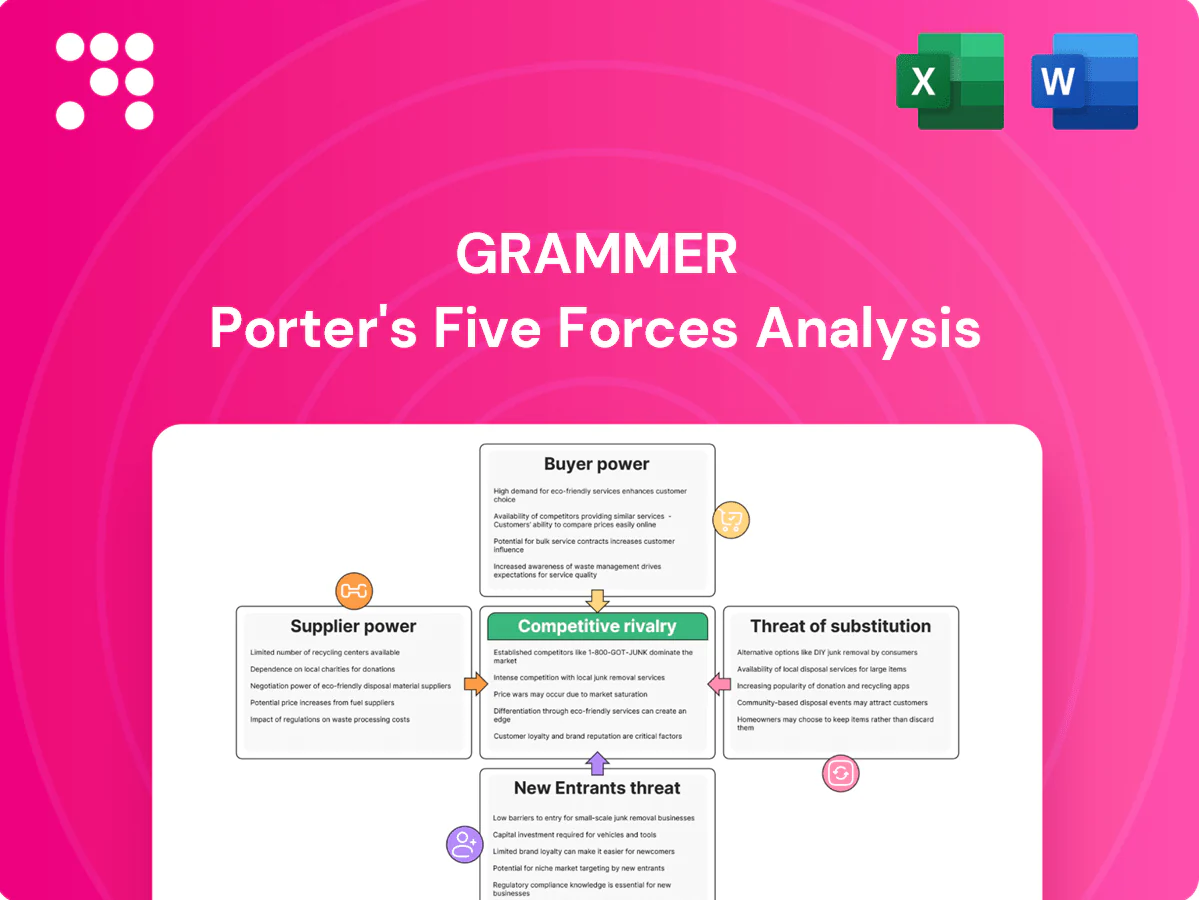
Grammer Porter's Five Forces Analysis

From Overview to Strategy Blueprint
Grammer’s Porter's Five Forces snapshot highlights supplier leverage, buyer power, competitive rivalry, threats from substitutes, and entry barriers to reveal where margin pressure and strategic opportunity lie. It outlines key dynamics shaping Grammer’s competitive stance and near‑term risks. This brief whets the appetite—dive into the full report for force‑by‑force ratings, visuals, and actionable strategy. Unlock the complete analysis to inform investment or strategic decisions.
Suppliers Bargaining Power

Specialized materials and components
Grammer depends on specialty foams, airbags, textiles, metals and mechatronics that lack perfect substitutes, so suppliers of sensors, actuators and seat mechanisms can command premiums due to certification and performance specifications. This supplier concentration raises switching costs and creates lead-time and quality risks, evidenced by industry supply-chain disruptions in 2024. Dual-sourcing and design-to-cost strategies are critical to mitigate this supplier leverage.
Electronics and semiconductor dependence
Seat controls, occupant detection and comfort systems rely on chips and controllers that faced scarcity, with automotive semiconductor lead times averaging about 24 weeks in 2024 and allocation cuts up to 30% for some SKUs; tier-2 electronics vendors leverage allocation and minimum order quantities to exert pricing and delivery power, while multi-month validation cycles prevent rapid supplier swaps, forcing OEMs into forward buys and multi-year strategic agreements to secure supply.

Commodity price volatility
Steel, aluminum, plastics and chemical feedstock price swings hit Grammer in 2024, with intra‑year moves of roughly 15–25% across HRC, LME aluminium and polymer indices, forcing suppliers to push through surcharges faster than OEM contracts allow recovery; indexation and hedging clauses (3–12 month lag windows) became critical as timing mismatches compressed margins by several percentage points during downcycles.

Quality and homologation lock-in
Automotive PPAP (AIAG PPAP: 18 elements) plus DV/PV testing and safety homologations create strong quality and homologation lock-in once a platform is awarded, since DV/PV often spans 6–12 months and homologation dossiers are program-specific. Requalifying alternates mid-program is costly and time-consuming, granting approved suppliers bargaining leverage; disciplined SQE and APQP can contain this power.
ESG and regional compliance
REACH now covers over 22,000 registered substances and the EU 2023 PFAS restriction proposal targets thousands of PFAS, while rising recycled-content and traceability mandates are shrinking eligible supplier pools; fewer compliant sources raise supplier power in textiles and chemicals, and local content rules further constrain selection, so building regional supplier ecosystems can rebalance terms.
- REACH: >22,000 substances
- PFAS: EU 2023 proposal targets thousands
- Recycled content/traceability: narrows eligible suppliers
- Regional sourcing: reduces supplier leverage
Supplier leverage rises as chip lead time ~24 weeks and regs tighten
Grammer's suppliers of specialty foams, sensors, actuators and mechatronics retain high leverage due to limited substitutes, certification needs and platform lock‑in, raising switching costs and lead‑time risks. Semiconductor scarcity (avg lead time ~24 weeks; allocation cuts up to 30% in 2024) and commodity swings (15–25% intra‑year) compressed margins. Regulatory constraints (REACH >22,000 substances; EU PFAS proposals) and recycled‑content rules shrink eligible sources, increasing supplier power.
| Metric | 2024 |
|---|---|
| Semiconductor lead time | ~24 weeks |
| Allocation cuts | up to 30% |
| Commodity price swings | 15–25% |
| REACH registered | >22,000 substances |
What is included in the product
 Detailed Word Document
Concise Porter's Five Forces analysis for Grammer, identifying competitive rivalry, supplier and buyer power, substitute threats, and entry barriers—highlighting strategic levers to protect margins and market share.

 Customizable Excel Spreadsheet
A concise, one-sheet Grammer Porter's Five Forces summary that surfaces key competitive pain points and recommended relief actions for faster, clearer strategic decisions. Editable pressure levels and an instant radar view let you test scenarios and deliver board-ready insights in seconds.
Customers Bargaining Power

Highly concentrated OEM customer base
Global auto and CV OEMs, concentrated among a few groups, buy components through professional procurement and RFQs that commonly exceed $100m per program, enabling aggressive supplier price competition. This concentration exerts intense price pressure and enforces strict service KPIs and warranty metrics. Success hinges on lowest total cost, demonstrable innovation, and a global footprint to match OEM sourcing locations.
Design-in and platform dependence
Seats and interior components are designed-in for multi-year platform cycles typically lasting 5–7 years, which stabilizes volumes but gives OEMs strong leverage to negotiate steep upfront price concessions of roughly 10–20% on program awards in 2024. Cost-down curves are often embedded across the program life, averaging about 3% annual unit-cost reduction targets. Switching mid-cycle is rare, so OEMs extract value early. Rigorous value engineering—often responsible for over half of realized cost savings—is essential to preserve supplier margins.

High quality and delivery requirements
Zero-defect expectations, frequent warranty backcharges and JIT delivery shift significant cost and risk to suppliers, increasing buyer leverage. OEM scorecards now typically allocate more than 40% weight to quality and logistics in 2024 sourcing decisions, steering preferred suppliers. This operational leverage extends buyer power beyond price into process control. Robust quality systems and top-tier logistics performance are strategic defenses suppliers must show.

Make-or-buy and vertical integration options
Some OEMs retain in-house seating or interior capabilities as a bargaining lever, a vertical-integration trend noted in 2024 that raises insourcing threat. That threat disciplines pricing and forces suppliers to commit to measurable innovation roadmaps. Grammer must differentiate through ergonomics, comfort features and cost competitiveness; co-development with OEMs reduces insource risk and secures share.
- OEM insourcing trend 2024: strategic lever
- Supplier response: pricing discipline, innovation commitments
- Grammer focus: ergonomics, comfort, cost
- Mitigation: co-development partnerships
Aftermarket and non-OEM niches
In commercial and off-road seating, aftermarket and specialty channels modestly dilute OEM bargaining power by providing alternative supply, though total volume remains noticeably smaller and buyers stay price-sensitive. Differentiated comfort and durability features in non-OEM seats can command premiums and reduce price elasticity. Maintaining a balanced channel mix—OEM, aftermarket, and specialty—improves negotiating leverage with fleet and dealer customers.
- aftermarket reduces oem leverage
- volume lower, price sensitivity high
- differentiation yields premium
- balanced channels = stronger negotiating position
OEM RFQs >$100m drive 10–20% upfront concessions and ~3% annual cost-downs
OEM concentration drives strong buyer power: program RFQs often exceed $100m, securing 10–20% upfront price concessions in 2024 and ~3% annual cost-down targets. OEM scorecards now allocate over 40% weight to quality and logistics, shifting warranty and JIT risk to suppliers. Insourcing pressure rose in 2024; aftermarket channels provide smaller volume alternatives that can command premiums if highly differentiated.
| Metric | 2024 Value |
|---|---|
| Typical RFQ size | >$100m |
| Upfront price concession | 10–20% |
| Annual cost-down target | ~3% |
| Scorecard weight on quality/logistics | >40% |
Same Document Delivered
Grammer Porter's Five Forces Analysis
This Grammer Porter Five Forces analysis delivers a concise assessment of industry rivalry, buyer and supplier power, threats of entry and substitution, and strategic implications for competitive positioning. This preview is the exact document you’ll receive after purchase—fully formatted and ready for use. No samples or placeholders—instant access to the final file upon payment.

From Overview to Strategy Blueprint
Grammer’s Porter's Five Forces snapshot highlights supplier leverage, buyer power, competitive rivalry, threats from substitutes, and entry barriers to reveal where margin pressure and strategic opportunity lie. It outlines key dynamics shaping Grammer’s competitive stance and near‑term risks. This brief whets the appetite—dive into the full report for force‑by‑force ratings, visuals, and actionable strategy. Unlock the complete analysis to inform investment or strategic decisions.
Suppliers Bargaining Power
Specialized materials and components
Grammer depends on specialty foams, airbags, textiles, metals and mechatronics that lack perfect substitutes, so suppliers of sensors, actuators and seat mechanisms can command premiums due to certification and performance specifications. This supplier concentration raises switching costs and creates lead-time and quality risks, evidenced by industry supply-chain disruptions in 2024. Dual-sourcing and design-to-cost strategies are critical to mitigate this supplier leverage.
Electronics and semiconductor dependence
Seat controls, occupant detection and comfort systems rely on chips and controllers that faced scarcity, with automotive semiconductor lead times averaging about 24 weeks in 2024 and allocation cuts up to 30% for some SKUs; tier-2 electronics vendors leverage allocation and minimum order quantities to exert pricing and delivery power, while multi-month validation cycles prevent rapid supplier swaps, forcing OEMs into forward buys and multi-year strategic agreements to secure supply.
Commodity price volatility
Steel, aluminum, plastics and chemical feedstock price swings hit Grammer in 2024, with intra‑year moves of roughly 15–25% across HRC, LME aluminium and polymer indices, forcing suppliers to push through surcharges faster than OEM contracts allow recovery; indexation and hedging clauses (3–12 month lag windows) became critical as timing mismatches compressed margins by several percentage points during downcycles.
Quality and homologation lock-in
Automotive PPAP (AIAG PPAP: 18 elements) plus DV/PV testing and safety homologations create strong quality and homologation lock-in once a platform is awarded, since DV/PV often spans 6–12 months and homologation dossiers are program-specific. Requalifying alternates mid-program is costly and time-consuming, granting approved suppliers bargaining leverage; disciplined SQE and APQP can contain this power.
ESG and regional compliance
REACH now covers over 22,000 registered substances and the EU 2023 PFAS restriction proposal targets thousands of PFAS, while rising recycled-content and traceability mandates are shrinking eligible supplier pools; fewer compliant sources raise supplier power in textiles and chemicals, and local content rules further constrain selection, so building regional supplier ecosystems can rebalance terms.
- REACH: >22,000 substances
- PFAS: EU 2023 proposal targets thousands
- Recycled content/traceability: narrows eligible suppliers
- Regional sourcing: reduces supplier leverage
Supplier leverage rises as chip lead time ~24 weeks and regs tighten
Grammer's suppliers of specialty foams, sensors, actuators and mechatronics retain high leverage due to limited substitutes, certification needs and platform lock‑in, raising switching costs and lead‑time risks. Semiconductor scarcity (avg lead time ~24 weeks; allocation cuts up to 30% in 2024) and commodity swings (15–25% intra‑year) compressed margins. Regulatory constraints (REACH >22,000 substances; EU PFAS proposals) and recycled‑content rules shrink eligible sources, increasing supplier power.
| Metric | 2024 |
|---|---|
| Semiconductor lead time | ~24 weeks |
| Allocation cuts | up to 30% |
| Commodity price swings | 15–25% |
| REACH registered | >22,000 substances |
What is included in the product
Detailed Word Document
Concise Porter's Five Forces analysis for Grammer, identifying competitive rivalry, supplier and buyer power, substitute threats, and entry barriers—highlighting strategic levers to protect margins and market share.
Customizable Excel Spreadsheet
A concise, one-sheet Grammer Porter's Five Forces summary that surfaces key competitive pain points and recommended relief actions for faster, clearer strategic decisions. Editable pressure levels and an instant radar view let you test scenarios and deliver board-ready insights in seconds.
Customers Bargaining Power
Highly concentrated OEM customer base
Global auto and CV OEMs, concentrated among a few groups, buy components through professional procurement and RFQs that commonly exceed $100m per program, enabling aggressive supplier price competition. This concentration exerts intense price pressure and enforces strict service KPIs and warranty metrics. Success hinges on lowest total cost, demonstrable innovation, and a global footprint to match OEM sourcing locations.
Design-in and platform dependence
Seats and interior components are designed-in for multi-year platform cycles typically lasting 5–7 years, which stabilizes volumes but gives OEMs strong leverage to negotiate steep upfront price concessions of roughly 10–20% on program awards in 2024. Cost-down curves are often embedded across the program life, averaging about 3% annual unit-cost reduction targets. Switching mid-cycle is rare, so OEMs extract value early. Rigorous value engineering—often responsible for over half of realized cost savings—is essential to preserve supplier margins.
High quality and delivery requirements
Zero-defect expectations, frequent warranty backcharges and JIT delivery shift significant cost and risk to suppliers, increasing buyer leverage. OEM scorecards now typically allocate more than 40% weight to quality and logistics in 2024 sourcing decisions, steering preferred suppliers. This operational leverage extends buyer power beyond price into process control. Robust quality systems and top-tier logistics performance are strategic defenses suppliers must show.
Make-or-buy and vertical integration options
Some OEMs retain in-house seating or interior capabilities as a bargaining lever, a vertical-integration trend noted in 2024 that raises insourcing threat. That threat disciplines pricing and forces suppliers to commit to measurable innovation roadmaps. Grammer must differentiate through ergonomics, comfort features and cost competitiveness; co-development with OEMs reduces insource risk and secures share.
- OEM insourcing trend 2024: strategic lever
- Supplier response: pricing discipline, innovation commitments
- Grammer focus: ergonomics, comfort, cost
- Mitigation: co-development partnerships
Aftermarket and non-OEM niches
In commercial and off-road seating, aftermarket and specialty channels modestly dilute OEM bargaining power by providing alternative supply, though total volume remains noticeably smaller and buyers stay price-sensitive. Differentiated comfort and durability features in non-OEM seats can command premiums and reduce price elasticity. Maintaining a balanced channel mix—OEM, aftermarket, and specialty—improves negotiating leverage with fleet and dealer customers.
- aftermarket reduces oem leverage
- volume lower, price sensitivity high
- differentiation yields premium
- balanced channels = stronger negotiating position
OEM RFQs >$100m drive 10–20% upfront concessions and ~3% annual cost-downs
OEM concentration drives strong buyer power: program RFQs often exceed $100m, securing 10–20% upfront price concessions in 2024 and ~3% annual cost-down targets. OEM scorecards now allocate over 40% weight to quality and logistics, shifting warranty and JIT risk to suppliers. Insourcing pressure rose in 2024; aftermarket channels provide smaller volume alternatives that can command premiums if highly differentiated.
| Metric | 2024 Value |
|---|---|
| Typical RFQ size | >$100m |
| Upfront price concession | 10–20% |
| Annual cost-down target | ~3% |
| Scorecard weight on quality/logistics | >40% |
Same Document Delivered
Grammer Porter's Five Forces Analysis
This Grammer Porter Five Forces analysis delivers a concise assessment of industry rivalry, buyer and supplier power, threats of entry and substitution, and strategic implications for competitive positioning. This preview is the exact document you’ll receive after purchase—fully formatted and ready for use. No samples or placeholders—instant access to the final file upon payment.
Description
From Overview to Strategy Blueprint
Grammer’s Porter's Five Forces snapshot highlights supplier leverage, buyer power, competitive rivalry, threats from substitutes, and entry barriers to reveal where margin pressure and strategic opportunity lie. It outlines key dynamics shaping Grammer’s competitive stance and near‑term risks. This brief whets the appetite—dive into the full report for force‑by‑force ratings, visuals, and actionable strategy. Unlock the complete analysis to inform investment or strategic decisions.
Suppliers Bargaining Power
Specialized materials and components
Grammer depends on specialty foams, airbags, textiles, metals and mechatronics that lack perfect substitutes, so suppliers of sensors, actuators and seat mechanisms can command premiums due to certification and performance specifications. This supplier concentration raises switching costs and creates lead-time and quality risks, evidenced by industry supply-chain disruptions in 2024. Dual-sourcing and design-to-cost strategies are critical to mitigate this supplier leverage.
Electronics and semiconductor dependence
Seat controls, occupant detection and comfort systems rely on chips and controllers that faced scarcity, with automotive semiconductor lead times averaging about 24 weeks in 2024 and allocation cuts up to 30% for some SKUs; tier-2 electronics vendors leverage allocation and minimum order quantities to exert pricing and delivery power, while multi-month validation cycles prevent rapid supplier swaps, forcing OEMs into forward buys and multi-year strategic agreements to secure supply.
Commodity price volatility
Steel, aluminum, plastics and chemical feedstock price swings hit Grammer in 2024, with intra‑year moves of roughly 15–25% across HRC, LME aluminium and polymer indices, forcing suppliers to push through surcharges faster than OEM contracts allow recovery; indexation and hedging clauses (3–12 month lag windows) became critical as timing mismatches compressed margins by several percentage points during downcycles.
Quality and homologation lock-in
Automotive PPAP (AIAG PPAP: 18 elements) plus DV/PV testing and safety homologations create strong quality and homologation lock-in once a platform is awarded, since DV/PV often spans 6–12 months and homologation dossiers are program-specific. Requalifying alternates mid-program is costly and time-consuming, granting approved suppliers bargaining leverage; disciplined SQE and APQP can contain this power.
ESG and regional compliance
REACH now covers over 22,000 registered substances and the EU 2023 PFAS restriction proposal targets thousands of PFAS, while rising recycled-content and traceability mandates are shrinking eligible supplier pools; fewer compliant sources raise supplier power in textiles and chemicals, and local content rules further constrain selection, so building regional supplier ecosystems can rebalance terms.
- REACH: >22,000 substances
- PFAS: EU 2023 proposal targets thousands
- Recycled content/traceability: narrows eligible suppliers
- Regional sourcing: reduces supplier leverage
Supplier leverage rises as chip lead time ~24 weeks and regs tighten
Grammer's suppliers of specialty foams, sensors, actuators and mechatronics retain high leverage due to limited substitutes, certification needs and platform lock‑in, raising switching costs and lead‑time risks. Semiconductor scarcity (avg lead time ~24 weeks; allocation cuts up to 30% in 2024) and commodity swings (15–25% intra‑year) compressed margins. Regulatory constraints (REACH >22,000 substances; EU PFAS proposals) and recycled‑content rules shrink eligible sources, increasing supplier power.
| Metric | 2024 |
|---|---|
| Semiconductor lead time | ~24 weeks |
| Allocation cuts | up to 30% |
| Commodity price swings | 15–25% |
| REACH registered | >22,000 substances |
What is included in the product
Detailed Word Document
Concise Porter's Five Forces analysis for Grammer, identifying competitive rivalry, supplier and buyer power, substitute threats, and entry barriers—highlighting strategic levers to protect margins and market share.
Customizable Excel Spreadsheet
A concise, one-sheet Grammer Porter's Five Forces summary that surfaces key competitive pain points and recommended relief actions for faster, clearer strategic decisions. Editable pressure levels and an instant radar view let you test scenarios and deliver board-ready insights in seconds.
Customers Bargaining Power
Highly concentrated OEM customer base
Global auto and CV OEMs, concentrated among a few groups, buy components through professional procurement and RFQs that commonly exceed $100m per program, enabling aggressive supplier price competition. This concentration exerts intense price pressure and enforces strict service KPIs and warranty metrics. Success hinges on lowest total cost, demonstrable innovation, and a global footprint to match OEM sourcing locations.
Design-in and platform dependence
Seats and interior components are designed-in for multi-year platform cycles typically lasting 5–7 years, which stabilizes volumes but gives OEMs strong leverage to negotiate steep upfront price concessions of roughly 10–20% on program awards in 2024. Cost-down curves are often embedded across the program life, averaging about 3% annual unit-cost reduction targets. Switching mid-cycle is rare, so OEMs extract value early. Rigorous value engineering—often responsible for over half of realized cost savings—is essential to preserve supplier margins.
High quality and delivery requirements
Zero-defect expectations, frequent warranty backcharges and JIT delivery shift significant cost and risk to suppliers, increasing buyer leverage. OEM scorecards now typically allocate more than 40% weight to quality and logistics in 2024 sourcing decisions, steering preferred suppliers. This operational leverage extends buyer power beyond price into process control. Robust quality systems and top-tier logistics performance are strategic defenses suppliers must show.
Make-or-buy and vertical integration options
Some OEMs retain in-house seating or interior capabilities as a bargaining lever, a vertical-integration trend noted in 2024 that raises insourcing threat. That threat disciplines pricing and forces suppliers to commit to measurable innovation roadmaps. Grammer must differentiate through ergonomics, comfort features and cost competitiveness; co-development with OEMs reduces insource risk and secures share.
- OEM insourcing trend 2024: strategic lever
- Supplier response: pricing discipline, innovation commitments
- Grammer focus: ergonomics, comfort, cost
- Mitigation: co-development partnerships
Aftermarket and non-OEM niches
In commercial and off-road seating, aftermarket and specialty channels modestly dilute OEM bargaining power by providing alternative supply, though total volume remains noticeably smaller and buyers stay price-sensitive. Differentiated comfort and durability features in non-OEM seats can command premiums and reduce price elasticity. Maintaining a balanced channel mix—OEM, aftermarket, and specialty—improves negotiating leverage with fleet and dealer customers.
- aftermarket reduces oem leverage
- volume lower, price sensitivity high
- differentiation yields premium
- balanced channels = stronger negotiating position
OEM RFQs >$100m drive 10–20% upfront concessions and ~3% annual cost-downs
OEM concentration drives strong buyer power: program RFQs often exceed $100m, securing 10–20% upfront price concessions in 2024 and ~3% annual cost-down targets. OEM scorecards now allocate over 40% weight to quality and logistics, shifting warranty and JIT risk to suppliers. Insourcing pressure rose in 2024; aftermarket channels provide smaller volume alternatives that can command premiums if highly differentiated.
| Metric | 2024 Value |
|---|---|
| Typical RFQ size | >$100m |
| Upfront price concession | 10–20% |
| Annual cost-down target | ~3% |
| Scorecard weight on quality/logistics | >40% |
Same Document Delivered
Grammer Porter's Five Forces Analysis
This Grammer Porter Five Forces analysis delivers a concise assessment of industry rivalry, buyer and supplier power, threats of entry and substitution, and strategic implications for competitive positioning. This preview is the exact document you’ll receive after purchase—fully formatted and ready for use. No samples or placeholders—instant access to the final file upon payment.











