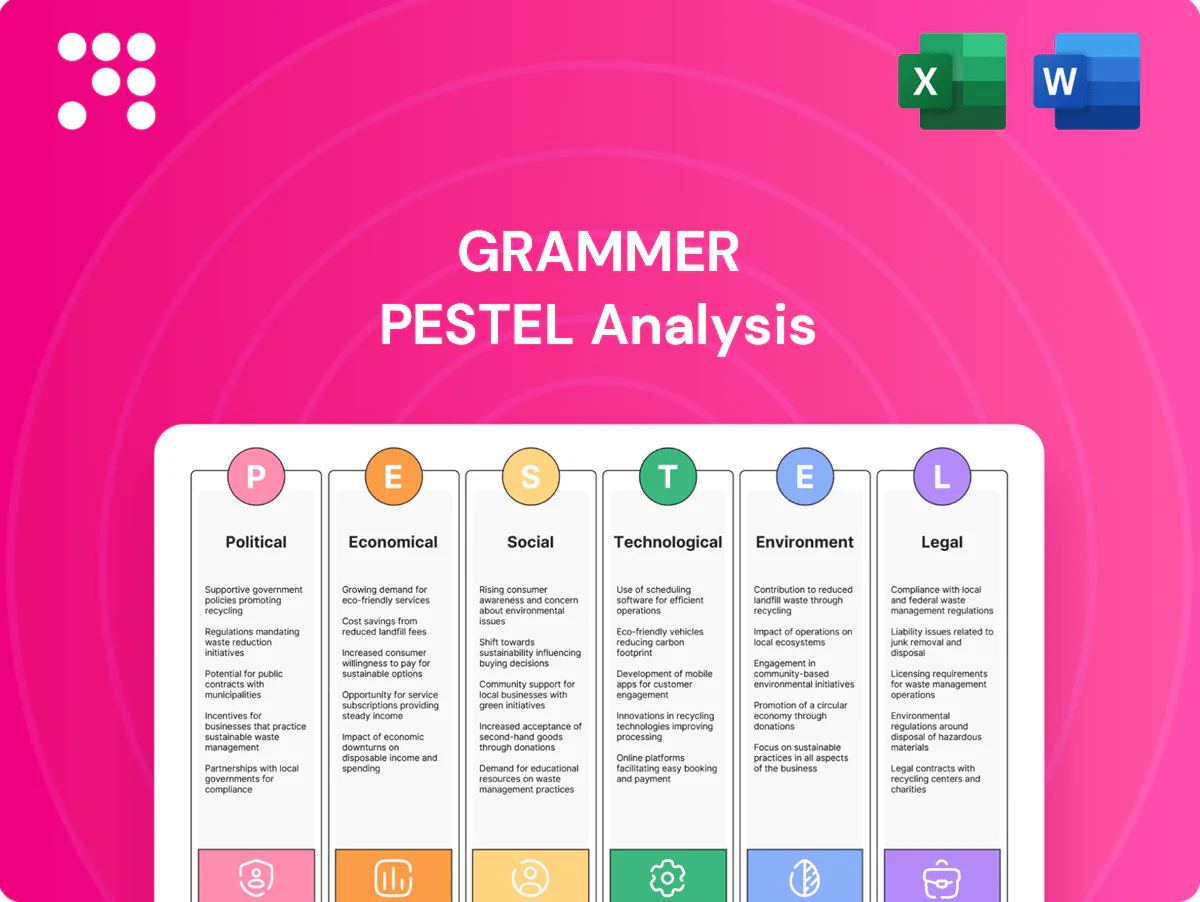
Grammer PESTLE Analysis

Make Smarter Strategic Decisions with a Complete PESTEL View
Discover how political shifts, economic cycles, social trends, technological advances, legal changes, and environmental pressures shape Grammer’s prospects in our concise PESTLE overview. This snapshot highlights key risks and opportunities for investors and strategists. For the full, actionable breakdown with data-driven insights and ready-to-use slides, purchase the complete PESTLE analysis now.
Political factors

Trade policy volatility
Auto supply chains face tariffs, sanctions and shifting agreements—US steel tariffs remain at 25%, the EU external tariff on passenger cars is 10% and semiconductor export controls introduced since 2022 have constrained component flows. Grammer’s global footprint must balance localized production with cross-border sourcing to manage cost volatility. Policy shifts in EU, US and China can change sourcing economics within months; proactive localization and dual-sourcing reduce exposure.
Industrial policy & subsidies
Government incentives shape OEM program volumes and seating demand: US Inflation Reduction Act directed about $369 billion to clean energy and EV tax credits up to $7,500, while EU and China offer fleet grants for buses and rail procurement. Accessing subsidies increasingly requires North American final assembly and battery content rules under current IRS guidance. Aligning with reindustrialization agendas (CHIPS Act ~$280 billion plus IRA) unlocks plant and R&D grants; failing eligibility risks margin dilution versus subsidized rivals.

Geopolitical supply risk
Conflicts and trade tensions since 2023 have disrupted foam chemicals, metals, electronics and key logistics corridors, contributing to regional port congestion and a reported 4–6% variance in lead times for electronics suppliers in 2024.
Sanctions and export controls expanded in 2023–24, constraining critical inputs and tooling for advanced semiconductors and specialty chemicals and forcing alternate sourcing at higher cost.
Political instability in supplier regions raised working capital needs via longer inventory days, so nearshoring and larger inventory buffers became strategic hedges for many manufacturers by 2024.

Public transport investment
Government spending on buses and rail—driven by programmes within the US $1.2 trillion Infrastructure Investment and Jobs Act (2021) and the EU NextGenerationEU €800 billion package—boosts multi-year seating and rolling-stock orders and gives manufacturers multi-year order visibility. Stimulus cycles lift procurement pipelines, while austerity or budget delays can stall tenders and freeze contracts. Targeted lobbying and consortium participation measurably improve award odds in competitive tenders; urban ridership recovered to roughly 80–90% of 2019 levels in many OECD cities by 2024.
- Funding: US IIJA $1.2T, EU NextGenerationEU €800B
- Ridership: ~80–90% of 2019 (2024)
- Risk: austerity/budget delays stall tenders
- Mitigation: lobbying, consortia increase award probability
Procurement localization
Public and OEM buyers increasingly mandate local production, with common local-content thresholds in procurement policies typically ranging 40–60% and enforced across key markets by 2024; this shifts award decisions toward locally produced suppliers.
- Impact: alters plant network and vendor lists, raising CapEx and qualification costs
- Cost: local sourcing can change unit cost structure and margins
- Benefit: meeting thresholds protects share in priority regions
- Risk: failure to localize risks exclusion from major platforms
Tariffs and IRA/CHIPS spur localization, raising costs and lead times 4–6%
Tariffs, sanctions and 2022–24 export controls raise component costs and add 4–6% lead-time variance for electronics (2024), forcing localization and dual-sourcing. IRA and CHIPS (~$649B combined) plus EU NextGenerationEU (€800B) shift volumes toward compliant local assembly; local-content thresholds 40–60% reshape supplier networks. Nearshoring and higher inventory raise working capital and CapEx but protect access to subsidized programs.
| Metric | Value (2024–25) |
|---|---|
| US tariffs on steel | 25% |
| EU car external tariff | 10% |
| IRA+CHIPS funding | ~$649B |
| Local-content thresholds | 40–60% |
| Lead-time variance (electronics) | 4–6% |
What is included in the product
 Detailed Word Document
Explores how external macro-environmental factors uniquely affect Grammer across Political, Economic, Social, Technological, Environmental, and Legal dimensions, with data-backed insights, scenario-led foresight, and practical recommendations to help executives, consultants, and investors identify risks and opportunities aligned to region and industry dynamics.

 Customizable Excel Spreadsheet
A concise, visually segmented Grammer PESTLE summary that speeds risk identification and strategic alignment in meetings, is easily editable for regional or product-specific notes, and is drop‑in ready for presentations or client reports.
Economic factors

Auto cycle sensitivity
Light vehicle and commercial vehicle production swings in 2024 drove interiors and seat volumes, amplifying Grammer’s revenue sensitivity to auto cycles. Grammer’s exposure across passenger cars, trucks, buses and off-road segments smooths but does not remove cyclicality. Platform wins and take‑rates in 2024 determined revenue resilience. Flexible cost structures helped protect margins during downturns.
Input cost inflation
Steel, aluminum, textiles, foams and plastics materially drive COGS — steel HRC averaged about $800/ton and LME aluminum near $2,200/ton in 2024; polymer and foam feedstock volatility added uneven margin pressure. Energy and logistics volatility (Baltic Dry Index swung >50% in 2024) increases unpredictability. Indexation clauses and rapid OEM repricing are vital to defend margins, while value engineering and material substitution offset spikes.

FX fluctuations
Revenue and costs span EUR, USD, CNY and MXN, with EUR trading near 1.08 USD in H1 2025, CNY around 7.2–7.3 per USD and MXN ~17.5–19 per USD, so currency mismatches materially affect profitability and pricing competitiveness. Natural hedging through regional sourcing reduces transactional exposure by aligning local revenues and costs. Financial hedges (forwards, options) are used to cover residual exposures on large programs.

Labor markets
- Skilled shortage: higher wages
- Automation: ±12% adoption
- Training: lowers scrap/rework
- Labor agreements: limit flexibility
Capex and program timing
Seat and interior programs require upfront tooling and R&D paid 18–36 months before SOP, tying cash to non-revenue assets; OEM schedule shifts therefore compress cash flow and lower asset utilization. Winning multi-year platforms (platform lifecycles typically 4–7 years) stabilizes revenue visibility, while disciplined ROI screens reduce risk of stranded assets.
- Upfront timing: 18–36 months pre‑SOP
- Platform life: 4–7 years revenue visibility
- Mitigation: strict ROI gates to avoid stranded capex
Tariffs and IRA/CHIPS spur localization, raising costs and lead times 4–6%
Auto production swings in 2024 drove Grammer seat/interior volumes, keeping revenue cyclic; platform wins and take‑rates proved decisive. Key input costs: HRC steel ~800 USD/ton, LME Al ~2,200 USD/ton; BDI volatility >50% in 2024 stressed logistics. FX: EUR ~1.08 USD (H1 2025), CNY ~7.2–7.3, MXN ~17.5–19; tight labor (US unemployment ~3.7%) raised wages and accelerated ~12% automation uptake.
| Metric | 2024/2025 |
|---|---|
| HRC steel | ~800 USD/ton |
| LME aluminum | ~2,200 USD/ton |
| BDI swing | >50% (2024) |
| EUR/USD | ~1.08 (H1 2025) |
| CNY/USD | ~7.2–7.3 |
| MXN/USD | ~17.5–19 |
| US unemployment | ~3.7% (2024) |
| Automation adoption | ~12% (2023–24) |
Same Document Delivered
Grammer PESTLE Analysis
The preview shown is the exact Grammer PESTLE Analysis document you’ll receive after purchase—fully formatted and ready to use. This screenshot reflects the real file you’re buying, with no placeholders or surprises. The content, layout, and structure visible here are identical to the downloadable final version. You’ll instantly get this exact, professionally structured document upon checkout.

Make Smarter Strategic Decisions with a Complete PESTEL View
Discover how political shifts, economic cycles, social trends, technological advances, legal changes, and environmental pressures shape Grammer’s prospects in our concise PESTLE overview. This snapshot highlights key risks and opportunities for investors and strategists. For the full, actionable breakdown with data-driven insights and ready-to-use slides, purchase the complete PESTLE analysis now.
Political factors
Trade policy volatility
Auto supply chains face tariffs, sanctions and shifting agreements—US steel tariffs remain at 25%, the EU external tariff on passenger cars is 10% and semiconductor export controls introduced since 2022 have constrained component flows. Grammer’s global footprint must balance localized production with cross-border sourcing to manage cost volatility. Policy shifts in EU, US and China can change sourcing economics within months; proactive localization and dual-sourcing reduce exposure.
Industrial policy & subsidies
Government incentives shape OEM program volumes and seating demand: US Inflation Reduction Act directed about $369 billion to clean energy and EV tax credits up to $7,500, while EU and China offer fleet grants for buses and rail procurement. Accessing subsidies increasingly requires North American final assembly and battery content rules under current IRS guidance. Aligning with reindustrialization agendas (CHIPS Act ~$280 billion plus IRA) unlocks plant and R&D grants; failing eligibility risks margin dilution versus subsidized rivals.
Geopolitical supply risk
Conflicts and trade tensions since 2023 have disrupted foam chemicals, metals, electronics and key logistics corridors, contributing to regional port congestion and a reported 4–6% variance in lead times for electronics suppliers in 2024.
Sanctions and export controls expanded in 2023–24, constraining critical inputs and tooling for advanced semiconductors and specialty chemicals and forcing alternate sourcing at higher cost.
Political instability in supplier regions raised working capital needs via longer inventory days, so nearshoring and larger inventory buffers became strategic hedges for many manufacturers by 2024.
Public transport investment
Government spending on buses and rail—driven by programmes within the US $1.2 trillion Infrastructure Investment and Jobs Act (2021) and the EU NextGenerationEU €800 billion package—boosts multi-year seating and rolling-stock orders and gives manufacturers multi-year order visibility. Stimulus cycles lift procurement pipelines, while austerity or budget delays can stall tenders and freeze contracts. Targeted lobbying and consortium participation measurably improve award odds in competitive tenders; urban ridership recovered to roughly 80–90% of 2019 levels in many OECD cities by 2024.
- Funding: US IIJA $1.2T, EU NextGenerationEU €800B
- Ridership: ~80–90% of 2019 (2024)
- Risk: austerity/budget delays stall tenders
- Mitigation: lobbying, consortia increase award probability
Procurement localization
Public and OEM buyers increasingly mandate local production, with common local-content thresholds in procurement policies typically ranging 40–60% and enforced across key markets by 2024; this shifts award decisions toward locally produced suppliers.
- Impact: alters plant network and vendor lists, raising CapEx and qualification costs
- Cost: local sourcing can change unit cost structure and margins
- Benefit: meeting thresholds protects share in priority regions
- Risk: failure to localize risks exclusion from major platforms
Tariffs and IRA/CHIPS spur localization, raising costs and lead times 4–6%
Tariffs, sanctions and 2022–24 export controls raise component costs and add 4–6% lead-time variance for electronics (2024), forcing localization and dual-sourcing. IRA and CHIPS (~$649B combined) plus EU NextGenerationEU (€800B) shift volumes toward compliant local assembly; local-content thresholds 40–60% reshape supplier networks. Nearshoring and higher inventory raise working capital and CapEx but protect access to subsidized programs.
| Metric | Value (2024–25) |
|---|---|
| US tariffs on steel | 25% |
| EU car external tariff | 10% |
| IRA+CHIPS funding | ~$649B |
| Local-content thresholds | 40–60% |
| Lead-time variance (electronics) | 4–6% |
What is included in the product
Detailed Word Document
Explores how external macro-environmental factors uniquely affect Grammer across Political, Economic, Social, Technological, Environmental, and Legal dimensions, with data-backed insights, scenario-led foresight, and practical recommendations to help executives, consultants, and investors identify risks and opportunities aligned to region and industry dynamics.
Customizable Excel Spreadsheet
A concise, visually segmented Grammer PESTLE summary that speeds risk identification and strategic alignment in meetings, is easily editable for regional or product-specific notes, and is drop‑in ready for presentations or client reports.
Economic factors
Auto cycle sensitivity
Light vehicle and commercial vehicle production swings in 2024 drove interiors and seat volumes, amplifying Grammer’s revenue sensitivity to auto cycles. Grammer’s exposure across passenger cars, trucks, buses and off-road segments smooths but does not remove cyclicality. Platform wins and take‑rates in 2024 determined revenue resilience. Flexible cost structures helped protect margins during downturns.
Input cost inflation
Steel, aluminum, textiles, foams and plastics materially drive COGS — steel HRC averaged about $800/ton and LME aluminum near $2,200/ton in 2024; polymer and foam feedstock volatility added uneven margin pressure. Energy and logistics volatility (Baltic Dry Index swung >50% in 2024) increases unpredictability. Indexation clauses and rapid OEM repricing are vital to defend margins, while value engineering and material substitution offset spikes.
FX fluctuations
Revenue and costs span EUR, USD, CNY and MXN, with EUR trading near 1.08 USD in H1 2025, CNY around 7.2–7.3 per USD and MXN ~17.5–19 per USD, so currency mismatches materially affect profitability and pricing competitiveness. Natural hedging through regional sourcing reduces transactional exposure by aligning local revenues and costs. Financial hedges (forwards, options) are used to cover residual exposures on large programs.
Labor markets
- Skilled shortage: higher wages
- Automation: ±12% adoption
- Training: lowers scrap/rework
- Labor agreements: limit flexibility
Capex and program timing
Seat and interior programs require upfront tooling and R&D paid 18–36 months before SOP, tying cash to non-revenue assets; OEM schedule shifts therefore compress cash flow and lower asset utilization. Winning multi-year platforms (platform lifecycles typically 4–7 years) stabilizes revenue visibility, while disciplined ROI screens reduce risk of stranded assets.
- Upfront timing: 18–36 months pre‑SOP
- Platform life: 4–7 years revenue visibility
- Mitigation: strict ROI gates to avoid stranded capex
Tariffs and IRA/CHIPS spur localization, raising costs and lead times 4–6%
Auto production swings in 2024 drove Grammer seat/interior volumes, keeping revenue cyclic; platform wins and take‑rates proved decisive. Key input costs: HRC steel ~800 USD/ton, LME Al ~2,200 USD/ton; BDI volatility >50% in 2024 stressed logistics. FX: EUR ~1.08 USD (H1 2025), CNY ~7.2–7.3, MXN ~17.5–19; tight labor (US unemployment ~3.7%) raised wages and accelerated ~12% automation uptake.
| Metric | 2024/2025 |
|---|---|
| HRC steel | ~800 USD/ton |
| LME aluminum | ~2,200 USD/ton |
| BDI swing | >50% (2024) |
| EUR/USD | ~1.08 (H1 2025) |
| CNY/USD | ~7.2–7.3 |
| MXN/USD | ~17.5–19 |
| US unemployment | ~3.7% (2024) |
| Automation adoption | ~12% (2023–24) |
Same Document Delivered
Grammer PESTLE Analysis
The preview shown is the exact Grammer PESTLE Analysis document you’ll receive after purchase—fully formatted and ready to use. This screenshot reflects the real file you’re buying, with no placeholders or surprises. The content, layout, and structure visible here are identical to the downloadable final version. You’ll instantly get this exact, professionally structured document upon checkout.
Description
Make Smarter Strategic Decisions with a Complete PESTEL View
Discover how political shifts, economic cycles, social trends, technological advances, legal changes, and environmental pressures shape Grammer’s prospects in our concise PESTLE overview. This snapshot highlights key risks and opportunities for investors and strategists. For the full, actionable breakdown with data-driven insights and ready-to-use slides, purchase the complete PESTLE analysis now.
Political factors
Trade policy volatility
Auto supply chains face tariffs, sanctions and shifting agreements—US steel tariffs remain at 25%, the EU external tariff on passenger cars is 10% and semiconductor export controls introduced since 2022 have constrained component flows. Grammer’s global footprint must balance localized production with cross-border sourcing to manage cost volatility. Policy shifts in EU, US and China can change sourcing economics within months; proactive localization and dual-sourcing reduce exposure.
Industrial policy & subsidies
Government incentives shape OEM program volumes and seating demand: US Inflation Reduction Act directed about $369 billion to clean energy and EV tax credits up to $7,500, while EU and China offer fleet grants for buses and rail procurement. Accessing subsidies increasingly requires North American final assembly and battery content rules under current IRS guidance. Aligning with reindustrialization agendas (CHIPS Act ~$280 billion plus IRA) unlocks plant and R&D grants; failing eligibility risks margin dilution versus subsidized rivals.
Geopolitical supply risk
Conflicts and trade tensions since 2023 have disrupted foam chemicals, metals, electronics and key logistics corridors, contributing to regional port congestion and a reported 4–6% variance in lead times for electronics suppliers in 2024.
Sanctions and export controls expanded in 2023–24, constraining critical inputs and tooling for advanced semiconductors and specialty chemicals and forcing alternate sourcing at higher cost.
Political instability in supplier regions raised working capital needs via longer inventory days, so nearshoring and larger inventory buffers became strategic hedges for many manufacturers by 2024.
Public transport investment
Government spending on buses and rail—driven by programmes within the US $1.2 trillion Infrastructure Investment and Jobs Act (2021) and the EU NextGenerationEU €800 billion package—boosts multi-year seating and rolling-stock orders and gives manufacturers multi-year order visibility. Stimulus cycles lift procurement pipelines, while austerity or budget delays can stall tenders and freeze contracts. Targeted lobbying and consortium participation measurably improve award odds in competitive tenders; urban ridership recovered to roughly 80–90% of 2019 levels in many OECD cities by 2024.
- Funding: US IIJA $1.2T, EU NextGenerationEU €800B
- Ridership: ~80–90% of 2019 (2024)
- Risk: austerity/budget delays stall tenders
- Mitigation: lobbying, consortia increase award probability
Procurement localization
Public and OEM buyers increasingly mandate local production, with common local-content thresholds in procurement policies typically ranging 40–60% and enforced across key markets by 2024; this shifts award decisions toward locally produced suppliers.
- Impact: alters plant network and vendor lists, raising CapEx and qualification costs
- Cost: local sourcing can change unit cost structure and margins
- Benefit: meeting thresholds protects share in priority regions
- Risk: failure to localize risks exclusion from major platforms
Tariffs and IRA/CHIPS spur localization, raising costs and lead times 4–6%
Tariffs, sanctions and 2022–24 export controls raise component costs and add 4–6% lead-time variance for electronics (2024), forcing localization and dual-sourcing. IRA and CHIPS (~$649B combined) plus EU NextGenerationEU (€800B) shift volumes toward compliant local assembly; local-content thresholds 40–60% reshape supplier networks. Nearshoring and higher inventory raise working capital and CapEx but protect access to subsidized programs.
| Metric | Value (2024–25) |
|---|---|
| US tariffs on steel | 25% |
| EU car external tariff | 10% |
| IRA+CHIPS funding | ~$649B |
| Local-content thresholds | 40–60% |
| Lead-time variance (electronics) | 4–6% |
What is included in the product
Detailed Word Document
Explores how external macro-environmental factors uniquely affect Grammer across Political, Economic, Social, Technological, Environmental, and Legal dimensions, with data-backed insights, scenario-led foresight, and practical recommendations to help executives, consultants, and investors identify risks and opportunities aligned to region and industry dynamics.
Customizable Excel Spreadsheet
A concise, visually segmented Grammer PESTLE summary that speeds risk identification and strategic alignment in meetings, is easily editable for regional or product-specific notes, and is drop‑in ready for presentations or client reports.
Economic factors
Auto cycle sensitivity
Light vehicle and commercial vehicle production swings in 2024 drove interiors and seat volumes, amplifying Grammer’s revenue sensitivity to auto cycles. Grammer’s exposure across passenger cars, trucks, buses and off-road segments smooths but does not remove cyclicality. Platform wins and take‑rates in 2024 determined revenue resilience. Flexible cost structures helped protect margins during downturns.
Input cost inflation
Steel, aluminum, textiles, foams and plastics materially drive COGS — steel HRC averaged about $800/ton and LME aluminum near $2,200/ton in 2024; polymer and foam feedstock volatility added uneven margin pressure. Energy and logistics volatility (Baltic Dry Index swung >50% in 2024) increases unpredictability. Indexation clauses and rapid OEM repricing are vital to defend margins, while value engineering and material substitution offset spikes.
FX fluctuations
Revenue and costs span EUR, USD, CNY and MXN, with EUR trading near 1.08 USD in H1 2025, CNY around 7.2–7.3 per USD and MXN ~17.5–19 per USD, so currency mismatches materially affect profitability and pricing competitiveness. Natural hedging through regional sourcing reduces transactional exposure by aligning local revenues and costs. Financial hedges (forwards, options) are used to cover residual exposures on large programs.
Labor markets
- Skilled shortage: higher wages
- Automation: ±12% adoption
- Training: lowers scrap/rework
- Labor agreements: limit flexibility
Capex and program timing
Seat and interior programs require upfront tooling and R&D paid 18–36 months before SOP, tying cash to non-revenue assets; OEM schedule shifts therefore compress cash flow and lower asset utilization. Winning multi-year platforms (platform lifecycles typically 4–7 years) stabilizes revenue visibility, while disciplined ROI screens reduce risk of stranded assets.
- Upfront timing: 18–36 months pre‑SOP
- Platform life: 4–7 years revenue visibility
- Mitigation: strict ROI gates to avoid stranded capex
Tariffs and IRA/CHIPS spur localization, raising costs and lead times 4–6%
Auto production swings in 2024 drove Grammer seat/interior volumes, keeping revenue cyclic; platform wins and take‑rates proved decisive. Key input costs: HRC steel ~800 USD/ton, LME Al ~2,200 USD/ton; BDI volatility >50% in 2024 stressed logistics. FX: EUR ~1.08 USD (H1 2025), CNY ~7.2–7.3, MXN ~17.5–19; tight labor (US unemployment ~3.7%) raised wages and accelerated ~12% automation uptake.
| Metric | 2024/2025 |
|---|---|
| HRC steel | ~800 USD/ton |
| LME aluminum | ~2,200 USD/ton |
| BDI swing | >50% (2024) |
| EUR/USD | ~1.08 (H1 2025) |
| CNY/USD | ~7.2–7.3 |
| MXN/USD | ~17.5–19 |
| US unemployment | ~3.7% (2024) |
| Automation adoption | ~12% (2023–24) |
Same Document Delivered
Grammer PESTLE Analysis
The preview shown is the exact Grammer PESTLE Analysis document you’ll receive after purchase—fully formatted and ready to use. This screenshot reflects the real file you’re buying, with no placeholders or surprises. The content, layout, and structure visible here are identical to the downloadable final version. You’ll instantly get this exact, professionally structured document upon checkout.











