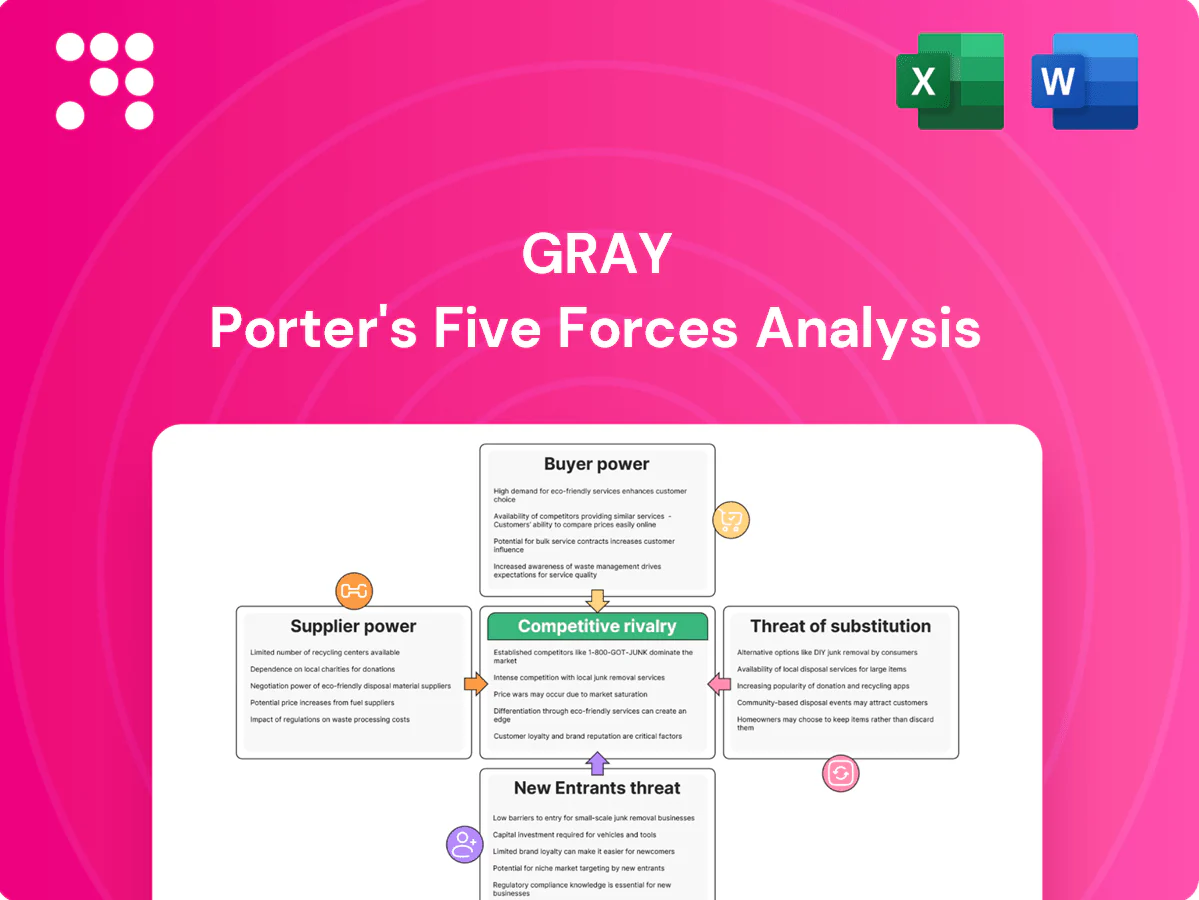
Gray Porter's Five Forces Analysis

Elevate Your Analysis with the Complete Porter's Five Forces Analysis
Gray’s Porter’s Five Forces snapshot highlights competitive rivalry, supplier and buyer power, barriers to entry, and substitute risks shaping its market position. This concise view surfaces key pressures but omits granular ratings and evidence. The full Porter’s Five Forces Analysis unlocks force-by-force scores, visuals, and strategic implications. Purchase the complete report for a consultant-grade, actionable breakdown tailored to Gray.
Suppliers Bargaining Power

Specialty subcontractors' leverage
Gray depends on niche trades—process piping, refrigeration, clean-room installers—often scarce regionally, and a 2024 industry survey found 52% of contractors reported difficulty sourcing such specialty subs. Limited qualified capacity gives those subs leverage on price and schedules, pushing premium bids and lead-time extensions. Prequalification and multiple sub-panels reduce but do not remove scarcity pressure, while long-term partnerships secure priority during peak cycles.
OEM equipment and automation vendors
Process equipment, conveyors and automation integrators are often single- or few-source in food & beverage and advanced manufacturing, driving supplier power as the global industrial automation market exceeded $210 billion in 2024. Vendor specifications lock in brands and raise switching costs; early design-build engagement trades price leverage for schedule certainty, while volume bundling across projects can partially offset OEM power.

Commodity materials volatility
Steel, concrete and electrical gear saw price swings up to 30–40% and lead times jump from typical 4–6 weeks to 12–20 weeks in recent supply shocks (2022–24); escalation clauses and hedging cut headline volatility but left residual exposure during peak disruptions. Preferred supplier agreements improved allocation and reduced delivery variance, while design optimization/value engineering enabled substitutions around constrained items, trimming material cost exposure by double-digit percentages in tracked projects.

Skilled labor and professional talent
- Short supply: ~70% firms report hiring difficulty (2024)
- Wage pressure: specialized roles +6–8% YoY (2024)
- Mitigation: in-house teams reduce consultant spend
- Resilience: training pipelines, geographic staffing
Logistics and regional availability
Distributed project sites drive wide variability in supplier pools and freight costs, raising supplier bargaining power where local capacity is thin; remote or regulated GMP and cold-chain sites in 2024 further narrow qualified suppliers and increase qualification lead times and logistics premiums.
- Strategic sourcing and national accounts standardize terms and broaden coverage
- Local joint ventures reduce gaps in thin supplier bases
- Regulated sites raise supplier switching costs
Supply pressure: 52% sub scarcity, 30–40% material swings
Supplier power is high: 52% of contractors (2024) report scarce specialty subs, automation OEMs in a >$210B market exert brand lock-in, and commodity shocks produced 30–40% material price swings with lead times up to 12–20 weeks. Skilled labor tightness (≈70% firms reporting hiring difficulty; wage rise ~6–8% YoY) raises switching costs; long-term contracts and national accounts partially mitigate pressure.
| Metric | 2024 |
|---|---|
| Specialty sub scarcity | 52% |
| Automation market | >$210B |
| Material price swings | 30–40% |
| Lead times (materials) | 12–20w |
| Hiring difficulty | ≈70% |
| Wage growth (specialized) | 6–8% YoY |
What is included in the product
 Detailed Word Document
Analyzes competitive forces impacting Gray—rivalry, buyer and supplier power, threats of new entrants and substitutes—identifying disruptive threats, pricing influence, entry barriers, and strategic levers; fully editable for use in investor materials, business plans, and internal strategy decks.

 Customizable Excel Spreadsheet
A single-sheet Gray-Porter Five Forces summary that pinpoints competitive pain points and actionable levers to relieve them, enabling fast strategic decisions. Quickly model force shifts, visualize impacts, and export clean charts for pitch decks or boardroom slides.
Customers Bargaining Power

Large enterprise procurement discipline
Clients in F&B, manufacturing and distribution increasingly use formal RFPs, competitive bidding and benchmarking; large accounts often represent 20–40% of vendor revenue, giving buyers leverage to demand tougher price, schedule and warranty terms. Framework agreements commonly compress margins by roughly 5–15% while raising volume visibility. Suppliers defend value with differentiated performance metrics—OTD, quality ppm and TCO—to justify premiums over lowest bid.
High project value and professional buyers
Projects are multimillion-dollar (often >$10M) and managed by experienced owner reps and EPC managers, raising buyer sophistication and leverage. Professional buyers drive price transparency and rigorous scope definitions, increasing competitive pressure. They frequently unbundle scopes to invite specialist bidders, while offering integrated design-build solutions helps preserve scope control and margin integrity.

Switching costs from integration
Design-build integration raises mid-project switching costs through complex knowledge transfer and interface risk, making midstream handoffs costly and error-prone. Early-phase exits remain feasible, so demonstrating upfront value and milestones in 2024 bids is critical. Repeat business and master service agreements deepen entrenchment, while strong commissioning and measurable OEE gains post-delivery cement client loyalty.

Schedule and compliance sensitivity
Schedule reliability outranks lowest cost for buyers because speed-to-market plus FDA/USDA compliance and GMP adherence directly affect launch timing and revenue; the FDA 510(k) median decision time was 153 days (FY2023), underscoring calendar sensitivity. Providers with documented regulatory track records strengthen pricing power, but liquidated damages clauses continue to anchor buyer leverage.
- speed-to-market: launch timing drives revenue
- regulatory track record: raises negotiating power
- liquidated damages: preserves buyer leverage
Multi-site rollout dynamics
As multi-site rollouts expand (plants, DCs), buyers favor partners who can replicate standardized designs quickly, with 2024 surveys showing roughly 60% of large enterprises preferring single-vendor replication to speed deployment and cut variance.
Standardized design kits reduce buyer inclination to fragment awards; volume discounts emerge but are tied to continuous improvement clauses and KPIs, with early-site performance capturing over half of subsequent share-of-wallet in many rollouts.
- Replication speed: favors single partners
- Standard kits: lower fragmentation
- Volume discounts: contingent on CI
- Early-site KPIs: drive future awards
Buyer leverage: accounts 20–40%; frameworks trim 5–15%
Buyers hold strong leverage: large accounts often constitute 20–40% of vendor revenue and framework agreements compress margins by ~5–15%, driving competitive RFPs and aggressive pricing. 2024 surveys show ~60% of large enterprises prefer single-vendor replication, favoring partners that deliver speed and standardized kits. Regulatory timing matters—FDA 510(k) median decision time was 153 days (FY2023), elevating schedule premium.
| Metric | Value |
|---|---|
| Account share | 20–40% |
| Margin compression (frameworks) | 5–15% |
| Single-vendor preference (2024) | ~60% |
| FDA 510(k) median (FY2023) | 153 days |
Preview Before You Purchase
Gray Porter's Five Forces Analysis
This preview shows the exact Gray Porter's Five Forces Analysis you'll receive immediately after purchase—no placeholders or sample pages. The document is fully formatted, comprehensive, and ready for download and use the moment you buy. You're getting the final deliverable as shown.

Elevate Your Analysis with the Complete Porter's Five Forces Analysis
Gray’s Porter’s Five Forces snapshot highlights competitive rivalry, supplier and buyer power, barriers to entry, and substitute risks shaping its market position. This concise view surfaces key pressures but omits granular ratings and evidence. The full Porter’s Five Forces Analysis unlocks force-by-force scores, visuals, and strategic implications. Purchase the complete report for a consultant-grade, actionable breakdown tailored to Gray.
Suppliers Bargaining Power
Specialty subcontractors' leverage
Gray depends on niche trades—process piping, refrigeration, clean-room installers—often scarce regionally, and a 2024 industry survey found 52% of contractors reported difficulty sourcing such specialty subs. Limited qualified capacity gives those subs leverage on price and schedules, pushing premium bids and lead-time extensions. Prequalification and multiple sub-panels reduce but do not remove scarcity pressure, while long-term partnerships secure priority during peak cycles.
OEM equipment and automation vendors
Process equipment, conveyors and automation integrators are often single- or few-source in food & beverage and advanced manufacturing, driving supplier power as the global industrial automation market exceeded $210 billion in 2024. Vendor specifications lock in brands and raise switching costs; early design-build engagement trades price leverage for schedule certainty, while volume bundling across projects can partially offset OEM power.
Commodity materials volatility
Steel, concrete and electrical gear saw price swings up to 30–40% and lead times jump from typical 4–6 weeks to 12–20 weeks in recent supply shocks (2022–24); escalation clauses and hedging cut headline volatility but left residual exposure during peak disruptions. Preferred supplier agreements improved allocation and reduced delivery variance, while design optimization/value engineering enabled substitutions around constrained items, trimming material cost exposure by double-digit percentages in tracked projects.
Skilled labor and professional talent
- Short supply: ~70% firms report hiring difficulty (2024)
- Wage pressure: specialized roles +6–8% YoY (2024)
- Mitigation: in-house teams reduce consultant spend
- Resilience: training pipelines, geographic staffing
Logistics and regional availability
Distributed project sites drive wide variability in supplier pools and freight costs, raising supplier bargaining power where local capacity is thin; remote or regulated GMP and cold-chain sites in 2024 further narrow qualified suppliers and increase qualification lead times and logistics premiums.
- Strategic sourcing and national accounts standardize terms and broaden coverage
- Local joint ventures reduce gaps in thin supplier bases
- Regulated sites raise supplier switching costs
Supply pressure: 52% sub scarcity, 30–40% material swings
Supplier power is high: 52% of contractors (2024) report scarce specialty subs, automation OEMs in a >$210B market exert brand lock-in, and commodity shocks produced 30–40% material price swings with lead times up to 12–20 weeks. Skilled labor tightness (≈70% firms reporting hiring difficulty; wage rise ~6–8% YoY) raises switching costs; long-term contracts and national accounts partially mitigate pressure.
| Metric | 2024 |
|---|---|
| Specialty sub scarcity | 52% |
| Automation market | >$210B |
| Material price swings | 30–40% |
| Lead times (materials) | 12–20w |
| Hiring difficulty | ≈70% |
| Wage growth (specialized) | 6–8% YoY |
What is included in the product
Detailed Word Document
Analyzes competitive forces impacting Gray—rivalry, buyer and supplier power, threats of new entrants and substitutes—identifying disruptive threats, pricing influence, entry barriers, and strategic levers; fully editable for use in investor materials, business plans, and internal strategy decks.
Customizable Excel Spreadsheet
A single-sheet Gray-Porter Five Forces summary that pinpoints competitive pain points and actionable levers to relieve them, enabling fast strategic decisions. Quickly model force shifts, visualize impacts, and export clean charts for pitch decks or boardroom slides.
Customers Bargaining Power
Large enterprise procurement discipline
Clients in F&B, manufacturing and distribution increasingly use formal RFPs, competitive bidding and benchmarking; large accounts often represent 20–40% of vendor revenue, giving buyers leverage to demand tougher price, schedule and warranty terms. Framework agreements commonly compress margins by roughly 5–15% while raising volume visibility. Suppliers defend value with differentiated performance metrics—OTD, quality ppm and TCO—to justify premiums over lowest bid.
High project value and professional buyers
Projects are multimillion-dollar (often >$10M) and managed by experienced owner reps and EPC managers, raising buyer sophistication and leverage. Professional buyers drive price transparency and rigorous scope definitions, increasing competitive pressure. They frequently unbundle scopes to invite specialist bidders, while offering integrated design-build solutions helps preserve scope control and margin integrity.
Switching costs from integration
Design-build integration raises mid-project switching costs through complex knowledge transfer and interface risk, making midstream handoffs costly and error-prone. Early-phase exits remain feasible, so demonstrating upfront value and milestones in 2024 bids is critical. Repeat business and master service agreements deepen entrenchment, while strong commissioning and measurable OEE gains post-delivery cement client loyalty.
Schedule and compliance sensitivity
Schedule reliability outranks lowest cost for buyers because speed-to-market plus FDA/USDA compliance and GMP adherence directly affect launch timing and revenue; the FDA 510(k) median decision time was 153 days (FY2023), underscoring calendar sensitivity. Providers with documented regulatory track records strengthen pricing power, but liquidated damages clauses continue to anchor buyer leverage.
- speed-to-market: launch timing drives revenue
- regulatory track record: raises negotiating power
- liquidated damages: preserves buyer leverage
Multi-site rollout dynamics
As multi-site rollouts expand (plants, DCs), buyers favor partners who can replicate standardized designs quickly, with 2024 surveys showing roughly 60% of large enterprises preferring single-vendor replication to speed deployment and cut variance.
Standardized design kits reduce buyer inclination to fragment awards; volume discounts emerge but are tied to continuous improvement clauses and KPIs, with early-site performance capturing over half of subsequent share-of-wallet in many rollouts.
- Replication speed: favors single partners
- Standard kits: lower fragmentation
- Volume discounts: contingent on CI
- Early-site KPIs: drive future awards
Buyer leverage: accounts 20–40%; frameworks trim 5–15%
Buyers hold strong leverage: large accounts often constitute 20–40% of vendor revenue and framework agreements compress margins by ~5–15%, driving competitive RFPs and aggressive pricing. 2024 surveys show ~60% of large enterprises prefer single-vendor replication, favoring partners that deliver speed and standardized kits. Regulatory timing matters—FDA 510(k) median decision time was 153 days (FY2023), elevating schedule premium.
| Metric | Value |
|---|---|
| Account share | 20–40% |
| Margin compression (frameworks) | 5–15% |
| Single-vendor preference (2024) | ~60% |
| FDA 510(k) median (FY2023) | 153 days |
Preview Before You Purchase
Gray Porter's Five Forces Analysis
This preview shows the exact Gray Porter's Five Forces Analysis you'll receive immediately after purchase—no placeholders or sample pages. The document is fully formatted, comprehensive, and ready for download and use the moment you buy. You're getting the final deliverable as shown.
Description
Elevate Your Analysis with the Complete Porter's Five Forces Analysis
Gray’s Porter’s Five Forces snapshot highlights competitive rivalry, supplier and buyer power, barriers to entry, and substitute risks shaping its market position. This concise view surfaces key pressures but omits granular ratings and evidence. The full Porter’s Five Forces Analysis unlocks force-by-force scores, visuals, and strategic implications. Purchase the complete report for a consultant-grade, actionable breakdown tailored to Gray.
Suppliers Bargaining Power
Specialty subcontractors' leverage
Gray depends on niche trades—process piping, refrigeration, clean-room installers—often scarce regionally, and a 2024 industry survey found 52% of contractors reported difficulty sourcing such specialty subs. Limited qualified capacity gives those subs leverage on price and schedules, pushing premium bids and lead-time extensions. Prequalification and multiple sub-panels reduce but do not remove scarcity pressure, while long-term partnerships secure priority during peak cycles.
OEM equipment and automation vendors
Process equipment, conveyors and automation integrators are often single- or few-source in food & beverage and advanced manufacturing, driving supplier power as the global industrial automation market exceeded $210 billion in 2024. Vendor specifications lock in brands and raise switching costs; early design-build engagement trades price leverage for schedule certainty, while volume bundling across projects can partially offset OEM power.
Commodity materials volatility
Steel, concrete and electrical gear saw price swings up to 30–40% and lead times jump from typical 4–6 weeks to 12–20 weeks in recent supply shocks (2022–24); escalation clauses and hedging cut headline volatility but left residual exposure during peak disruptions. Preferred supplier agreements improved allocation and reduced delivery variance, while design optimization/value engineering enabled substitutions around constrained items, trimming material cost exposure by double-digit percentages in tracked projects.
Skilled labor and professional talent
- Short supply: ~70% firms report hiring difficulty (2024)
- Wage pressure: specialized roles +6–8% YoY (2024)
- Mitigation: in-house teams reduce consultant spend
- Resilience: training pipelines, geographic staffing
Logistics and regional availability
Distributed project sites drive wide variability in supplier pools and freight costs, raising supplier bargaining power where local capacity is thin; remote or regulated GMP and cold-chain sites in 2024 further narrow qualified suppliers and increase qualification lead times and logistics premiums.
- Strategic sourcing and national accounts standardize terms and broaden coverage
- Local joint ventures reduce gaps in thin supplier bases
- Regulated sites raise supplier switching costs
Supply pressure: 52% sub scarcity, 30–40% material swings
Supplier power is high: 52% of contractors (2024) report scarce specialty subs, automation OEMs in a >$210B market exert brand lock-in, and commodity shocks produced 30–40% material price swings with lead times up to 12–20 weeks. Skilled labor tightness (≈70% firms reporting hiring difficulty; wage rise ~6–8% YoY) raises switching costs; long-term contracts and national accounts partially mitigate pressure.
| Metric | 2024 |
|---|---|
| Specialty sub scarcity | 52% |
| Automation market | >$210B |
| Material price swings | 30–40% |
| Lead times (materials) | 12–20w |
| Hiring difficulty | ≈70% |
| Wage growth (specialized) | 6–8% YoY |
What is included in the product
Detailed Word Document
Analyzes competitive forces impacting Gray—rivalry, buyer and supplier power, threats of new entrants and substitutes—identifying disruptive threats, pricing influence, entry barriers, and strategic levers; fully editable for use in investor materials, business plans, and internal strategy decks.
Customizable Excel Spreadsheet
A single-sheet Gray-Porter Five Forces summary that pinpoints competitive pain points and actionable levers to relieve them, enabling fast strategic decisions. Quickly model force shifts, visualize impacts, and export clean charts for pitch decks or boardroom slides.
Customers Bargaining Power
Large enterprise procurement discipline
Clients in F&B, manufacturing and distribution increasingly use formal RFPs, competitive bidding and benchmarking; large accounts often represent 20–40% of vendor revenue, giving buyers leverage to demand tougher price, schedule and warranty terms. Framework agreements commonly compress margins by roughly 5–15% while raising volume visibility. Suppliers defend value with differentiated performance metrics—OTD, quality ppm and TCO—to justify premiums over lowest bid.
High project value and professional buyers
Projects are multimillion-dollar (often >$10M) and managed by experienced owner reps and EPC managers, raising buyer sophistication and leverage. Professional buyers drive price transparency and rigorous scope definitions, increasing competitive pressure. They frequently unbundle scopes to invite specialist bidders, while offering integrated design-build solutions helps preserve scope control and margin integrity.
Switching costs from integration
Design-build integration raises mid-project switching costs through complex knowledge transfer and interface risk, making midstream handoffs costly and error-prone. Early-phase exits remain feasible, so demonstrating upfront value and milestones in 2024 bids is critical. Repeat business and master service agreements deepen entrenchment, while strong commissioning and measurable OEE gains post-delivery cement client loyalty.
Schedule and compliance sensitivity
Schedule reliability outranks lowest cost for buyers because speed-to-market plus FDA/USDA compliance and GMP adherence directly affect launch timing and revenue; the FDA 510(k) median decision time was 153 days (FY2023), underscoring calendar sensitivity. Providers with documented regulatory track records strengthen pricing power, but liquidated damages clauses continue to anchor buyer leverage.
- speed-to-market: launch timing drives revenue
- regulatory track record: raises negotiating power
- liquidated damages: preserves buyer leverage
Multi-site rollout dynamics
As multi-site rollouts expand (plants, DCs), buyers favor partners who can replicate standardized designs quickly, with 2024 surveys showing roughly 60% of large enterprises preferring single-vendor replication to speed deployment and cut variance.
Standardized design kits reduce buyer inclination to fragment awards; volume discounts emerge but are tied to continuous improvement clauses and KPIs, with early-site performance capturing over half of subsequent share-of-wallet in many rollouts.
- Replication speed: favors single partners
- Standard kits: lower fragmentation
- Volume discounts: contingent on CI
- Early-site KPIs: drive future awards
Buyer leverage: accounts 20–40%; frameworks trim 5–15%
Buyers hold strong leverage: large accounts often constitute 20–40% of vendor revenue and framework agreements compress margins by ~5–15%, driving competitive RFPs and aggressive pricing. 2024 surveys show ~60% of large enterprises prefer single-vendor replication, favoring partners that deliver speed and standardized kits. Regulatory timing matters—FDA 510(k) median decision time was 153 days (FY2023), elevating schedule premium.
| Metric | Value |
|---|---|
| Account share | 20–40% |
| Margin compression (frameworks) | 5–15% |
| Single-vendor preference (2024) | ~60% |
| FDA 510(k) median (FY2023) | 153 days |
Preview Before You Purchase
Gray Porter's Five Forces Analysis
This preview shows the exact Gray Porter's Five Forces Analysis you'll receive immediately after purchase—no placeholders or sample pages. The document is fully formatted, comprehensive, and ready for download and use the moment you buy. You're getting the final deliverable as shown.











