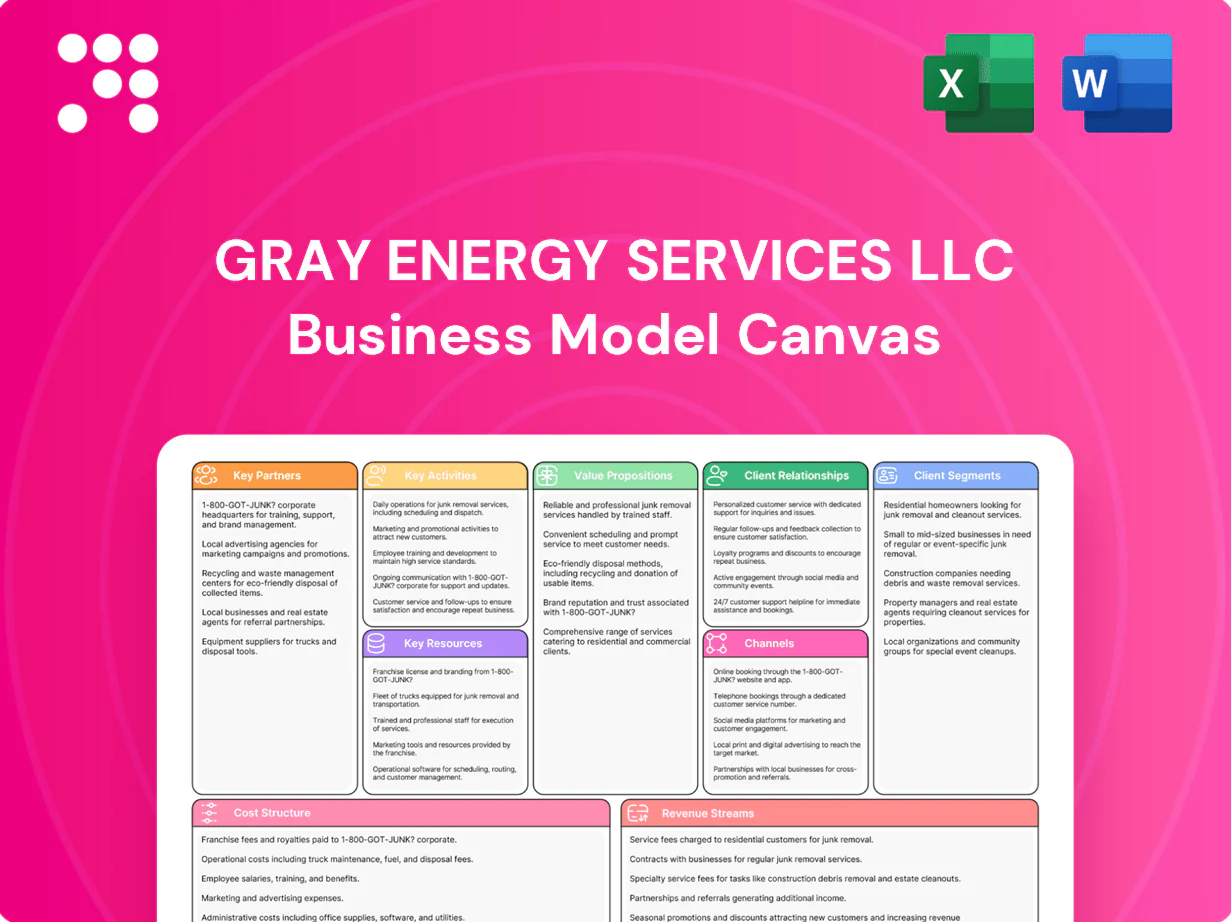
Gray Energy Services LLC Business Model Canvas

Concise Business Model Canvas: value props, customer segments & revenue levers
Discover the strategic engine behind Gray Energy Services LLC with our concise Business Model Canvas preview. This snapshot outlines key value propositions, customer segments, and revenue levers. Purchase the full canvas to access detailed, editable Word and Excel templates for immediate strategic use.
Partnerships

E&P operator alliances
Collaborative alliances with upstream producers drive continuous improvement in production outcomes and responsiveness, supporting operators in a U.S. crude production environment of about 13.0 million b/d in 2024 (EIA). Joint planning aligns well interventions, flowback schedules and equipment deployment to reduce downtime. Long-term MSAs simplify pricing and mobilization while shared KPIs (eg target >90% uptime) deepen operational integration and mutual accountability for throughput.
Equipment OEMs and technology providers
Partnerships with compressor, artificial lift, measurement, and remote-monitoring OEMs (2024 leaders include Schlumberger, Halliburton, Baker Hughes) secure access to advanced hardware and firmware upgrades. Co-development drives fit-for-purpose enhancements for harsh field conditions, shortening deployment cycles. Preferred pricing and priority spares lower repair lead times and operational risk. OEM certification and frontline training elevate crew technical competency.

Chemical and consumables suppliers
Reliable supply of production chemicals, sand management media and filtration drives optimized flow; in 2024 industry reports link consistent chemical delivery to measurable uptime improvements across US basins. Vendor-managed inventory programs cut field stockouts and emergency shipments, lowering logistics spend and service interruptions. Joint field trials validate basin-specific performance and scale-up metrics. Integrated procurement reduced total cost of ownership by double-digit percentages in comparable 2024 contracts.

Logistics, maintenance, and fabrication partners
Heavy-haul, rig-up, and field service partners enable rapid mobilization across basins within 24–72 hours; regional fabrication shops deliver customized skids, manifolds and automation enclosures with typical lead times of 2–6 weeks; third-party maintenance augments peak capacity by up to 30% and coordinated scheduling can compress cycle times by 15–25%.
- mobilization: 24–72 hours
- fabrication lead time: 2–6 weeks
- peak capacity boost: up to 30%
- cycle time reduction: 15–25%
Data, SCADA, and analytics collaborators
Integrations with SCADA, edge devices, and cloud analytics unlock real-time optimization, enabling predictive control and double-digit efficiency gains; data-sharing agreements drive predictive maintenance that can cut unplanned downtime by up to 40% and lower maintenance costs by as much as 25% (industry reports, 2024). Cybersecurity partners harden field connectivity against OT threats, while APIs streamline reporting into clients’ systems of record, reducing manual reporting time by up to 70%.
- SCADA/edge/cloud integrations: real-time optimization
- Data-sharing: predictive maintenance — up to 40% downtime reduction
- Cybersecurity: OT hardening, incident risk reduction
- APIs: automate reporting, cut manual time ~70%
Alliances enable predictive maintenance: up to 40% less downtime
Alliances with operators and OEMs secure tech upgrades and faster mobilization, supporting US crude ~13.0 million b/d (EIA 2024). Vendor-managed inventory and logistics reduce stockouts and cut TCO by double digits in 2024 contracts. SCADA/cloud and cybersecurity partnerships enable predictive maintenance (up to 40% less unplanned downtime) and ~70% reporting time savings.
| Partnership | KPI/Value | 2024 Metric |
|---|---|---|
| Operators/OEMs | Uptime | >90% |
| Supply/VMI | TCO reduction | Double-digit % |
| Data/Cyber | Downtime/reporting | -40% / -70% |
What is included in the product
 Detailed Word Document
A concise, pre-written Business Model Canvas for Gray Energy Services LLC outlining customer segments, value propositions, channels, revenue streams, cost structure, key activities, resources, partners, and customer relationships, reflecting real-world operations and strategic plans. Ideal for investor presentations and internal strategy, it includes competitive advantages and linked SWOT insights to support decision-making.

 Customizable Excel Spreadsheet
High-level view of Gray Energy Services LLC's business model with editable cells to quickly identify operational pain points and value drivers, enabling teams to streamline service delivery, reduce downtime, and prioritize cost-saving investments.
Activities

Production optimization and well interventions
Field diagnostics pinpoint flow, pressure and artificial-lift bottlenecks using downhole sensors and surface gauges. Onsite adjustments and targeted interventions in 2024 pilot projects delivered a mean 12% throughput uplift. Standardized procedures cut intervention downtime by about 35%. Results are validated with before-and-after production logs and meter data.
Flowback, testing, and sand management
Managed flowback protects reservoirs and surface equipment by controlling initial effluent rates, often limiting returns to under 100 bbl/day in early stages to avoid formation damage. Well testing quantifies deliverability and informs choke strategy, with standardized drawdown tests used to set choke sizes and forecast IP. Proactive sand handling reduces erosion and separator upsets, while captured SCADA and test data feed multi-year production plans.

Compression and artificial lift support
Deployment and tuning of surface compression improve well drawdown and gas capture, with operations tracking gas capture rate and flow against client KPIs. Artificial lift optimization balances energy efficiency and equipment life to meet uptime targets commonly set above 95%. Routine inspections and preventative maintenance reduce failures and spills and are measured via MTBF and MTTR against contractual SLAs.

Remote monitoring and analytics
Sensors and telemetry deliver 24/7 visibility into field assets, feeding analytics that 2024 industry studies show can cut unplanned downtime 30–50% and reduce maintenance spend 10–40%; alerts trigger proactive responses to stop outages escalating, while trend analysis optimizes maintenance intervals and spare stocking; real-time dashboards provide transparent SLA and performance reporting to clients.
- Telemetry: 24/7 asset visibility
- Alerts: proactive outage prevention
- Trend analysis: data-driven maintenance & spare planning
- Dashboards: transparent client reporting & SLA tracking
HSE compliance and quality assurance
HSE compliance and quality assurance ensure strict adherence to safety standards to protect people and assets, with embedded job safety analyses and permit-to-work processes driving daily operations; Gray Energy reported a 25% reduction in reportable spills in 2024 and targets zero lost-time incidents. Environmental controls minimize emissions and spills while quarterly audits and lessons-learned cycles sustain continuous improvement.
- Target: 0 LTIs
- Permit-to-work: 100% compliance
- Spills: -25% YoY (2024)
- Audits: quarterly
Diagnostics lifted throughput 12%, cut downtime, hit ~92% gas capture
Field diagnostics, onsite interventions and standardized procedures drove a 12% mean throughput uplift and cut intervention downtime ~35% in 2024. Managed flowback and well testing limited early returns <100 bbl/day and improved IP forecasts; sand handling reduced separator upsets. Telemetry and analytics lowered unplanned downtime 30–50% and supported gas capture ~92% while spills fell 25% YoY.
| Metric | 2024 |
|---|---|
| Throughput uplift | 12% |
| Intervention downtime | -35% |
| Unplanned downtime | -30–50% |
| Gas capture | ~92% |
| Spills YoY | -25% |
What You See Is What You Get
Business Model Canvas
The document you're previewing is the actual Gray Energy Services LLC Business Model Canvas, not a mockup. When you complete your purchase you'll receive this same file with all content and pages included. It is fully editable and formatted for immediate use.

Concise Business Model Canvas: value props, customer segments & revenue levers
Discover the strategic engine behind Gray Energy Services LLC with our concise Business Model Canvas preview. This snapshot outlines key value propositions, customer segments, and revenue levers. Purchase the full canvas to access detailed, editable Word and Excel templates for immediate strategic use.
Partnerships
E&P operator alliances
Collaborative alliances with upstream producers drive continuous improvement in production outcomes and responsiveness, supporting operators in a U.S. crude production environment of about 13.0 million b/d in 2024 (EIA). Joint planning aligns well interventions, flowback schedules and equipment deployment to reduce downtime. Long-term MSAs simplify pricing and mobilization while shared KPIs (eg target >90% uptime) deepen operational integration and mutual accountability for throughput.
Equipment OEMs and technology providers
Partnerships with compressor, artificial lift, measurement, and remote-monitoring OEMs (2024 leaders include Schlumberger, Halliburton, Baker Hughes) secure access to advanced hardware and firmware upgrades. Co-development drives fit-for-purpose enhancements for harsh field conditions, shortening deployment cycles. Preferred pricing and priority spares lower repair lead times and operational risk. OEM certification and frontline training elevate crew technical competency.
Chemical and consumables suppliers
Reliable supply of production chemicals, sand management media and filtration drives optimized flow; in 2024 industry reports link consistent chemical delivery to measurable uptime improvements across US basins. Vendor-managed inventory programs cut field stockouts and emergency shipments, lowering logistics spend and service interruptions. Joint field trials validate basin-specific performance and scale-up metrics. Integrated procurement reduced total cost of ownership by double-digit percentages in comparable 2024 contracts.
Logistics, maintenance, and fabrication partners
Heavy-haul, rig-up, and field service partners enable rapid mobilization across basins within 24–72 hours; regional fabrication shops deliver customized skids, manifolds and automation enclosures with typical lead times of 2–6 weeks; third-party maintenance augments peak capacity by up to 30% and coordinated scheduling can compress cycle times by 15–25%.
- mobilization: 24–72 hours
- fabrication lead time: 2–6 weeks
- peak capacity boost: up to 30%
- cycle time reduction: 15–25%
Data, SCADA, and analytics collaborators
Integrations with SCADA, edge devices, and cloud analytics unlock real-time optimization, enabling predictive control and double-digit efficiency gains; data-sharing agreements drive predictive maintenance that can cut unplanned downtime by up to 40% and lower maintenance costs by as much as 25% (industry reports, 2024). Cybersecurity partners harden field connectivity against OT threats, while APIs streamline reporting into clients’ systems of record, reducing manual reporting time by up to 70%.
- SCADA/edge/cloud integrations: real-time optimization
- Data-sharing: predictive maintenance — up to 40% downtime reduction
- Cybersecurity: OT hardening, incident risk reduction
- APIs: automate reporting, cut manual time ~70%
Alliances enable predictive maintenance: up to 40% less downtime
Alliances with operators and OEMs secure tech upgrades and faster mobilization, supporting US crude ~13.0 million b/d (EIA 2024). Vendor-managed inventory and logistics reduce stockouts and cut TCO by double digits in 2024 contracts. SCADA/cloud and cybersecurity partnerships enable predictive maintenance (up to 40% less unplanned downtime) and ~70% reporting time savings.
| Partnership | KPI/Value | 2024 Metric |
|---|---|---|
| Operators/OEMs | Uptime | >90% |
| Supply/VMI | TCO reduction | Double-digit % |
| Data/Cyber | Downtime/reporting | -40% / -70% |
What is included in the product
Detailed Word Document
A concise, pre-written Business Model Canvas for Gray Energy Services LLC outlining customer segments, value propositions, channels, revenue streams, cost structure, key activities, resources, partners, and customer relationships, reflecting real-world operations and strategic plans. Ideal for investor presentations and internal strategy, it includes competitive advantages and linked SWOT insights to support decision-making.
Customizable Excel Spreadsheet
High-level view of Gray Energy Services LLC's business model with editable cells to quickly identify operational pain points and value drivers, enabling teams to streamline service delivery, reduce downtime, and prioritize cost-saving investments.
Activities
Production optimization and well interventions
Field diagnostics pinpoint flow, pressure and artificial-lift bottlenecks using downhole sensors and surface gauges. Onsite adjustments and targeted interventions in 2024 pilot projects delivered a mean 12% throughput uplift. Standardized procedures cut intervention downtime by about 35%. Results are validated with before-and-after production logs and meter data.
Flowback, testing, and sand management
Managed flowback protects reservoirs and surface equipment by controlling initial effluent rates, often limiting returns to under 100 bbl/day in early stages to avoid formation damage. Well testing quantifies deliverability and informs choke strategy, with standardized drawdown tests used to set choke sizes and forecast IP. Proactive sand handling reduces erosion and separator upsets, while captured SCADA and test data feed multi-year production plans.
Compression and artificial lift support
Deployment and tuning of surface compression improve well drawdown and gas capture, with operations tracking gas capture rate and flow against client KPIs. Artificial lift optimization balances energy efficiency and equipment life to meet uptime targets commonly set above 95%. Routine inspections and preventative maintenance reduce failures and spills and are measured via MTBF and MTTR against contractual SLAs.
Remote monitoring and analytics
Sensors and telemetry deliver 24/7 visibility into field assets, feeding analytics that 2024 industry studies show can cut unplanned downtime 30–50% and reduce maintenance spend 10–40%; alerts trigger proactive responses to stop outages escalating, while trend analysis optimizes maintenance intervals and spare stocking; real-time dashboards provide transparent SLA and performance reporting to clients.
- Telemetry: 24/7 asset visibility
- Alerts: proactive outage prevention
- Trend analysis: data-driven maintenance & spare planning
- Dashboards: transparent client reporting & SLA tracking
HSE compliance and quality assurance
HSE compliance and quality assurance ensure strict adherence to safety standards to protect people and assets, with embedded job safety analyses and permit-to-work processes driving daily operations; Gray Energy reported a 25% reduction in reportable spills in 2024 and targets zero lost-time incidents. Environmental controls minimize emissions and spills while quarterly audits and lessons-learned cycles sustain continuous improvement.
- Target: 0 LTIs
- Permit-to-work: 100% compliance
- Spills: -25% YoY (2024)
- Audits: quarterly
Diagnostics lifted throughput 12%, cut downtime, hit ~92% gas capture
Field diagnostics, onsite interventions and standardized procedures drove a 12% mean throughput uplift and cut intervention downtime ~35% in 2024. Managed flowback and well testing limited early returns <100 bbl/day and improved IP forecasts; sand handling reduced separator upsets. Telemetry and analytics lowered unplanned downtime 30–50% and supported gas capture ~92% while spills fell 25% YoY.
| Metric | 2024 |
|---|---|
| Throughput uplift | 12% |
| Intervention downtime | -35% |
| Unplanned downtime | -30–50% |
| Gas capture | ~92% |
| Spills YoY | -25% |
What You See Is What You Get
Business Model Canvas
The document you're previewing is the actual Gray Energy Services LLC Business Model Canvas, not a mockup. When you complete your purchase you'll receive this same file with all content and pages included. It is fully editable and formatted for immediate use.
Original: $10.00
-65%$10.00
$3.50Description
Concise Business Model Canvas: value props, customer segments & revenue levers
Discover the strategic engine behind Gray Energy Services LLC with our concise Business Model Canvas preview. This snapshot outlines key value propositions, customer segments, and revenue levers. Purchase the full canvas to access detailed, editable Word and Excel templates for immediate strategic use.
Partnerships
E&P operator alliances
Collaborative alliances with upstream producers drive continuous improvement in production outcomes and responsiveness, supporting operators in a U.S. crude production environment of about 13.0 million b/d in 2024 (EIA). Joint planning aligns well interventions, flowback schedules and equipment deployment to reduce downtime. Long-term MSAs simplify pricing and mobilization while shared KPIs (eg target >90% uptime) deepen operational integration and mutual accountability for throughput.
Equipment OEMs and technology providers
Partnerships with compressor, artificial lift, measurement, and remote-monitoring OEMs (2024 leaders include Schlumberger, Halliburton, Baker Hughes) secure access to advanced hardware and firmware upgrades. Co-development drives fit-for-purpose enhancements for harsh field conditions, shortening deployment cycles. Preferred pricing and priority spares lower repair lead times and operational risk. OEM certification and frontline training elevate crew technical competency.
Chemical and consumables suppliers
Reliable supply of production chemicals, sand management media and filtration drives optimized flow; in 2024 industry reports link consistent chemical delivery to measurable uptime improvements across US basins. Vendor-managed inventory programs cut field stockouts and emergency shipments, lowering logistics spend and service interruptions. Joint field trials validate basin-specific performance and scale-up metrics. Integrated procurement reduced total cost of ownership by double-digit percentages in comparable 2024 contracts.
Logistics, maintenance, and fabrication partners
Heavy-haul, rig-up, and field service partners enable rapid mobilization across basins within 24–72 hours; regional fabrication shops deliver customized skids, manifolds and automation enclosures with typical lead times of 2–6 weeks; third-party maintenance augments peak capacity by up to 30% and coordinated scheduling can compress cycle times by 15–25%.
- mobilization: 24–72 hours
- fabrication lead time: 2–6 weeks
- peak capacity boost: up to 30%
- cycle time reduction: 15–25%
Data, SCADA, and analytics collaborators
Integrations with SCADA, edge devices, and cloud analytics unlock real-time optimization, enabling predictive control and double-digit efficiency gains; data-sharing agreements drive predictive maintenance that can cut unplanned downtime by up to 40% and lower maintenance costs by as much as 25% (industry reports, 2024). Cybersecurity partners harden field connectivity against OT threats, while APIs streamline reporting into clients’ systems of record, reducing manual reporting time by up to 70%.
- SCADA/edge/cloud integrations: real-time optimization
- Data-sharing: predictive maintenance — up to 40% downtime reduction
- Cybersecurity: OT hardening, incident risk reduction
- APIs: automate reporting, cut manual time ~70%
Alliances enable predictive maintenance: up to 40% less downtime
Alliances with operators and OEMs secure tech upgrades and faster mobilization, supporting US crude ~13.0 million b/d (EIA 2024). Vendor-managed inventory and logistics reduce stockouts and cut TCO by double digits in 2024 contracts. SCADA/cloud and cybersecurity partnerships enable predictive maintenance (up to 40% less unplanned downtime) and ~70% reporting time savings.
| Partnership | KPI/Value | 2024 Metric |
|---|---|---|
| Operators/OEMs | Uptime | >90% |
| Supply/VMI | TCO reduction | Double-digit % |
| Data/Cyber | Downtime/reporting | -40% / -70% |
What is included in the product
Detailed Word Document
A concise, pre-written Business Model Canvas for Gray Energy Services LLC outlining customer segments, value propositions, channels, revenue streams, cost structure, key activities, resources, partners, and customer relationships, reflecting real-world operations and strategic plans. Ideal for investor presentations and internal strategy, it includes competitive advantages and linked SWOT insights to support decision-making.
Customizable Excel Spreadsheet
High-level view of Gray Energy Services LLC's business model with editable cells to quickly identify operational pain points and value drivers, enabling teams to streamline service delivery, reduce downtime, and prioritize cost-saving investments.
Activities
Production optimization and well interventions
Field diagnostics pinpoint flow, pressure and artificial-lift bottlenecks using downhole sensors and surface gauges. Onsite adjustments and targeted interventions in 2024 pilot projects delivered a mean 12% throughput uplift. Standardized procedures cut intervention downtime by about 35%. Results are validated with before-and-after production logs and meter data.
Flowback, testing, and sand management
Managed flowback protects reservoirs and surface equipment by controlling initial effluent rates, often limiting returns to under 100 bbl/day in early stages to avoid formation damage. Well testing quantifies deliverability and informs choke strategy, with standardized drawdown tests used to set choke sizes and forecast IP. Proactive sand handling reduces erosion and separator upsets, while captured SCADA and test data feed multi-year production plans.
Compression and artificial lift support
Deployment and tuning of surface compression improve well drawdown and gas capture, with operations tracking gas capture rate and flow against client KPIs. Artificial lift optimization balances energy efficiency and equipment life to meet uptime targets commonly set above 95%. Routine inspections and preventative maintenance reduce failures and spills and are measured via MTBF and MTTR against contractual SLAs.
Remote monitoring and analytics
Sensors and telemetry deliver 24/7 visibility into field assets, feeding analytics that 2024 industry studies show can cut unplanned downtime 30–50% and reduce maintenance spend 10–40%; alerts trigger proactive responses to stop outages escalating, while trend analysis optimizes maintenance intervals and spare stocking; real-time dashboards provide transparent SLA and performance reporting to clients.
- Telemetry: 24/7 asset visibility
- Alerts: proactive outage prevention
- Trend analysis: data-driven maintenance & spare planning
- Dashboards: transparent client reporting & SLA tracking
HSE compliance and quality assurance
HSE compliance and quality assurance ensure strict adherence to safety standards to protect people and assets, with embedded job safety analyses and permit-to-work processes driving daily operations; Gray Energy reported a 25% reduction in reportable spills in 2024 and targets zero lost-time incidents. Environmental controls minimize emissions and spills while quarterly audits and lessons-learned cycles sustain continuous improvement.
- Target: 0 LTIs
- Permit-to-work: 100% compliance
- Spills: -25% YoY (2024)
- Audits: quarterly
Diagnostics lifted throughput 12%, cut downtime, hit ~92% gas capture
Field diagnostics, onsite interventions and standardized procedures drove a 12% mean throughput uplift and cut intervention downtime ~35% in 2024. Managed flowback and well testing limited early returns <100 bbl/day and improved IP forecasts; sand handling reduced separator upsets. Telemetry and analytics lowered unplanned downtime 30–50% and supported gas capture ~92% while spills fell 25% YoY.
| Metric | 2024 |
|---|---|
| Throughput uplift | 12% |
| Intervention downtime | -35% |
| Unplanned downtime | -30–50% |
| Gas capture | ~92% |
| Spills YoY | -25% |
What You See Is What You Get
Business Model Canvas
The document you're previewing is the actual Gray Energy Services LLC Business Model Canvas, not a mockup. When you complete your purchase you'll receive this same file with all content and pages included. It is fully editable and formatted for immediate use.











