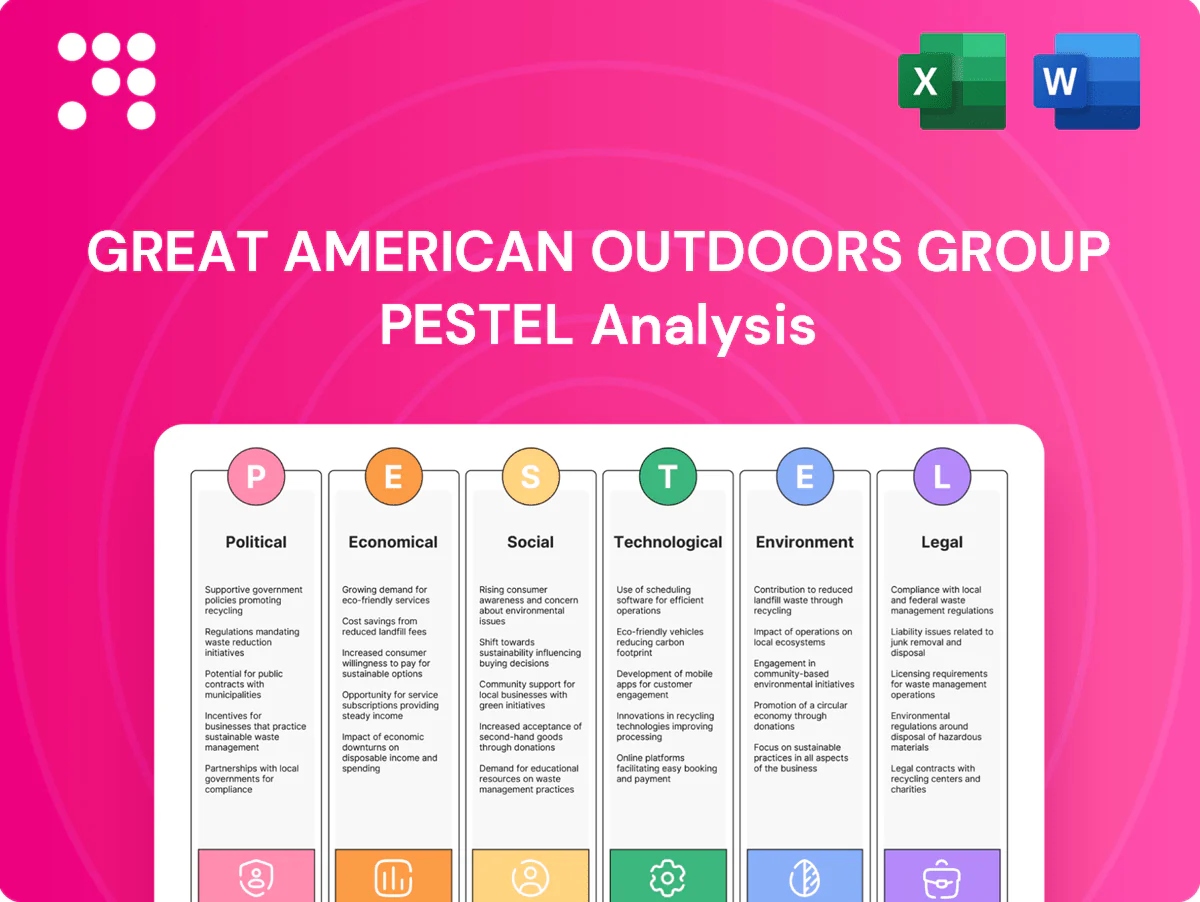
Great American Outdoors Group PESTLE Analysis

Make Smarter Strategic Decisions with a Complete PESTEL View
Explore a concise PESTLE snapshot of Great American Outdoors Group—highlighting regulatory pressures, shifting consumer outdoor trends, macroeconomic impacts, and tech-driven distribution changes that shape strategy and valuation; buy the full PESTLE to get detailed, actionable intelligence in ready-to-use formats for investment, planning, or competitive analysis.
Political factors

Firearms and hunting policy shifts
Changes in federal and state firearms laws across all 50 states directly affect assortment, compliance costs, and sales velocity for hunting categories, with ATF rulemaking and state variations reshaping stocking decisions. Background check rules, age limits, and serialization requirements change in-store and e-commerce flows and add measurable compliance spend. Advocacy must balance customer expectations with reputational risk and regulatory scrutiny; proactive compliance systems reduce disruption during policy swings, important amid rising public safety attention (CDC reported 48,830 firearm deaths in 2022).
Fish and wildlife management regulations
Bags, seasons, and licensing policies shift demand timing and product mix across hunting and fishing, forcing inventory cycles and promotional planning. Conservation-driven restrictions can reduce short-term sales while preserving resources and strengthening long-term brand credibility. Close coordination with agencies improves forecasting for inventory and events. Education programs turn regulatory change into trust and increased store traffic.

Public lands access and infrastructure funding
Federal and state investment—now exceeding $1 billion annually in recreation grants and infrastructure—expands the TAM by improving parks, boat ramps and trails and driving participation. Public lands see roughly 300 million annual visits, but regional policy debates on land use, motorized access and conservation easements create variability in store productivity. Resorts and attractions gain from tourism funding and destination marketing that often delivers multi-million dollar visitor spending boosts, so engagement in policy forums helps safeguard multi-use access that supports sales and experiences.

Trade policy and import tariffs on gear
Tariffs on textiles (~11% average on apparel), electronics (typically 2–5%), and metal components (US Section 232: 25% steel, 10% aluminum) raise COGS for apparel, optics, and boating accessories, squeezing margins for Great American Outdoors Group. Shifts in country of origin force vendor diversification and logistics redesign, adding trade-compliance lead time and forecasting complexity. Pricing power and private-label mix dictate pass-through effectiveness.
- Tariff hotspots: textiles ~11%
- Metals: 25% steel, 10% Al
- Electronics: 2–5%
- Vendor diversification increases lead time
- Private-label boosts pass-through
State and local incentives, zoning, and permits
Large-format stores, marinas and resorts rely on permits, environmental reviews and community approvals, with typical entitlement timelines often spanning 12–24 months for major projects; Clean Water Act and coastal permits commonly add 6–18 months depending on location. Targeted tax incentives have been shown to raise new-market ROIC by several percentage points and accelerate expansion, while negative political sentiment toward big-box retail and tourism can tighten deal terms and increase mitigation costs. Early stakeholder engagement measurably reduces entitlement risk and construction delays.
- Permitting timelines: 12–24 months
- Coastal/clean-water add: 6–18 months
- Incentive impact: ROIC + a few percentage points
- Mitigation: higher if local sentiment opposes big-box/tourism
Firearm rules, tariffs and recreation funding reshape outdoor retail margins and expansion
Federal/state firearms rules reshape assortment, compliance spend and sales velocity (CDC: 48,830 firearm deaths in 2022). Recreation funding >$1B/year expands TAM and park visits (~300M annually). Tariffs (textiles ~11%, steel 25%, Al 10%) raise COGS; permitting for stores/marinas typically 12–24 months, +6–18 months for coastal reviews.
| Factor | Metric | Impact |
|---|---|---|
| Firearms | 48,830 deaths (2022) | Compliance cost↑ |
| Funding | >$1B/yr | TAM↑ |
| Tariffs | Textiles 11%, Steel 25% | COGS↑ |
| Permits | 12–24m | Expansion delay |
What is included in the product
 Detailed Word Document
Explores how Political, Economic, Social, Technological, Environmental and Legal forces uniquely impact Great American Outdoors Group, pairing data-driven trends and region-specific insights to identify risks, growth levers and strategic options for executives, investors and planners.

 Customizable Excel Spreadsheet
A clean, summarized PESTLE of Great American Outdoors Group that’s visually segmented, editable for region or business line, and ready to drop into PowerPoints—helping teams quickly align on external risks, regulatory impacts, and market positioning during planning sessions.
Economic factors

Consumer discretionary cycles
Outdoor hardgoods and boats are highly cyclical—demand rises with confidence and falls in recessions; outdoor recreation contributed about $689 billion to the U.S. economy in 2021 per DOI, highlighting scale sensitivity to macro swings. Promotional intensity and strict inventory discipline (faster turn, markdown programs) have preserved margins in past downturns. Experiences and services (guided trips, rentals) smooth volatility versus durables, while flexible labor and pay-for-performance protect operating leverage.
Inflation, input costs, and freight
Material, wage and logistics inflation—US CPI ~3.4% in 2024 and average wage growth near 4%—squeezes gross margins and can force higher ticket prices for Great American Outdoors Group. Private brands and assortment mix management have historically boosted margin resilience by 100–300 bps versus national brands. Long‑lead imports face forecasting risk as container rates swung from pandemic peaks (~$8,000/FEU) to ~$1,500 in 2024 and diesel averaged ~$4.00/gal. Dynamic pricing tools and deeper vendor partnerships improve agility to pass or absorb cost shocks.

Interest rates and big-ticket financing
Rising benchmark rates—federal funds at 5.25–5.50% in mid‑2025—push retail APRs for boats, ATVs and travel financing into the 6–12% range, lowering affordability, elongating sales cycles and raising cancellations. Manufacturer incentives and captive‑style programs (subsidized rates, deferred payments) have materially stabilized demand. Strong credit underwriting limits defaults and preserves add‑on income streams.

Fuel prices and travel behavior
Labor markets and wage dynamics
Tight labor markets (U.S. unemployment ~3.7% in 2024) push Great American Outdoors Group store and hospitality payrolls higher, squeezing margins and challenging service levels; leisure and hospitality wages rose roughly 6% YoY in 2024, increasing operating costs. Seasonal hiring windows force stronger employer branding and flexible scheduling; cross-training boosts productivity and guest experience, while tech-enabled scheduling cuts overtime and shrink.
- Payroll pressure: wages up ~6% YoY (leisure/hospitality 2024)
- Seasonal hiring: compact windows require branding
- Cross-training: improves productivity & NPS
- Scheduling tech: reduces OT and shrink
Firearm rules, tariffs and recreation funding reshape outdoor retail margins and expansion
Outdoor durables are cyclical: outdoor recreation $689B (2021) and consumer confidence drive demand; 2024 gas $3.65/gal, diesel $3.92 reduce long‑haul trips. Fed funds 5.25–5.50% (mid‑2025) lifts financing costs (boat/RV APRs ~6–12%), lowering affordability; wages +4–6% (2024) squeeze margins while private brands add ~100–300 bps resilience.
| Metric | Value |
|---|---|
| Outdoor spend | $689B (2021) |
| Gas / Diesel | $3.65 / $3.92 (2024) |
| Fed funds | 5.25–5.50% (mid‑2025) |
| Wage growth | 4–6% (2024) |
Same Document Delivered
Great American Outdoors Group PESTLE Analysis
This preview is the exact Great American Outdoors Group PESTLE Analysis you’ll receive after purchase—fully formatted, professionally structured, and ready to use. The document contains political, economic, social, technological, legal, and environmental insights tailored to strategic decision-making. No placeholders or teasers—what you see is the final downloadable file.

Make Smarter Strategic Decisions with a Complete PESTEL View
Explore a concise PESTLE snapshot of Great American Outdoors Group—highlighting regulatory pressures, shifting consumer outdoor trends, macroeconomic impacts, and tech-driven distribution changes that shape strategy and valuation; buy the full PESTLE to get detailed, actionable intelligence in ready-to-use formats for investment, planning, or competitive analysis.
Political factors
Firearms and hunting policy shifts
Changes in federal and state firearms laws across all 50 states directly affect assortment, compliance costs, and sales velocity for hunting categories, with ATF rulemaking and state variations reshaping stocking decisions. Background check rules, age limits, and serialization requirements change in-store and e-commerce flows and add measurable compliance spend. Advocacy must balance customer expectations with reputational risk and regulatory scrutiny; proactive compliance systems reduce disruption during policy swings, important amid rising public safety attention (CDC reported 48,830 firearm deaths in 2022).
Fish and wildlife management regulations
Bags, seasons, and licensing policies shift demand timing and product mix across hunting and fishing, forcing inventory cycles and promotional planning. Conservation-driven restrictions can reduce short-term sales while preserving resources and strengthening long-term brand credibility. Close coordination with agencies improves forecasting for inventory and events. Education programs turn regulatory change into trust and increased store traffic.
Public lands access and infrastructure funding
Federal and state investment—now exceeding $1 billion annually in recreation grants and infrastructure—expands the TAM by improving parks, boat ramps and trails and driving participation. Public lands see roughly 300 million annual visits, but regional policy debates on land use, motorized access and conservation easements create variability in store productivity. Resorts and attractions gain from tourism funding and destination marketing that often delivers multi-million dollar visitor spending boosts, so engagement in policy forums helps safeguard multi-use access that supports sales and experiences.
Trade policy and import tariffs on gear
Tariffs on textiles (~11% average on apparel), electronics (typically 2–5%), and metal components (US Section 232: 25% steel, 10% aluminum) raise COGS for apparel, optics, and boating accessories, squeezing margins for Great American Outdoors Group. Shifts in country of origin force vendor diversification and logistics redesign, adding trade-compliance lead time and forecasting complexity. Pricing power and private-label mix dictate pass-through effectiveness.
- Tariff hotspots: textiles ~11%
- Metals: 25% steel, 10% Al
- Electronics: 2–5%
- Vendor diversification increases lead time
- Private-label boosts pass-through
State and local incentives, zoning, and permits
Large-format stores, marinas and resorts rely on permits, environmental reviews and community approvals, with typical entitlement timelines often spanning 12–24 months for major projects; Clean Water Act and coastal permits commonly add 6–18 months depending on location. Targeted tax incentives have been shown to raise new-market ROIC by several percentage points and accelerate expansion, while negative political sentiment toward big-box retail and tourism can tighten deal terms and increase mitigation costs. Early stakeholder engagement measurably reduces entitlement risk and construction delays.
- Permitting timelines: 12–24 months
- Coastal/clean-water add: 6–18 months
- Incentive impact: ROIC + a few percentage points
- Mitigation: higher if local sentiment opposes big-box/tourism
Firearm rules, tariffs and recreation funding reshape outdoor retail margins and expansion
Federal/state firearms rules reshape assortment, compliance spend and sales velocity (CDC: 48,830 firearm deaths in 2022). Recreation funding >$1B/year expands TAM and park visits (~300M annually). Tariffs (textiles ~11%, steel 25%, Al 10%) raise COGS; permitting for stores/marinas typically 12–24 months, +6–18 months for coastal reviews.
| Factor | Metric | Impact |
|---|---|---|
| Firearms | 48,830 deaths (2022) | Compliance cost↑ |
| Funding | >$1B/yr | TAM↑ |
| Tariffs | Textiles 11%, Steel 25% | COGS↑ |
| Permits | 12–24m | Expansion delay |
What is included in the product
Detailed Word Document
Explores how Political, Economic, Social, Technological, Environmental and Legal forces uniquely impact Great American Outdoors Group, pairing data-driven trends and region-specific insights to identify risks, growth levers and strategic options for executives, investors and planners.
Customizable Excel Spreadsheet
A clean, summarized PESTLE of Great American Outdoors Group that’s visually segmented, editable for region or business line, and ready to drop into PowerPoints—helping teams quickly align on external risks, regulatory impacts, and market positioning during planning sessions.
Economic factors
Consumer discretionary cycles
Outdoor hardgoods and boats are highly cyclical—demand rises with confidence and falls in recessions; outdoor recreation contributed about $689 billion to the U.S. economy in 2021 per DOI, highlighting scale sensitivity to macro swings. Promotional intensity and strict inventory discipline (faster turn, markdown programs) have preserved margins in past downturns. Experiences and services (guided trips, rentals) smooth volatility versus durables, while flexible labor and pay-for-performance protect operating leverage.
Inflation, input costs, and freight
Material, wage and logistics inflation—US CPI ~3.4% in 2024 and average wage growth near 4%—squeezes gross margins and can force higher ticket prices for Great American Outdoors Group. Private brands and assortment mix management have historically boosted margin resilience by 100–300 bps versus national brands. Long‑lead imports face forecasting risk as container rates swung from pandemic peaks (~$8,000/FEU) to ~$1,500 in 2024 and diesel averaged ~$4.00/gal. Dynamic pricing tools and deeper vendor partnerships improve agility to pass or absorb cost shocks.
Interest rates and big-ticket financing
Rising benchmark rates—federal funds at 5.25–5.50% in mid‑2025—push retail APRs for boats, ATVs and travel financing into the 6–12% range, lowering affordability, elongating sales cycles and raising cancellations. Manufacturer incentives and captive‑style programs (subsidized rates, deferred payments) have materially stabilized demand. Strong credit underwriting limits defaults and preserves add‑on income streams.
Fuel prices and travel behavior
Labor markets and wage dynamics
Tight labor markets (U.S. unemployment ~3.7% in 2024) push Great American Outdoors Group store and hospitality payrolls higher, squeezing margins and challenging service levels; leisure and hospitality wages rose roughly 6% YoY in 2024, increasing operating costs. Seasonal hiring windows force stronger employer branding and flexible scheduling; cross-training boosts productivity and guest experience, while tech-enabled scheduling cuts overtime and shrink.
- Payroll pressure: wages up ~6% YoY (leisure/hospitality 2024)
- Seasonal hiring: compact windows require branding
- Cross-training: improves productivity & NPS
- Scheduling tech: reduces OT and shrink
Firearm rules, tariffs and recreation funding reshape outdoor retail margins and expansion
Outdoor durables are cyclical: outdoor recreation $689B (2021) and consumer confidence drive demand; 2024 gas $3.65/gal, diesel $3.92 reduce long‑haul trips. Fed funds 5.25–5.50% (mid‑2025) lifts financing costs (boat/RV APRs ~6–12%), lowering affordability; wages +4–6% (2024) squeeze margins while private brands add ~100–300 bps resilience.
| Metric | Value |
|---|---|
| Outdoor spend | $689B (2021) |
| Gas / Diesel | $3.65 / $3.92 (2024) |
| Fed funds | 5.25–5.50% (mid‑2025) |
| Wage growth | 4–6% (2024) |
Same Document Delivered
Great American Outdoors Group PESTLE Analysis
This preview is the exact Great American Outdoors Group PESTLE Analysis you’ll receive after purchase—fully formatted, professionally structured, and ready to use. The document contains political, economic, social, technological, legal, and environmental insights tailored to strategic decision-making. No placeholders or teasers—what you see is the final downloadable file.
Original: $10.00
-65%$10.00
$3.50Description
Make Smarter Strategic Decisions with a Complete PESTEL View
Explore a concise PESTLE snapshot of Great American Outdoors Group—highlighting regulatory pressures, shifting consumer outdoor trends, macroeconomic impacts, and tech-driven distribution changes that shape strategy and valuation; buy the full PESTLE to get detailed, actionable intelligence in ready-to-use formats for investment, planning, or competitive analysis.
Political factors
Firearms and hunting policy shifts
Changes in federal and state firearms laws across all 50 states directly affect assortment, compliance costs, and sales velocity for hunting categories, with ATF rulemaking and state variations reshaping stocking decisions. Background check rules, age limits, and serialization requirements change in-store and e-commerce flows and add measurable compliance spend. Advocacy must balance customer expectations with reputational risk and regulatory scrutiny; proactive compliance systems reduce disruption during policy swings, important amid rising public safety attention (CDC reported 48,830 firearm deaths in 2022).
Fish and wildlife management regulations
Bags, seasons, and licensing policies shift demand timing and product mix across hunting and fishing, forcing inventory cycles and promotional planning. Conservation-driven restrictions can reduce short-term sales while preserving resources and strengthening long-term brand credibility. Close coordination with agencies improves forecasting for inventory and events. Education programs turn regulatory change into trust and increased store traffic.
Public lands access and infrastructure funding
Federal and state investment—now exceeding $1 billion annually in recreation grants and infrastructure—expands the TAM by improving parks, boat ramps and trails and driving participation. Public lands see roughly 300 million annual visits, but regional policy debates on land use, motorized access and conservation easements create variability in store productivity. Resorts and attractions gain from tourism funding and destination marketing that often delivers multi-million dollar visitor spending boosts, so engagement in policy forums helps safeguard multi-use access that supports sales and experiences.
Trade policy and import tariffs on gear
Tariffs on textiles (~11% average on apparel), electronics (typically 2–5%), and metal components (US Section 232: 25% steel, 10% aluminum) raise COGS for apparel, optics, and boating accessories, squeezing margins for Great American Outdoors Group. Shifts in country of origin force vendor diversification and logistics redesign, adding trade-compliance lead time and forecasting complexity. Pricing power and private-label mix dictate pass-through effectiveness.
- Tariff hotspots: textiles ~11%
- Metals: 25% steel, 10% Al
- Electronics: 2–5%
- Vendor diversification increases lead time
- Private-label boosts pass-through
State and local incentives, zoning, and permits
Large-format stores, marinas and resorts rely on permits, environmental reviews and community approvals, with typical entitlement timelines often spanning 12–24 months for major projects; Clean Water Act and coastal permits commonly add 6–18 months depending on location. Targeted tax incentives have been shown to raise new-market ROIC by several percentage points and accelerate expansion, while negative political sentiment toward big-box retail and tourism can tighten deal terms and increase mitigation costs. Early stakeholder engagement measurably reduces entitlement risk and construction delays.
- Permitting timelines: 12–24 months
- Coastal/clean-water add: 6–18 months
- Incentive impact: ROIC + a few percentage points
- Mitigation: higher if local sentiment opposes big-box/tourism
Firearm rules, tariffs and recreation funding reshape outdoor retail margins and expansion
Federal/state firearms rules reshape assortment, compliance spend and sales velocity (CDC: 48,830 firearm deaths in 2022). Recreation funding >$1B/year expands TAM and park visits (~300M annually). Tariffs (textiles ~11%, steel 25%, Al 10%) raise COGS; permitting for stores/marinas typically 12–24 months, +6–18 months for coastal reviews.
| Factor | Metric | Impact |
|---|---|---|
| Firearms | 48,830 deaths (2022) | Compliance cost↑ |
| Funding | >$1B/yr | TAM↑ |
| Tariffs | Textiles 11%, Steel 25% | COGS↑ |
| Permits | 12–24m | Expansion delay |
What is included in the product
Detailed Word Document
Explores how Political, Economic, Social, Technological, Environmental and Legal forces uniquely impact Great American Outdoors Group, pairing data-driven trends and region-specific insights to identify risks, growth levers and strategic options for executives, investors and planners.
Customizable Excel Spreadsheet
A clean, summarized PESTLE of Great American Outdoors Group that’s visually segmented, editable for region or business line, and ready to drop into PowerPoints—helping teams quickly align on external risks, regulatory impacts, and market positioning during planning sessions.
Economic factors
Consumer discretionary cycles
Outdoor hardgoods and boats are highly cyclical—demand rises with confidence and falls in recessions; outdoor recreation contributed about $689 billion to the U.S. economy in 2021 per DOI, highlighting scale sensitivity to macro swings. Promotional intensity and strict inventory discipline (faster turn, markdown programs) have preserved margins in past downturns. Experiences and services (guided trips, rentals) smooth volatility versus durables, while flexible labor and pay-for-performance protect operating leverage.
Inflation, input costs, and freight
Material, wage and logistics inflation—US CPI ~3.4% in 2024 and average wage growth near 4%—squeezes gross margins and can force higher ticket prices for Great American Outdoors Group. Private brands and assortment mix management have historically boosted margin resilience by 100–300 bps versus national brands. Long‑lead imports face forecasting risk as container rates swung from pandemic peaks (~$8,000/FEU) to ~$1,500 in 2024 and diesel averaged ~$4.00/gal. Dynamic pricing tools and deeper vendor partnerships improve agility to pass or absorb cost shocks.
Interest rates and big-ticket financing
Rising benchmark rates—federal funds at 5.25–5.50% in mid‑2025—push retail APRs for boats, ATVs and travel financing into the 6–12% range, lowering affordability, elongating sales cycles and raising cancellations. Manufacturer incentives and captive‑style programs (subsidized rates, deferred payments) have materially stabilized demand. Strong credit underwriting limits defaults and preserves add‑on income streams.
Fuel prices and travel behavior
Labor markets and wage dynamics
Tight labor markets (U.S. unemployment ~3.7% in 2024) push Great American Outdoors Group store and hospitality payrolls higher, squeezing margins and challenging service levels; leisure and hospitality wages rose roughly 6% YoY in 2024, increasing operating costs. Seasonal hiring windows force stronger employer branding and flexible scheduling; cross-training boosts productivity and guest experience, while tech-enabled scheduling cuts overtime and shrink.
- Payroll pressure: wages up ~6% YoY (leisure/hospitality 2024)
- Seasonal hiring: compact windows require branding
- Cross-training: improves productivity & NPS
- Scheduling tech: reduces OT and shrink
Firearm rules, tariffs and recreation funding reshape outdoor retail margins and expansion
Outdoor durables are cyclical: outdoor recreation $689B (2021) and consumer confidence drive demand; 2024 gas $3.65/gal, diesel $3.92 reduce long‑haul trips. Fed funds 5.25–5.50% (mid‑2025) lifts financing costs (boat/RV APRs ~6–12%), lowering affordability; wages +4–6% (2024) squeeze margins while private brands add ~100–300 bps resilience.
| Metric | Value |
|---|---|
| Outdoor spend | $689B (2021) |
| Gas / Diesel | $3.65 / $3.92 (2024) |
| Fed funds | 5.25–5.50% (mid‑2025) |
| Wage growth | 4–6% (2024) |
Same Document Delivered
Great American Outdoors Group PESTLE Analysis
This preview is the exact Great American Outdoors Group PESTLE Analysis you’ll receive after purchase—fully formatted, professionally structured, and ready to use. The document contains political, economic, social, technological, legal, and environmental insights tailored to strategic decision-making. No placeholders or teasers—what you see is the final downloadable file.











