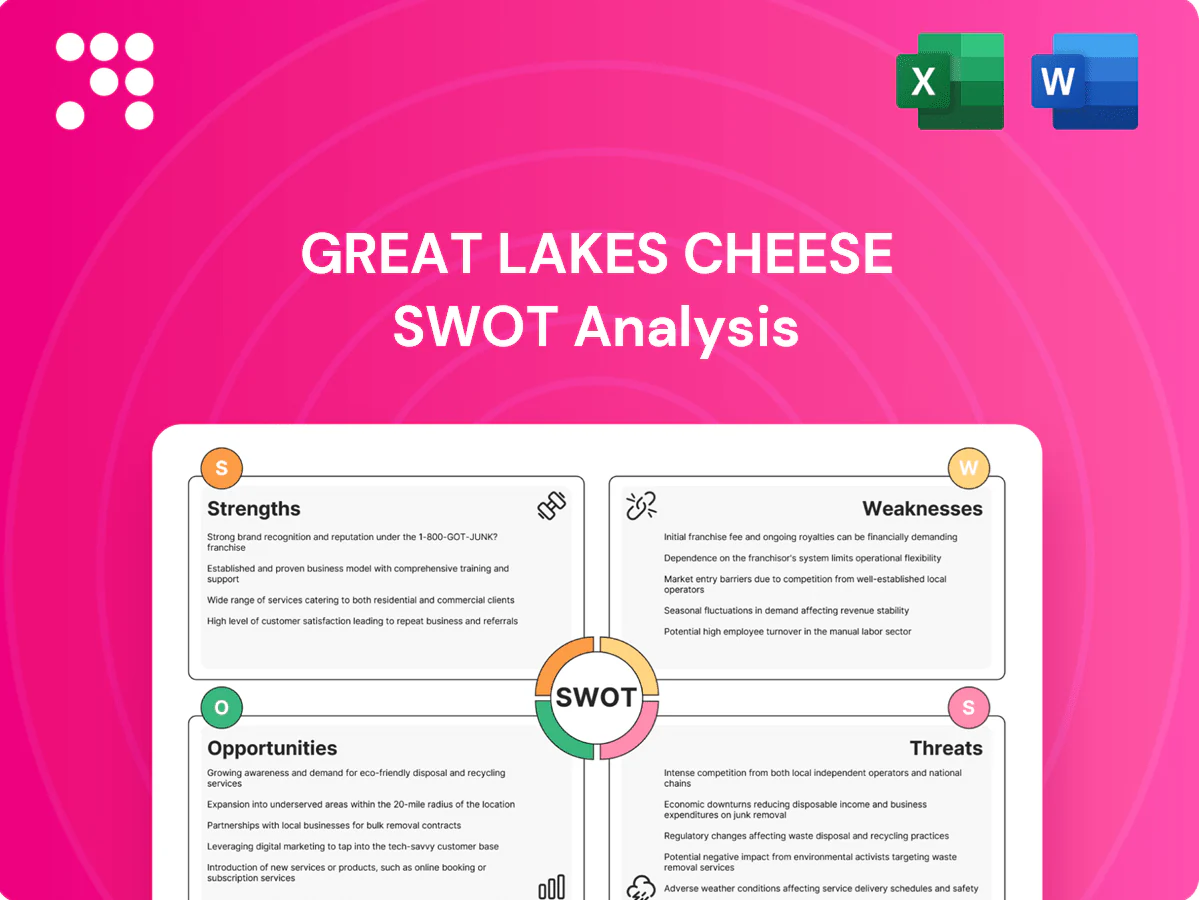
Great Lakes Cheese SWOT Analysis

Dive Deeper Into the Company’s Strategic Blueprint
Great Lakes Cheese's SWOT highlights strong regional brand recognition, supply-chain resilience, and product diversification, alongside margin pressures and regulatory risks. Want the full strategic picture with actionable insights and editable deliverables? Purchase the complete SWOT analysis to access a professional Word report and Excel matrix for planning and pitching.
Strengths

Scaled cheese conversion expertise
Great Lakes Cheese excels at converting bulk cheese into shreds, slices and snacks at scale, leveraging continuous lines that drive efficiency and consistency. This specialization reduces waste and enhances yield, supporting high-volume SKUs with cost-competitive output. The firm, founded in 1958, can pivot formats rapidly to meet retailer and foodservice needs, sustaining reliable supply for large contracts.
Diverse omnichannel customer base
Serving grocery, club, supercenter and foodservice spreads demand risk across segments, balancing retail seasonality with foodservice cycles and strengthening bargaining power with suppliers and logistics partners; U.S. retail cheese sales were approximately $33 billion in 2023 and private-label penetration in dairy categories is roughly 18–20%, supporting national distribution and private-label partnerships.

North American distribution footprint
Headquartered in Hiram, Ohio, Great Lakes Cheese leverages an extensive North American packaging, marketing and distribution network to serve retail and foodservice channels across the continent. Geographic reach boosts shelf availability and enables retailer-specific programs, reducing lead times through regional replenishment. Scale in logistics lowers per-unit costs and supports higher fill rates amid a US cheese market producing roughly 13 billion pounds in 2023.

Private label and value positioning
Great Lakes Cheese leverages packaging and conversion expertise to win retailer private-label and value-tier programs, creating sticky long-term contracts and high-volume runs that buffer revenue during premium-brand cyclicality. Retailers prize its dependable quality and on-time delivery at competitive prices, supporting repeat business and scale efficiencies. Private-label penetration in US grocery reached about 17% in 2023 (NielsenIQ), reinforcing demand for contract manufacturers.
- Strength: private-label specialization
- Benefit: long-term, high-volume contracts
- Resilience: hedges premium cyclicality
- Value: dependable delivery & competitive pricing
Operational efficiency and quality controls
Standardized cutting, shredding, and packaging processes at Great Lakes Cheese enhance food safety and product uniformity, while automation and line optimization lower labor per pound and reduce defects, supporting consistent retailer scorecards and enabling reinvestment of efficiency gains into pricing or expanded capacity.
- Standardization: consistent specs for retailer scorecards
- Automation: lower labor intensity, fewer defects
- Reinvestment: savings fund pricing or capacity
Cheese processor scales bulk-to-format; private-label 17–20%
Great Lakes Cheese converts bulk to value-added formats at scale, driving low per-unit costs and consistent quality; founded 1958, it serves retail and foodservice with rapid format pivots. Private-label specialization secures long-term high-volume contracts (private-label share ~17–20% in 2023) and leverages North American distribution amid US cheese production ~13B lbs and retail sales ~$33B (2023).
| Metric | 2023 |
|---|---|
| US cheese production | ~13B lbs |
| US retail sales | ~$33B |
| Private-label share | 17–20% |
| Founded | 1958 |
What is included in the product
 Detailed Word Document
Delivers a strategic overview of Great Lakes Cheese’s internal and external business factors, outlining strengths, weaknesses, opportunities, and threats to assess competitive position, growth drivers, operational gaps, and market risks shaping its future.

 Customizable Excel Spreadsheet
Provides a concise SWOT matrix tailored to Great Lakes Cheese for fast, visual strategy alignment. Editable format enables quick updates to pinpoint and resolve operational and market pain points.
Weaknesses

Limited brand equity
Reliance on private-label and contract packing limits Great Lakes Cheese consumer brand recognition, with private-label grocery share at about 18% in the US in 2023, reducing visibility versus national brands. This weakens pricing power versus branded competitors and constrains marketing-driven demand generation. Heavy dependence on retailer relationships raises customer-concentration risk, as top national grocers account for roughly 60% of supermarket sales.
Commodity margin exposure
Cheese input costs track volatile milk markets—U.S. Class III milk price swings have driven margin variability, with spreads compressing by as much as 15–20% in high-volatility periods. Contracts with pass-throughs help but timing mismatches between milk index moves and customer pricing can compress gross margins for weeks. Inventory revaluation amplifies P&L volatility, and hedging programs historically mitigate a majority of price moves but do not eliminate basis risk and residual exposure.

Capex-intensive operations
Processing lines, cold storage and food-safety systems require ongoing capital investment—often running into tens of millions over multi-year upgrade cycles—keeping Great Lakes Cheese capex-intensive. High fixed costs amplify sensitivity to volume shifts, so downtime or demand dips quickly pressure unit economics. Expansion must be sequenced carefully to avoid underutilization and preserve margins.

Product differentiation constraints
Converted cheese formats are widely viewed as interchangeable, driving price-based competition; US cheese production was about 13.7 billion pounds in 2023 (USDA), intensifying supply-side pressure and margin compression. Incremental innovation in packaging or blends is rapidly replicated by competitors, while customer loyalty is driven more by logistics and contract terms than brand affinity.
- Interchangeability → price competition
- 13.7 billion lbs US cheese (2023, USDA)
- Innovation incremental & quickly copied
- Operational not emotional customer loyalty
Exposure to retailer bargaining power
Great Lakes Cheese faces intense bargaining from large grocers and club stores—Top 4 U.S. grocers account for roughly 55% of grocery sales (2023)—forcing deeper discounts and tougher payment terms. Fees, chargebacks and service-level penalties routinely shave several percentage points off supplier margins, while vendor consolidation raises KPI demands and operational cost exposure. Contract renewals present recurring pricing risk as buyers press for lower cost and stricter terms.
- Buyer concentration: Top-4 ≈55% share (2023)
- Margin pressure: fees/chargebacks erode margins by multiple percentage points
- KPI squeeze: consolidation increases performance penalties
- Renewal risk: contracts prone to downward pricing
Private-label dependence and retailer concentration squeeze margins amid volatile milk prices
Reliance on private-label and contract packing limits brand recognition and pricing power; private-label share ~18% (US, 2023), concentrating sales with large retailers.
Milk-price volatility and inventory revaluation compress margins despite hedging, creating recurring P&L swings.
Capex-heavy operations and interchangeable products fuel price competition; US cheese supply ~13.7bn lbs (2023, USDA).
| Weakness | Key metric | 2023 |
|---|---|---|
| Private-label concentration | Private-label grocery share | ~18% |
| Buyer concentration | Top grocers share | ~55–60% |
| Supply pressure | US cheese production | 13.7 bn lbs |
Preview Before You Purchase
Great Lakes Cheese SWOT Analysis
This is the actual SWOT analysis document you’ll receive upon purchase—no surprises, just professional quality. The preview below is taken directly from the full SWOT report you'll get, and the complete, editable version is available after checkout. It covers strengths, weaknesses, opportunities and threats tailored to Great Lakes Cheese for strategic use.

Dive Deeper Into the Company’s Strategic Blueprint
Great Lakes Cheese's SWOT highlights strong regional brand recognition, supply-chain resilience, and product diversification, alongside margin pressures and regulatory risks. Want the full strategic picture with actionable insights and editable deliverables? Purchase the complete SWOT analysis to access a professional Word report and Excel matrix for planning and pitching.
Strengths
Scaled cheese conversion expertise
Great Lakes Cheese excels at converting bulk cheese into shreds, slices and snacks at scale, leveraging continuous lines that drive efficiency and consistency. This specialization reduces waste and enhances yield, supporting high-volume SKUs with cost-competitive output. The firm, founded in 1958, can pivot formats rapidly to meet retailer and foodservice needs, sustaining reliable supply for large contracts.
Diverse omnichannel customer base
Serving grocery, club, supercenter and foodservice spreads demand risk across segments, balancing retail seasonality with foodservice cycles and strengthening bargaining power with suppliers and logistics partners; U.S. retail cheese sales were approximately $33 billion in 2023 and private-label penetration in dairy categories is roughly 18–20%, supporting national distribution and private-label partnerships.
North American distribution footprint
Headquartered in Hiram, Ohio, Great Lakes Cheese leverages an extensive North American packaging, marketing and distribution network to serve retail and foodservice channels across the continent. Geographic reach boosts shelf availability and enables retailer-specific programs, reducing lead times through regional replenishment. Scale in logistics lowers per-unit costs and supports higher fill rates amid a US cheese market producing roughly 13 billion pounds in 2023.
Private label and value positioning
Great Lakes Cheese leverages packaging and conversion expertise to win retailer private-label and value-tier programs, creating sticky long-term contracts and high-volume runs that buffer revenue during premium-brand cyclicality. Retailers prize its dependable quality and on-time delivery at competitive prices, supporting repeat business and scale efficiencies. Private-label penetration in US grocery reached about 17% in 2023 (NielsenIQ), reinforcing demand for contract manufacturers.
- Strength: private-label specialization
- Benefit: long-term, high-volume contracts
- Resilience: hedges premium cyclicality
- Value: dependable delivery & competitive pricing
Operational efficiency and quality controls
Standardized cutting, shredding, and packaging processes at Great Lakes Cheese enhance food safety and product uniformity, while automation and line optimization lower labor per pound and reduce defects, supporting consistent retailer scorecards and enabling reinvestment of efficiency gains into pricing or expanded capacity.
- Standardization: consistent specs for retailer scorecards
- Automation: lower labor intensity, fewer defects
- Reinvestment: savings fund pricing or capacity
Cheese processor scales bulk-to-format; private-label 17–20%
Great Lakes Cheese converts bulk to value-added formats at scale, driving low per-unit costs and consistent quality; founded 1958, it serves retail and foodservice with rapid format pivots. Private-label specialization secures long-term high-volume contracts (private-label share ~17–20% in 2023) and leverages North American distribution amid US cheese production ~13B lbs and retail sales ~$33B (2023).
| Metric | 2023 |
|---|---|
| US cheese production | ~13B lbs |
| US retail sales | ~$33B |
| Private-label share | 17–20% |
| Founded | 1958 |
What is included in the product
Detailed Word Document
Delivers a strategic overview of Great Lakes Cheese’s internal and external business factors, outlining strengths, weaknesses, opportunities, and threats to assess competitive position, growth drivers, operational gaps, and market risks shaping its future.
Customizable Excel Spreadsheet
Provides a concise SWOT matrix tailored to Great Lakes Cheese for fast, visual strategy alignment. Editable format enables quick updates to pinpoint and resolve operational and market pain points.
Weaknesses
Limited brand equity
Reliance on private-label and contract packing limits Great Lakes Cheese consumer brand recognition, with private-label grocery share at about 18% in the US in 2023, reducing visibility versus national brands. This weakens pricing power versus branded competitors and constrains marketing-driven demand generation. Heavy dependence on retailer relationships raises customer-concentration risk, as top national grocers account for roughly 60% of supermarket sales.
Commodity margin exposure
Cheese input costs track volatile milk markets—U.S. Class III milk price swings have driven margin variability, with spreads compressing by as much as 15–20% in high-volatility periods. Contracts with pass-throughs help but timing mismatches between milk index moves and customer pricing can compress gross margins for weeks. Inventory revaluation amplifies P&L volatility, and hedging programs historically mitigate a majority of price moves but do not eliminate basis risk and residual exposure.
Capex-intensive operations
Processing lines, cold storage and food-safety systems require ongoing capital investment—often running into tens of millions over multi-year upgrade cycles—keeping Great Lakes Cheese capex-intensive. High fixed costs amplify sensitivity to volume shifts, so downtime or demand dips quickly pressure unit economics. Expansion must be sequenced carefully to avoid underutilization and preserve margins.
Product differentiation constraints
Converted cheese formats are widely viewed as interchangeable, driving price-based competition; US cheese production was about 13.7 billion pounds in 2023 (USDA), intensifying supply-side pressure and margin compression. Incremental innovation in packaging or blends is rapidly replicated by competitors, while customer loyalty is driven more by logistics and contract terms than brand affinity.
- Interchangeability → price competition
- 13.7 billion lbs US cheese (2023, USDA)
- Innovation incremental & quickly copied
- Operational not emotional customer loyalty
Exposure to retailer bargaining power
Great Lakes Cheese faces intense bargaining from large grocers and club stores—Top 4 U.S. grocers account for roughly 55% of grocery sales (2023)—forcing deeper discounts and tougher payment terms. Fees, chargebacks and service-level penalties routinely shave several percentage points off supplier margins, while vendor consolidation raises KPI demands and operational cost exposure. Contract renewals present recurring pricing risk as buyers press for lower cost and stricter terms.
- Buyer concentration: Top-4 ≈55% share (2023)
- Margin pressure: fees/chargebacks erode margins by multiple percentage points
- KPI squeeze: consolidation increases performance penalties
- Renewal risk: contracts prone to downward pricing
Private-label dependence and retailer concentration squeeze margins amid volatile milk prices
Reliance on private-label and contract packing limits brand recognition and pricing power; private-label share ~18% (US, 2023), concentrating sales with large retailers.
Milk-price volatility and inventory revaluation compress margins despite hedging, creating recurring P&L swings.
Capex-heavy operations and interchangeable products fuel price competition; US cheese supply ~13.7bn lbs (2023, USDA).
| Weakness | Key metric | 2023 |
|---|---|---|
| Private-label concentration | Private-label grocery share | ~18% |
| Buyer concentration | Top grocers share | ~55–60% |
| Supply pressure | US cheese production | 13.7 bn lbs |
Preview Before You Purchase
Great Lakes Cheese SWOT Analysis
This is the actual SWOT analysis document you’ll receive upon purchase—no surprises, just professional quality. The preview below is taken directly from the full SWOT report you'll get, and the complete, editable version is available after checkout. It covers strengths, weaknesses, opportunities and threats tailored to Great Lakes Cheese for strategic use.
Description
Dive Deeper Into the Company’s Strategic Blueprint
Great Lakes Cheese's SWOT highlights strong regional brand recognition, supply-chain resilience, and product diversification, alongside margin pressures and regulatory risks. Want the full strategic picture with actionable insights and editable deliverables? Purchase the complete SWOT analysis to access a professional Word report and Excel matrix for planning and pitching.
Strengths
Scaled cheese conversion expertise
Great Lakes Cheese excels at converting bulk cheese into shreds, slices and snacks at scale, leveraging continuous lines that drive efficiency and consistency. This specialization reduces waste and enhances yield, supporting high-volume SKUs with cost-competitive output. The firm, founded in 1958, can pivot formats rapidly to meet retailer and foodservice needs, sustaining reliable supply for large contracts.
Diverse omnichannel customer base
Serving grocery, club, supercenter and foodservice spreads demand risk across segments, balancing retail seasonality with foodservice cycles and strengthening bargaining power with suppliers and logistics partners; U.S. retail cheese sales were approximately $33 billion in 2023 and private-label penetration in dairy categories is roughly 18–20%, supporting national distribution and private-label partnerships.
North American distribution footprint
Headquartered in Hiram, Ohio, Great Lakes Cheese leverages an extensive North American packaging, marketing and distribution network to serve retail and foodservice channels across the continent. Geographic reach boosts shelf availability and enables retailer-specific programs, reducing lead times through regional replenishment. Scale in logistics lowers per-unit costs and supports higher fill rates amid a US cheese market producing roughly 13 billion pounds in 2023.
Private label and value positioning
Great Lakes Cheese leverages packaging and conversion expertise to win retailer private-label and value-tier programs, creating sticky long-term contracts and high-volume runs that buffer revenue during premium-brand cyclicality. Retailers prize its dependable quality and on-time delivery at competitive prices, supporting repeat business and scale efficiencies. Private-label penetration in US grocery reached about 17% in 2023 (NielsenIQ), reinforcing demand for contract manufacturers.
- Strength: private-label specialization
- Benefit: long-term, high-volume contracts
- Resilience: hedges premium cyclicality
- Value: dependable delivery & competitive pricing
Operational efficiency and quality controls
Standardized cutting, shredding, and packaging processes at Great Lakes Cheese enhance food safety and product uniformity, while automation and line optimization lower labor per pound and reduce defects, supporting consistent retailer scorecards and enabling reinvestment of efficiency gains into pricing or expanded capacity.
- Standardization: consistent specs for retailer scorecards
- Automation: lower labor intensity, fewer defects
- Reinvestment: savings fund pricing or capacity
Cheese processor scales bulk-to-format; private-label 17–20%
Great Lakes Cheese converts bulk to value-added formats at scale, driving low per-unit costs and consistent quality; founded 1958, it serves retail and foodservice with rapid format pivots. Private-label specialization secures long-term high-volume contracts (private-label share ~17–20% in 2023) and leverages North American distribution amid US cheese production ~13B lbs and retail sales ~$33B (2023).
| Metric | 2023 |
|---|---|
| US cheese production | ~13B lbs |
| US retail sales | ~$33B |
| Private-label share | 17–20% |
| Founded | 1958 |
What is included in the product
Detailed Word Document
Delivers a strategic overview of Great Lakes Cheese’s internal and external business factors, outlining strengths, weaknesses, opportunities, and threats to assess competitive position, growth drivers, operational gaps, and market risks shaping its future.
Customizable Excel Spreadsheet
Provides a concise SWOT matrix tailored to Great Lakes Cheese for fast, visual strategy alignment. Editable format enables quick updates to pinpoint and resolve operational and market pain points.
Weaknesses
Limited brand equity
Reliance on private-label and contract packing limits Great Lakes Cheese consumer brand recognition, with private-label grocery share at about 18% in the US in 2023, reducing visibility versus national brands. This weakens pricing power versus branded competitors and constrains marketing-driven demand generation. Heavy dependence on retailer relationships raises customer-concentration risk, as top national grocers account for roughly 60% of supermarket sales.
Commodity margin exposure
Cheese input costs track volatile milk markets—U.S. Class III milk price swings have driven margin variability, with spreads compressing by as much as 15–20% in high-volatility periods. Contracts with pass-throughs help but timing mismatches between milk index moves and customer pricing can compress gross margins for weeks. Inventory revaluation amplifies P&L volatility, and hedging programs historically mitigate a majority of price moves but do not eliminate basis risk and residual exposure.
Capex-intensive operations
Processing lines, cold storage and food-safety systems require ongoing capital investment—often running into tens of millions over multi-year upgrade cycles—keeping Great Lakes Cheese capex-intensive. High fixed costs amplify sensitivity to volume shifts, so downtime or demand dips quickly pressure unit economics. Expansion must be sequenced carefully to avoid underutilization and preserve margins.
Product differentiation constraints
Converted cheese formats are widely viewed as interchangeable, driving price-based competition; US cheese production was about 13.7 billion pounds in 2023 (USDA), intensifying supply-side pressure and margin compression. Incremental innovation in packaging or blends is rapidly replicated by competitors, while customer loyalty is driven more by logistics and contract terms than brand affinity.
- Interchangeability → price competition
- 13.7 billion lbs US cheese (2023, USDA)
- Innovation incremental & quickly copied
- Operational not emotional customer loyalty
Exposure to retailer bargaining power
Great Lakes Cheese faces intense bargaining from large grocers and club stores—Top 4 U.S. grocers account for roughly 55% of grocery sales (2023)—forcing deeper discounts and tougher payment terms. Fees, chargebacks and service-level penalties routinely shave several percentage points off supplier margins, while vendor consolidation raises KPI demands and operational cost exposure. Contract renewals present recurring pricing risk as buyers press for lower cost and stricter terms.
- Buyer concentration: Top-4 ≈55% share (2023)
- Margin pressure: fees/chargebacks erode margins by multiple percentage points
- KPI squeeze: consolidation increases performance penalties
- Renewal risk: contracts prone to downward pricing
Private-label dependence and retailer concentration squeeze margins amid volatile milk prices
Reliance on private-label and contract packing limits brand recognition and pricing power; private-label share ~18% (US, 2023), concentrating sales with large retailers.
Milk-price volatility and inventory revaluation compress margins despite hedging, creating recurring P&L swings.
Capex-heavy operations and interchangeable products fuel price competition; US cheese supply ~13.7bn lbs (2023, USDA).
| Weakness | Key metric | 2023 |
|---|---|---|
| Private-label concentration | Private-label grocery share | ~18% |
| Buyer concentration | Top grocers share | ~55–60% |
| Supply pressure | US cheese production | 13.7 bn lbs |
Preview Before You Purchase
Great Lakes Cheese SWOT Analysis
This is the actual SWOT analysis document you’ll receive upon purchase—no surprises, just professional quality. The preview below is taken directly from the full SWOT report you'll get, and the complete, editable version is available after checkout. It covers strengths, weaknesses, opportunities and threats tailored to Great Lakes Cheese for strategic use.











