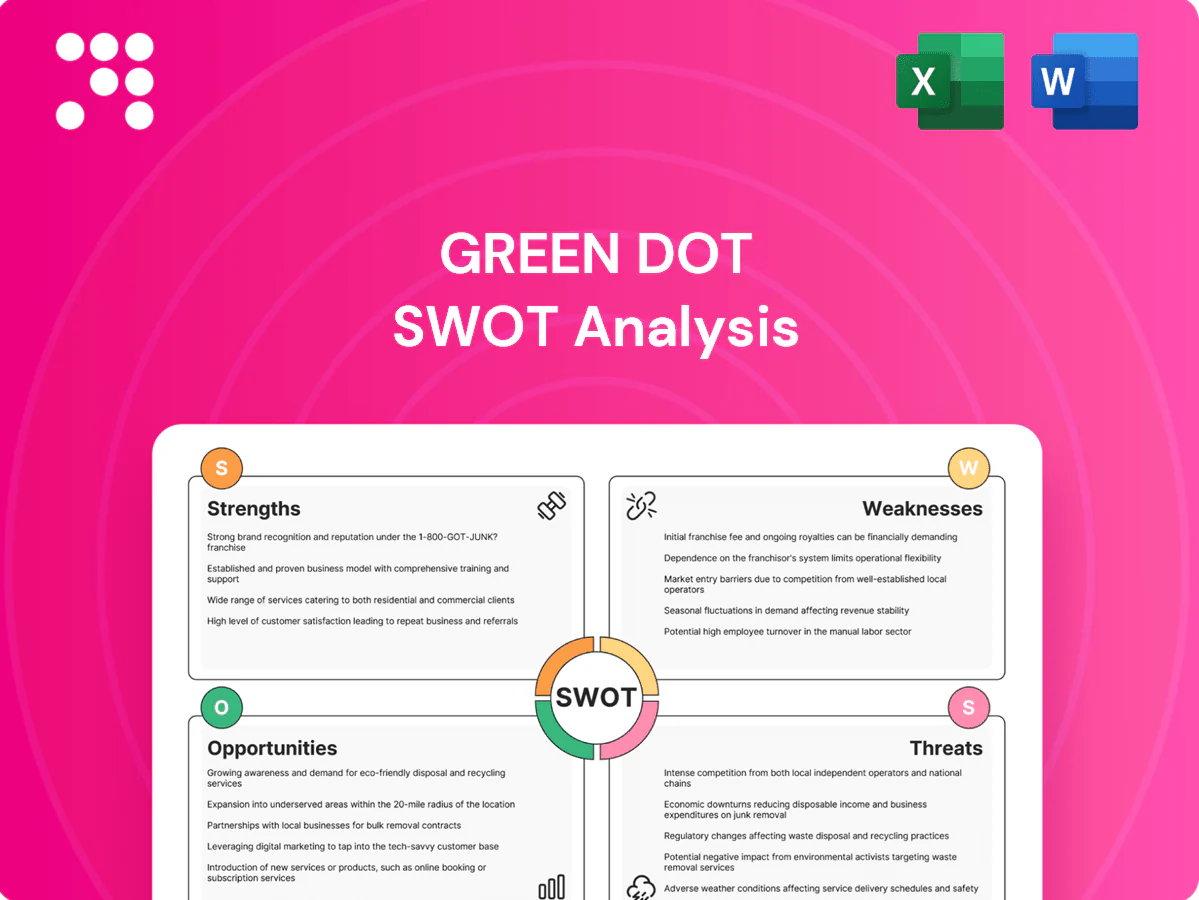
Green Dot SWOT Analysis

Make Insightful Decisions Backed by Expert Research
Green Dot’s SWOT analysis highlights its digital banking strengths, regulatory and competitive risks, and key opportunities in fintech partnerships and product diversification. Want the full story behind the company’s strengths, risks, and growth drivers? Purchase the complete SWOT analysis to gain a professionally written, fully editable report designed to support planning, pitches, and research.
Strengths

Owned bank and FDIC charter
Operating its own FDIC-insured bank gives Green Dot end-to-end control over product design, compliance, and unit economics by directly holding deposits and issuing cards under its charter.
This ownership eliminates dependence on third-party banks for core functions, enabling faster product iteration and closer regulatory alignment.
Direct charter control also strengthens trust with partners and consumers by reducing counterparty risk and centralizing risk management.
Scale in prepaid and cash reload
Green Dot is a leader in prepaid debit and cash reload networks serving underbanked users, with decades of market presence since its 1999 founding. Scale drives brand recognition, dense retail distribution and cost advantages across card issuance and reload services. The large transaction base generates rich data to refine risk models and product design, funneling customers into higher-value accounts and fee-bearing services.

Banking-as-a-Service platform
Green Dot's Banking-as-a-Service platform lets large brands embed banking services, expanding reach while avoiding heavy customer-acquisition costs; Green Dot reported BaaS revenue growth in FY2024, underscoring commercial traction.
Deep partner integrations create recurring, sticky revenue streams and predictable processing fees tied to account activity and interchange.
Multi-tenant infrastructure and established compliance expertise lower marginal costs and speed onboarding, raising switching costs for enterprise clients.

Deep retail and partner distribution
Deep retail and partner distribution — including marquee partners such as Walmart and CVS — provides Green Dot with broad customer acquisition channels and visible point-of-sale branding; its network spans tens of thousands of retail locations and complements digital onboarding for cash-heavy users. This omnichannel reach drives deposits and reloads in segments underserved by banks and is difficult for new entrants to replicate quickly.
- Marquee partners: Walmart, CVS
- Channel reach: tens of thousands of retail locations
- Strength: physical + digital onboarding
- Advantage: hard-to-replicate omnichannel access
Focus on underbanked segments
Serving underbanked and unbanked customers addresses a persistent market need: the FDIC 2021 survey found 4.5% unbanked and 14.5% underbanked, roughly 18 million households, creating long-term demand for accessible products. Green Dot’s cards emphasize cash acceptance, simple fee structures and branch-free access, driving loyalty and defensibility versus mainstream banks while aligning with public-policy goals and partner programs.
- Market need: FDIC 2021—4.5% unbanked, 14.5% underbanked
- Product focus: cash acceptance, simple fees, accessibility
- Competitive edge: customer loyalty and defensibility
- Policy/partnership fit: aligns with financial inclusion initiatives
FDIC-chartered fintech powers end-to-end deposits, card issuance and rapid BaaS growth
Green Dot’s FDIC-charter gives end-to-end control of deposits, card issuance and compliance, reducing counterparty risk and accelerating product iteration. Decades of prepaid leadership and marquee partners like Walmart and CVS deliver dense retail distribution and high brand recognition. BaaS growth in FY2024 and multi-tenant infrastructure create sticky, fee-bearing revenue and scale advantages.
| Metric | Value |
|---|---|
| Founded | 1999 |
| Retail reach | tens of thousands of locations |
| FDIC (2021) | 4.5% unbanked; 14.5% underbanked |
| BaaS | FY2024: reported revenue growth |
What is included in the product
 Detailed Word Document
Delivers a strategic overview of Green Dot’s internal and external business factors, outlining its strengths, weaknesses, opportunities, and threats to assess competitive position, growth drivers, and risk exposures.

 Customizable Excel Spreadsheet
Provides a focused SWOT matrix that quickly surfaces Green Dot’s key pain points and actionable opportunities, enabling rapid prioritization and targeted remediation for product, compliance, and market challenges.
Weaknesses

Revenue mix reliant on fees
Green Dot's revenue remains majority fee-driven, with interchange and account/service fees identified in its 2024 SEC filings as the principal revenue streams, making results sensitive to transaction volume and regulatory change. Competitive price pressure limits its ability to pass higher costs to customers, while fee-centric products have drawn increased scrutiny from consumer advocates. During downturns this mix can materially compress margins.
Partner concentration risk
Reliance on a few large retail and BaaS partners leaves Green Dot vulnerable: its top five partners accounted for roughly 50% of revenue as of 2024, so contract changes can materially swing results. Renegotiations can compress economics or volumes, reducing margins and fees. Loss of a key partner would impair customer acquisition and scale efficiencies and complicate forecasting and capital allocation.

Fraud and loss exposure
Prepaid and cash-heavy channels used by Green Dot inherently attract higher fraud risk, contributing to elevated charge-offs and remediation costs; industry card fraud reached about $32.4 billion in 2023 (Nilson Report), underscoring scale. Higher fraud losses increase operating expenses and strain customer service and compliance teams. Tighter controls can degrade user experience and conversion, so balancing security and accessibility remains an ongoing challenge.

Legacy tech and integration complexity
Green Dot's legacy tech and partner-specific stacks—supporting programs for Apple, Walmart, Uber and Intuit—drive technical debt and fragmentation. Heavy custom integrations slow time-to-market and elevate maintenance costs, reducing agility versus newer fintechs. Migration to modern modular stacks is costly and risky and impedes rapid feature parity despite Green Dot's >$1B annual revenue.
- Multiple partner stacks → technical debt
- Custom integrations → slower launches, higher O&M
- Migration risk/cost → delayed modernization
- Hinders feature parity with agile fintechs
Customer churn and limited ARPU
Underbanked customers tend to be price-sensitive and more transient, driving higher churn; Green Dot reported roughly $1.8B revenue in FY2024 across about 12M active accounts, implying modest ARPU versus full-service banks and premium fintechs. Elevated churn raises customer acquisition costs and compresses lifetime value, while monetization beyond basic spend and reload fees remains difficult given limited cross-sell depth.
- Price-sensitive, transient user base
- FY2024 revenue ~1.8B; ~12M active accounts
- Higher churn → ↑ acquisition cost, ↓ LTV
- Challenging monetization beyond basic spend
Fee-dependent fintech faces partner concentration and rising card-fraud costs
Green Dot remains fee-dependent (FY2024 revenue $1.8B) with sensitivity to transaction volumes and regulation; top five partners ~50% of revenue, raising concentration risk. Fraud exposure is material (industry card fraud $32.4B in 2023), increasing charge-offs and remediation costs. Legacy partner-specific tech stacks slow product velocity and raise O&M, while ARPU is modest (~$150 on 12M active accounts).
| Metric | Value |
|---|---|
| FY2024 revenue | $1.8B |
| Active accounts | ~12M |
| ARPU | ~$150 |
| Top-5 partner share | ~50% |
| Industry card fraud (2023) | $32.4B |
Same Document Delivered
Green Dot SWOT Analysis
This is the actual Green Dot SWOT analysis document you’ll receive upon purchase—no surprises, just professional quality. The preview below is taken directly from the full SWOT report you'll get, with strengths, weaknesses, opportunities and threats clearly laid out. Purchase unlocks the complete, editable version ready for download and use.

Make Insightful Decisions Backed by Expert Research
Green Dot’s SWOT analysis highlights its digital banking strengths, regulatory and competitive risks, and key opportunities in fintech partnerships and product diversification. Want the full story behind the company’s strengths, risks, and growth drivers? Purchase the complete SWOT analysis to gain a professionally written, fully editable report designed to support planning, pitches, and research.
Strengths
Owned bank and FDIC charter
Operating its own FDIC-insured bank gives Green Dot end-to-end control over product design, compliance, and unit economics by directly holding deposits and issuing cards under its charter.
This ownership eliminates dependence on third-party banks for core functions, enabling faster product iteration and closer regulatory alignment.
Direct charter control also strengthens trust with partners and consumers by reducing counterparty risk and centralizing risk management.
Scale in prepaid and cash reload
Green Dot is a leader in prepaid debit and cash reload networks serving underbanked users, with decades of market presence since its 1999 founding. Scale drives brand recognition, dense retail distribution and cost advantages across card issuance and reload services. The large transaction base generates rich data to refine risk models and product design, funneling customers into higher-value accounts and fee-bearing services.
Banking-as-a-Service platform
Green Dot's Banking-as-a-Service platform lets large brands embed banking services, expanding reach while avoiding heavy customer-acquisition costs; Green Dot reported BaaS revenue growth in FY2024, underscoring commercial traction.
Deep partner integrations create recurring, sticky revenue streams and predictable processing fees tied to account activity and interchange.
Multi-tenant infrastructure and established compliance expertise lower marginal costs and speed onboarding, raising switching costs for enterprise clients.
Deep retail and partner distribution
Deep retail and partner distribution — including marquee partners such as Walmart and CVS — provides Green Dot with broad customer acquisition channels and visible point-of-sale branding; its network spans tens of thousands of retail locations and complements digital onboarding for cash-heavy users. This omnichannel reach drives deposits and reloads in segments underserved by banks and is difficult for new entrants to replicate quickly.
- Marquee partners: Walmart, CVS
- Channel reach: tens of thousands of retail locations
- Strength: physical + digital onboarding
- Advantage: hard-to-replicate omnichannel access
Focus on underbanked segments
Serving underbanked and unbanked customers addresses a persistent market need: the FDIC 2021 survey found 4.5% unbanked and 14.5% underbanked, roughly 18 million households, creating long-term demand for accessible products. Green Dot’s cards emphasize cash acceptance, simple fee structures and branch-free access, driving loyalty and defensibility versus mainstream banks while aligning with public-policy goals and partner programs.
- Market need: FDIC 2021—4.5% unbanked, 14.5% underbanked
- Product focus: cash acceptance, simple fees, accessibility
- Competitive edge: customer loyalty and defensibility
- Policy/partnership fit: aligns with financial inclusion initiatives
FDIC-chartered fintech powers end-to-end deposits, card issuance and rapid BaaS growth
Green Dot’s FDIC-charter gives end-to-end control of deposits, card issuance and compliance, reducing counterparty risk and accelerating product iteration. Decades of prepaid leadership and marquee partners like Walmart and CVS deliver dense retail distribution and high brand recognition. BaaS growth in FY2024 and multi-tenant infrastructure create sticky, fee-bearing revenue and scale advantages.
| Metric | Value |
|---|---|
| Founded | 1999 |
| Retail reach | tens of thousands of locations |
| FDIC (2021) | 4.5% unbanked; 14.5% underbanked |
| BaaS | FY2024: reported revenue growth |
What is included in the product
Detailed Word Document
Delivers a strategic overview of Green Dot’s internal and external business factors, outlining its strengths, weaknesses, opportunities, and threats to assess competitive position, growth drivers, and risk exposures.
Customizable Excel Spreadsheet
Provides a focused SWOT matrix that quickly surfaces Green Dot’s key pain points and actionable opportunities, enabling rapid prioritization and targeted remediation for product, compliance, and market challenges.
Weaknesses
Revenue mix reliant on fees
Green Dot's revenue remains majority fee-driven, with interchange and account/service fees identified in its 2024 SEC filings as the principal revenue streams, making results sensitive to transaction volume and regulatory change. Competitive price pressure limits its ability to pass higher costs to customers, while fee-centric products have drawn increased scrutiny from consumer advocates. During downturns this mix can materially compress margins.
Partner concentration risk
Reliance on a few large retail and BaaS partners leaves Green Dot vulnerable: its top five partners accounted for roughly 50% of revenue as of 2024, so contract changes can materially swing results. Renegotiations can compress economics or volumes, reducing margins and fees. Loss of a key partner would impair customer acquisition and scale efficiencies and complicate forecasting and capital allocation.
Fraud and loss exposure
Prepaid and cash-heavy channels used by Green Dot inherently attract higher fraud risk, contributing to elevated charge-offs and remediation costs; industry card fraud reached about $32.4 billion in 2023 (Nilson Report), underscoring scale. Higher fraud losses increase operating expenses and strain customer service and compliance teams. Tighter controls can degrade user experience and conversion, so balancing security and accessibility remains an ongoing challenge.
Legacy tech and integration complexity
Green Dot's legacy tech and partner-specific stacks—supporting programs for Apple, Walmart, Uber and Intuit—drive technical debt and fragmentation. Heavy custom integrations slow time-to-market and elevate maintenance costs, reducing agility versus newer fintechs. Migration to modern modular stacks is costly and risky and impedes rapid feature parity despite Green Dot's >$1B annual revenue.
- Multiple partner stacks → technical debt
- Custom integrations → slower launches, higher O&M
- Migration risk/cost → delayed modernization
- Hinders feature parity with agile fintechs
Customer churn and limited ARPU
Underbanked customers tend to be price-sensitive and more transient, driving higher churn; Green Dot reported roughly $1.8B revenue in FY2024 across about 12M active accounts, implying modest ARPU versus full-service banks and premium fintechs. Elevated churn raises customer acquisition costs and compresses lifetime value, while monetization beyond basic spend and reload fees remains difficult given limited cross-sell depth.
- Price-sensitive, transient user base
- FY2024 revenue ~1.8B; ~12M active accounts
- Higher churn → ↑ acquisition cost, ↓ LTV
- Challenging monetization beyond basic spend
Fee-dependent fintech faces partner concentration and rising card-fraud costs
Green Dot remains fee-dependent (FY2024 revenue $1.8B) with sensitivity to transaction volumes and regulation; top five partners ~50% of revenue, raising concentration risk. Fraud exposure is material (industry card fraud $32.4B in 2023), increasing charge-offs and remediation costs. Legacy partner-specific tech stacks slow product velocity and raise O&M, while ARPU is modest (~$150 on 12M active accounts).
| Metric | Value |
|---|---|
| FY2024 revenue | $1.8B |
| Active accounts | ~12M |
| ARPU | ~$150 |
| Top-5 partner share | ~50% |
| Industry card fraud (2023) | $32.4B |
Same Document Delivered
Green Dot SWOT Analysis
This is the actual Green Dot SWOT analysis document you’ll receive upon purchase—no surprises, just professional quality. The preview below is taken directly from the full SWOT report you'll get, with strengths, weaknesses, opportunities and threats clearly laid out. Purchase unlocks the complete, editable version ready for download and use.
Original: $10.00
-65%$10.00
$3.50Description
Make Insightful Decisions Backed by Expert Research
Green Dot’s SWOT analysis highlights its digital banking strengths, regulatory and competitive risks, and key opportunities in fintech partnerships and product diversification. Want the full story behind the company’s strengths, risks, and growth drivers? Purchase the complete SWOT analysis to gain a professionally written, fully editable report designed to support planning, pitches, and research.
Strengths
Owned bank and FDIC charter
Operating its own FDIC-insured bank gives Green Dot end-to-end control over product design, compliance, and unit economics by directly holding deposits and issuing cards under its charter.
This ownership eliminates dependence on third-party banks for core functions, enabling faster product iteration and closer regulatory alignment.
Direct charter control also strengthens trust with partners and consumers by reducing counterparty risk and centralizing risk management.
Scale in prepaid and cash reload
Green Dot is a leader in prepaid debit and cash reload networks serving underbanked users, with decades of market presence since its 1999 founding. Scale drives brand recognition, dense retail distribution and cost advantages across card issuance and reload services. The large transaction base generates rich data to refine risk models and product design, funneling customers into higher-value accounts and fee-bearing services.
Banking-as-a-Service platform
Green Dot's Banking-as-a-Service platform lets large brands embed banking services, expanding reach while avoiding heavy customer-acquisition costs; Green Dot reported BaaS revenue growth in FY2024, underscoring commercial traction.
Deep partner integrations create recurring, sticky revenue streams and predictable processing fees tied to account activity and interchange.
Multi-tenant infrastructure and established compliance expertise lower marginal costs and speed onboarding, raising switching costs for enterprise clients.
Deep retail and partner distribution
Deep retail and partner distribution — including marquee partners such as Walmart and CVS — provides Green Dot with broad customer acquisition channels and visible point-of-sale branding; its network spans tens of thousands of retail locations and complements digital onboarding for cash-heavy users. This omnichannel reach drives deposits and reloads in segments underserved by banks and is difficult for new entrants to replicate quickly.
- Marquee partners: Walmart, CVS
- Channel reach: tens of thousands of retail locations
- Strength: physical + digital onboarding
- Advantage: hard-to-replicate omnichannel access
Focus on underbanked segments
Serving underbanked and unbanked customers addresses a persistent market need: the FDIC 2021 survey found 4.5% unbanked and 14.5% underbanked, roughly 18 million households, creating long-term demand for accessible products. Green Dot’s cards emphasize cash acceptance, simple fee structures and branch-free access, driving loyalty and defensibility versus mainstream banks while aligning with public-policy goals and partner programs.
- Market need: FDIC 2021—4.5% unbanked, 14.5% underbanked
- Product focus: cash acceptance, simple fees, accessibility
- Competitive edge: customer loyalty and defensibility
- Policy/partnership fit: aligns with financial inclusion initiatives
FDIC-chartered fintech powers end-to-end deposits, card issuance and rapid BaaS growth
Green Dot’s FDIC-charter gives end-to-end control of deposits, card issuance and compliance, reducing counterparty risk and accelerating product iteration. Decades of prepaid leadership and marquee partners like Walmart and CVS deliver dense retail distribution and high brand recognition. BaaS growth in FY2024 and multi-tenant infrastructure create sticky, fee-bearing revenue and scale advantages.
| Metric | Value |
|---|---|
| Founded | 1999 |
| Retail reach | tens of thousands of locations |
| FDIC (2021) | 4.5% unbanked; 14.5% underbanked |
| BaaS | FY2024: reported revenue growth |
What is included in the product
Detailed Word Document
Delivers a strategic overview of Green Dot’s internal and external business factors, outlining its strengths, weaknesses, opportunities, and threats to assess competitive position, growth drivers, and risk exposures.
Customizable Excel Spreadsheet
Provides a focused SWOT matrix that quickly surfaces Green Dot’s key pain points and actionable opportunities, enabling rapid prioritization and targeted remediation for product, compliance, and market challenges.
Weaknesses
Revenue mix reliant on fees
Green Dot's revenue remains majority fee-driven, with interchange and account/service fees identified in its 2024 SEC filings as the principal revenue streams, making results sensitive to transaction volume and regulatory change. Competitive price pressure limits its ability to pass higher costs to customers, while fee-centric products have drawn increased scrutiny from consumer advocates. During downturns this mix can materially compress margins.
Partner concentration risk
Reliance on a few large retail and BaaS partners leaves Green Dot vulnerable: its top five partners accounted for roughly 50% of revenue as of 2024, so contract changes can materially swing results. Renegotiations can compress economics or volumes, reducing margins and fees. Loss of a key partner would impair customer acquisition and scale efficiencies and complicate forecasting and capital allocation.
Fraud and loss exposure
Prepaid and cash-heavy channels used by Green Dot inherently attract higher fraud risk, contributing to elevated charge-offs and remediation costs; industry card fraud reached about $32.4 billion in 2023 (Nilson Report), underscoring scale. Higher fraud losses increase operating expenses and strain customer service and compliance teams. Tighter controls can degrade user experience and conversion, so balancing security and accessibility remains an ongoing challenge.
Legacy tech and integration complexity
Green Dot's legacy tech and partner-specific stacks—supporting programs for Apple, Walmart, Uber and Intuit—drive technical debt and fragmentation. Heavy custom integrations slow time-to-market and elevate maintenance costs, reducing agility versus newer fintechs. Migration to modern modular stacks is costly and risky and impedes rapid feature parity despite Green Dot's >$1B annual revenue.
- Multiple partner stacks → technical debt
- Custom integrations → slower launches, higher O&M
- Migration risk/cost → delayed modernization
- Hinders feature parity with agile fintechs
Customer churn and limited ARPU
Underbanked customers tend to be price-sensitive and more transient, driving higher churn; Green Dot reported roughly $1.8B revenue in FY2024 across about 12M active accounts, implying modest ARPU versus full-service banks and premium fintechs. Elevated churn raises customer acquisition costs and compresses lifetime value, while monetization beyond basic spend and reload fees remains difficult given limited cross-sell depth.
- Price-sensitive, transient user base
- FY2024 revenue ~1.8B; ~12M active accounts
- Higher churn → ↑ acquisition cost, ↓ LTV
- Challenging monetization beyond basic spend
Fee-dependent fintech faces partner concentration and rising card-fraud costs
Green Dot remains fee-dependent (FY2024 revenue $1.8B) with sensitivity to transaction volumes and regulation; top five partners ~50% of revenue, raising concentration risk. Fraud exposure is material (industry card fraud $32.4B in 2023), increasing charge-offs and remediation costs. Legacy partner-specific tech stacks slow product velocity and raise O&M, while ARPU is modest (~$150 on 12M active accounts).
| Metric | Value |
|---|---|
| FY2024 revenue | $1.8B |
| Active accounts | ~12M |
| ARPU | ~$150 |
| Top-5 partner share | ~50% |
| Industry card fraud (2023) | $32.4B |
Same Document Delivered
Green Dot SWOT Analysis
This is the actual Green Dot SWOT analysis document you’ll receive upon purchase—no surprises, just professional quality. The preview below is taken directly from the full SWOT report you'll get, with strengths, weaknesses, opportunities and threats clearly laid out. Purchase unlocks the complete, editable version ready for download and use.











