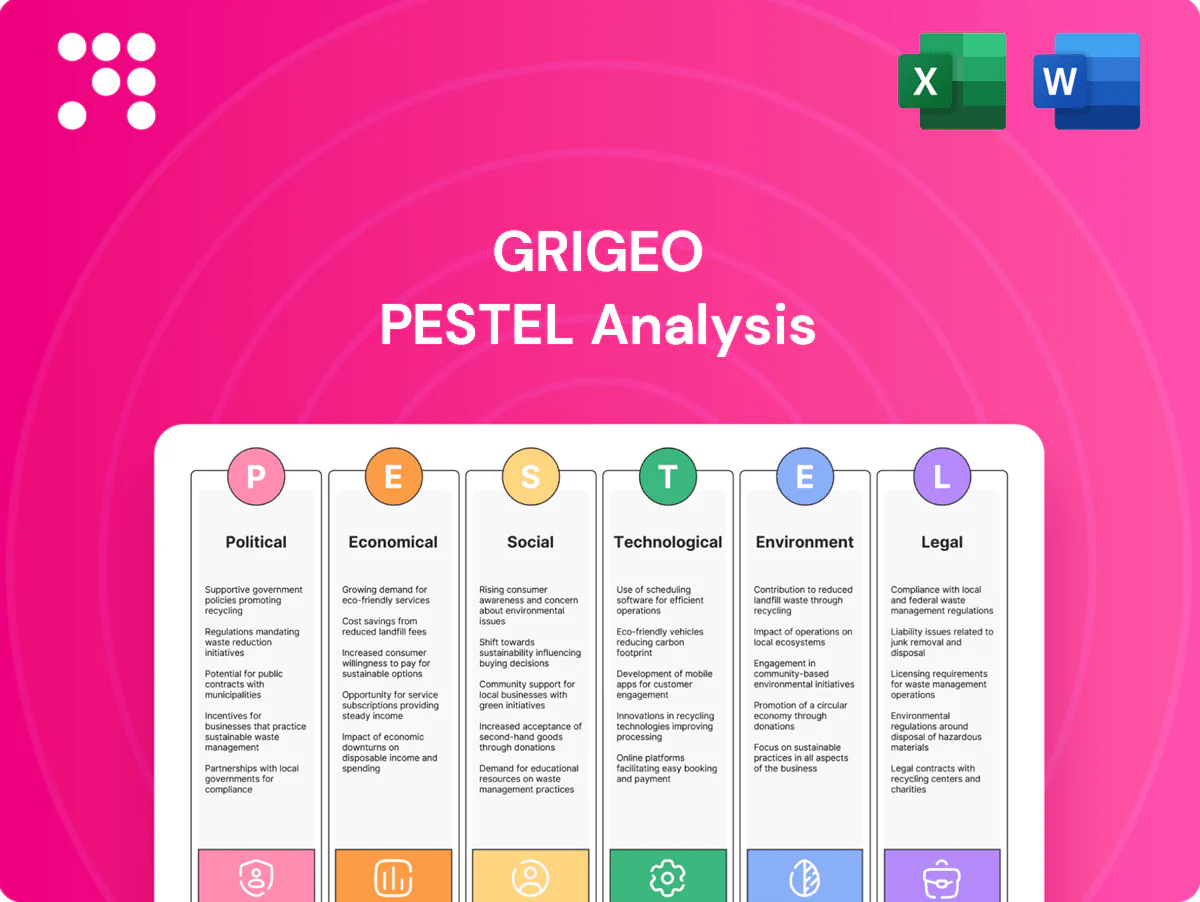
Grigeo PESTLE Analysis

Skip the Research. Get the Strategy.
Unlock strategic clarity with our PESTLE Analysis of Grigeo—three to five concise insights into political, economic, social, technological, legal, and environmental forces shaping the company. This ready-to-use report highlights risks and growth levers for investors and strategists. Purchase the full analysis for the complete, actionable breakdown and downloadable formats.
Political factors

EU Green Deal direction
The EU Green Deal steers industrial policy toward low-carbon manufacturing and circularity (Fit for 55: ≥55% GHG reduction by 2030), so Grigeo must align CAPEX to access EU support (Just Transition Fund ~€17.5bn, LIFE ~€5.4bn) and benefit from circular-economy incentives while avoiding stricter benchmarks.
Policy stability aids multi‑year planning, but tightening targets and an EU ETS at roughly €90/t CO2e (2024) can raise compliance costs; active engagement in EU consultations improves chances to shape feasible transition timelines.
Baltic geopolitical exposure
Baltic proximity to Russia/Belarus elevates regional risk perceptions and trade frictions after Russia's 2022 invasion of Ukraine; EU sanctions since 2022 target energy and timber sectors. Lithuania stopped Russian gas imports in 2022, forcing diversified sourcing and logistics. Insurance and transport premiums rose during 2022–23 tensions. Developing corridors via Scandinavia and Western Europe reduces single-route exposure.

Industrial and export incentives
Lithuania and neighboring states actively promote manufacturing upgrades and exports via national schemes and EU programs such as Horizon Europe (budget €95.5bn) and the Recovery and Resilience Facility (€723.8bn), which fund energy efficiency, automation and R&D.
Grants and tax incentives at national and EU level reduce project capex and operating costs, often co-financing investments in Industry 4.0 and decarbonisation.
Accessing these programs requires rigorous project justification and reporting; timely, well-documented applications can materially shorten capex payback timelines.

Public procurement priorities
Government buyers increasingly prioritize sustainable packaging and hygiene supplies, driven by the EU Green Deal and the fact that public procurement represents about 14% of EU GDP, raising tender volume for compliant suppliers. Compliance with recognized ecolabels (EU Ecolabel, FSC) can unlock public tenders where documented environmental performance often beats lowest-price bids. Long-term public contracts provide volume stability across economic cycles, favoring suppliers with certified sustainability systems and predictable cost structures.
- Public procurement ≈14% of EU GDP
- Ecolabel compliance unlocks tenders (EU Ecolabel, FSC)
- Price-quality favors documented environmental performance
- Long-term contracts stabilize volumes
Trade policy and standards alignment
EU single market harmonized product and sustainability standards, covering ~447 million consumers (2024), raise entry thresholds for Grigeo but enable scale advantages; divergence in third-country rules directly reduces export competitiveness and can trigger non-tariff barriers. Mutual recognition regimes ease market entry, yet administrative documentation and compliance checks have risen, increasing time-to-market and costs. A strategic certification portfolio (CE, FSC, ISO) underpins multi-market reach.
- EU market size: ~447M consumers (2024)
- Harmonized rules: essential for scale access
- Divergence: increases non-tariff barriers
- Mutual recognition: lowers tariffs but not paperwork
- Certifications: CE, FSC, ISO vital for exports
Align CAPEX to EU Green Deal to access Just Transition/LIFE funds; mitigate €90/t ETS
EU Green Deal and Fit for 55 force Grigeo to align CAPEX with decarbonisation to access funds (Just Transition €17.5bn; LIFE €5.4bn) and avoid stricter standards.
EU ETS ≈€90/t CO2e (2024) raises compliance costs; active policy engagement can shape timelines.
Regional risks after Russia’s 2022 invasion increased transport/insurance costs and pushed supply diversification.
Public procurement ≈14% of EU GDP (2024); ecolabels (EU Ecolabel, FSC) unlock tenders.
| Metric | Value |
|---|---|
| EU market (2024) | ~447M consumers |
| EU ETS price (2024) | ~€90/t CO2e |
| RRF budget | €723.8bn |
What is included in the product
 Detailed Word Document
Explores how Political, Economic, Social, Technological, Environmental and Legal forces uniquely impact Grigeo, with data-backed trends, actionable insights, and scenario-focused recommendations tailored for executives, investors and consultants to identify risks, opportunities and strategic responses.

 Customizable Excel Spreadsheet
A concise, visually segmented Grigeo PESTLE summary that’s easy to drop into presentations, share across teams, and annotate with region- or business-specific notes to streamline planning, risk discussions, and decision-making.
Economic factors

Energy price volatility
Pulp, paper and board are energy-intensive: CEPI notes energy represents about 20% of production costs in the EU paper sector, making Grigeo margins sensitive to electricity and gas swings. Hedging and on-site renewables (solar/biomass) and long-term contracts have cut price exposure for mills by double-digit percentages in recent years. IEA analysis shows efficiency upgrades often yield paybacks within 2–4 years during price spikes, while flexible pricing clauses enable pass-through of most cost increases to customers.
Timber and pulp supply dynamics
Regional fiber availability and 210 million t/yr global pulp cycles drive input cost swings, with benchmark softwood pulp volatility affecting margins. Certification (FSC/PEFC) across ~500 million ha and traceability restrict low‑cost sources but secure export markets. Long‑term supplier contracts smooth price shocks, while expanding recycling—EU paper recycling ~72% (2022)—cuts virgin fiber dependence.

Packaging demand cycles
Rising e-commerce supports corrugated demand—global online retail sales reached about USD 5.7 trillion in 2023 (eMarketer), boosting box volumes even as industrial slowdowns can soften B2B shipments. Product-mix optimization cushions cyclicality by shifting capacity toward FMCG and e-tail clients. Value-added designs and lightweighting protect pricing while export diversification reduces reliance on any single domestic sector.

Currency fluctuations
Grigeo benefits from euro exposure—Lithuania adopted the euro in 2015 and the currency is legal tender in 20 EU states—stabilizing regional trade, but sales to non-euro markets create FX risk. Prudent hedging protects cash flows; sourcing and sales in the same currency create natural hedges and transparent surcharge mechanisms help maintain margins.
Inflation and wage pressures
Tight Baltic labor markets pushed nominal wages roughly 10% YoY in 2024, raising unit costs for Grigeo; automation and targeted training improved productivity per employee, cutting labor cost per ton by about 6% in 2024. Inflation-indexed contracts (CPI ~4% in 2024) helped preserve margins while lean initiatives contained overhead creep.
- Wage rise: ~10% YoY (2024)
- Productivity gain: ~6% lower labor cost/ton (2024)
- Indexation: CPI ~4% (2024)
- Lean measures: offsetting overhead creep
Align CAPEX to EU Green Deal to access Just Transition/LIFE funds; mitigate €90/t ETS
Energy represents ~20% of paper costs making Grigeo sensitive to electricity/gas swings; on-site renewables and hedges have cut exposure. EU recycling ~72% (2022) and global pulp cycles drive fiber costs, while e‑commerce (USD 5.7T in 2023) supports corrugated demand. Baltic wages rose ~10% (2024) but automation cut labor cost/ton ~6% and CPI ~4% (2024).
Preview the Actual Deliverable
Grigeo PESTLE Analysis
The Grigeo PESTLE Analysis preview shown here is the exact document you’ll receive after purchase—fully formatted and ready to use. This is a real screenshot of the product, delivered exactly as shown with no placeholders or surprises. The layout, content, and structure visible here are exactly what you’ll download immediately after buying.

Skip the Research. Get the Strategy.
Unlock strategic clarity with our PESTLE Analysis of Grigeo—three to five concise insights into political, economic, social, technological, legal, and environmental forces shaping the company. This ready-to-use report highlights risks and growth levers for investors and strategists. Purchase the full analysis for the complete, actionable breakdown and downloadable formats.
Political factors
EU Green Deal direction
The EU Green Deal steers industrial policy toward low-carbon manufacturing and circularity (Fit for 55: ≥55% GHG reduction by 2030), so Grigeo must align CAPEX to access EU support (Just Transition Fund ~€17.5bn, LIFE ~€5.4bn) and benefit from circular-economy incentives while avoiding stricter benchmarks.
Policy stability aids multi‑year planning, but tightening targets and an EU ETS at roughly €90/t CO2e (2024) can raise compliance costs; active engagement in EU consultations improves chances to shape feasible transition timelines.
Baltic geopolitical exposure
Baltic proximity to Russia/Belarus elevates regional risk perceptions and trade frictions after Russia's 2022 invasion of Ukraine; EU sanctions since 2022 target energy and timber sectors. Lithuania stopped Russian gas imports in 2022, forcing diversified sourcing and logistics. Insurance and transport premiums rose during 2022–23 tensions. Developing corridors via Scandinavia and Western Europe reduces single-route exposure.
Industrial and export incentives
Lithuania and neighboring states actively promote manufacturing upgrades and exports via national schemes and EU programs such as Horizon Europe (budget €95.5bn) and the Recovery and Resilience Facility (€723.8bn), which fund energy efficiency, automation and R&D.
Grants and tax incentives at national and EU level reduce project capex and operating costs, often co-financing investments in Industry 4.0 and decarbonisation.
Accessing these programs requires rigorous project justification and reporting; timely, well-documented applications can materially shorten capex payback timelines.
Public procurement priorities
Government buyers increasingly prioritize sustainable packaging and hygiene supplies, driven by the EU Green Deal and the fact that public procurement represents about 14% of EU GDP, raising tender volume for compliant suppliers. Compliance with recognized ecolabels (EU Ecolabel, FSC) can unlock public tenders where documented environmental performance often beats lowest-price bids. Long-term public contracts provide volume stability across economic cycles, favoring suppliers with certified sustainability systems and predictable cost structures.
- Public procurement ≈14% of EU GDP
- Ecolabel compliance unlocks tenders (EU Ecolabel, FSC)
- Price-quality favors documented environmental performance
- Long-term contracts stabilize volumes
Trade policy and standards alignment
EU single market harmonized product and sustainability standards, covering ~447 million consumers (2024), raise entry thresholds for Grigeo but enable scale advantages; divergence in third-country rules directly reduces export competitiveness and can trigger non-tariff barriers. Mutual recognition regimes ease market entry, yet administrative documentation and compliance checks have risen, increasing time-to-market and costs. A strategic certification portfolio (CE, FSC, ISO) underpins multi-market reach.
- EU market size: ~447M consumers (2024)
- Harmonized rules: essential for scale access
- Divergence: increases non-tariff barriers
- Mutual recognition: lowers tariffs but not paperwork
- Certifications: CE, FSC, ISO vital for exports
Align CAPEX to EU Green Deal to access Just Transition/LIFE funds; mitigate €90/t ETS
EU Green Deal and Fit for 55 force Grigeo to align CAPEX with decarbonisation to access funds (Just Transition €17.5bn; LIFE €5.4bn) and avoid stricter standards.
EU ETS ≈€90/t CO2e (2024) raises compliance costs; active policy engagement can shape timelines.
Regional risks after Russia’s 2022 invasion increased transport/insurance costs and pushed supply diversification.
Public procurement ≈14% of EU GDP (2024); ecolabels (EU Ecolabel, FSC) unlock tenders.
| Metric | Value |
|---|---|
| EU market (2024) | ~447M consumers |
| EU ETS price (2024) | ~€90/t CO2e |
| RRF budget | €723.8bn |
What is included in the product
Detailed Word Document
Explores how Political, Economic, Social, Technological, Environmental and Legal forces uniquely impact Grigeo, with data-backed trends, actionable insights, and scenario-focused recommendations tailored for executives, investors and consultants to identify risks, opportunities and strategic responses.
Customizable Excel Spreadsheet
A concise, visually segmented Grigeo PESTLE summary that’s easy to drop into presentations, share across teams, and annotate with region- or business-specific notes to streamline planning, risk discussions, and decision-making.
Economic factors
Energy price volatility
Pulp, paper and board are energy-intensive: CEPI notes energy represents about 20% of production costs in the EU paper sector, making Grigeo margins sensitive to electricity and gas swings. Hedging and on-site renewables (solar/biomass) and long-term contracts have cut price exposure for mills by double-digit percentages in recent years. IEA analysis shows efficiency upgrades often yield paybacks within 2–4 years during price spikes, while flexible pricing clauses enable pass-through of most cost increases to customers.
Timber and pulp supply dynamics
Regional fiber availability and 210 million t/yr global pulp cycles drive input cost swings, with benchmark softwood pulp volatility affecting margins. Certification (FSC/PEFC) across ~500 million ha and traceability restrict low‑cost sources but secure export markets. Long‑term supplier contracts smooth price shocks, while expanding recycling—EU paper recycling ~72% (2022)—cuts virgin fiber dependence.
Packaging demand cycles
Rising e-commerce supports corrugated demand—global online retail sales reached about USD 5.7 trillion in 2023 (eMarketer), boosting box volumes even as industrial slowdowns can soften B2B shipments. Product-mix optimization cushions cyclicality by shifting capacity toward FMCG and e-tail clients. Value-added designs and lightweighting protect pricing while export diversification reduces reliance on any single domestic sector.
Currency fluctuations
Grigeo benefits from euro exposure—Lithuania adopted the euro in 2015 and the currency is legal tender in 20 EU states—stabilizing regional trade, but sales to non-euro markets create FX risk. Prudent hedging protects cash flows; sourcing and sales in the same currency create natural hedges and transparent surcharge mechanisms help maintain margins.
Inflation and wage pressures
Tight Baltic labor markets pushed nominal wages roughly 10% YoY in 2024, raising unit costs for Grigeo; automation and targeted training improved productivity per employee, cutting labor cost per ton by about 6% in 2024. Inflation-indexed contracts (CPI ~4% in 2024) helped preserve margins while lean initiatives contained overhead creep.
- Wage rise: ~10% YoY (2024)
- Productivity gain: ~6% lower labor cost/ton (2024)
- Indexation: CPI ~4% (2024)
- Lean measures: offsetting overhead creep
Align CAPEX to EU Green Deal to access Just Transition/LIFE funds; mitigate €90/t ETS
Energy represents ~20% of paper costs making Grigeo sensitive to electricity/gas swings; on-site renewables and hedges have cut exposure. EU recycling ~72% (2022) and global pulp cycles drive fiber costs, while e‑commerce (USD 5.7T in 2023) supports corrugated demand. Baltic wages rose ~10% (2024) but automation cut labor cost/ton ~6% and CPI ~4% (2024).
Preview the Actual Deliverable
Grigeo PESTLE Analysis
The Grigeo PESTLE Analysis preview shown here is the exact document you’ll receive after purchase—fully formatted and ready to use. This is a real screenshot of the product, delivered exactly as shown with no placeholders or surprises. The layout, content, and structure visible here are exactly what you’ll download immediately after buying.
Original: $10.00
-65%$10.00
$3.50Description
Skip the Research. Get the Strategy.
Unlock strategic clarity with our PESTLE Analysis of Grigeo—three to five concise insights into political, economic, social, technological, legal, and environmental forces shaping the company. This ready-to-use report highlights risks and growth levers for investors and strategists. Purchase the full analysis for the complete, actionable breakdown and downloadable formats.
Political factors
EU Green Deal direction
The EU Green Deal steers industrial policy toward low-carbon manufacturing and circularity (Fit for 55: ≥55% GHG reduction by 2030), so Grigeo must align CAPEX to access EU support (Just Transition Fund ~€17.5bn, LIFE ~€5.4bn) and benefit from circular-economy incentives while avoiding stricter benchmarks.
Policy stability aids multi‑year planning, but tightening targets and an EU ETS at roughly €90/t CO2e (2024) can raise compliance costs; active engagement in EU consultations improves chances to shape feasible transition timelines.
Baltic geopolitical exposure
Baltic proximity to Russia/Belarus elevates regional risk perceptions and trade frictions after Russia's 2022 invasion of Ukraine; EU sanctions since 2022 target energy and timber sectors. Lithuania stopped Russian gas imports in 2022, forcing diversified sourcing and logistics. Insurance and transport premiums rose during 2022–23 tensions. Developing corridors via Scandinavia and Western Europe reduces single-route exposure.
Industrial and export incentives
Lithuania and neighboring states actively promote manufacturing upgrades and exports via national schemes and EU programs such as Horizon Europe (budget €95.5bn) and the Recovery and Resilience Facility (€723.8bn), which fund energy efficiency, automation and R&D.
Grants and tax incentives at national and EU level reduce project capex and operating costs, often co-financing investments in Industry 4.0 and decarbonisation.
Accessing these programs requires rigorous project justification and reporting; timely, well-documented applications can materially shorten capex payback timelines.
Public procurement priorities
Government buyers increasingly prioritize sustainable packaging and hygiene supplies, driven by the EU Green Deal and the fact that public procurement represents about 14% of EU GDP, raising tender volume for compliant suppliers. Compliance with recognized ecolabels (EU Ecolabel, FSC) can unlock public tenders where documented environmental performance often beats lowest-price bids. Long-term public contracts provide volume stability across economic cycles, favoring suppliers with certified sustainability systems and predictable cost structures.
- Public procurement ≈14% of EU GDP
- Ecolabel compliance unlocks tenders (EU Ecolabel, FSC)
- Price-quality favors documented environmental performance
- Long-term contracts stabilize volumes
Trade policy and standards alignment
EU single market harmonized product and sustainability standards, covering ~447 million consumers (2024), raise entry thresholds for Grigeo but enable scale advantages; divergence in third-country rules directly reduces export competitiveness and can trigger non-tariff barriers. Mutual recognition regimes ease market entry, yet administrative documentation and compliance checks have risen, increasing time-to-market and costs. A strategic certification portfolio (CE, FSC, ISO) underpins multi-market reach.
- EU market size: ~447M consumers (2024)
- Harmonized rules: essential for scale access
- Divergence: increases non-tariff barriers
- Mutual recognition: lowers tariffs but not paperwork
- Certifications: CE, FSC, ISO vital for exports
Align CAPEX to EU Green Deal to access Just Transition/LIFE funds; mitigate €90/t ETS
EU Green Deal and Fit for 55 force Grigeo to align CAPEX with decarbonisation to access funds (Just Transition €17.5bn; LIFE €5.4bn) and avoid stricter standards.
EU ETS ≈€90/t CO2e (2024) raises compliance costs; active policy engagement can shape timelines.
Regional risks after Russia’s 2022 invasion increased transport/insurance costs and pushed supply diversification.
Public procurement ≈14% of EU GDP (2024); ecolabels (EU Ecolabel, FSC) unlock tenders.
| Metric | Value |
|---|---|
| EU market (2024) | ~447M consumers |
| EU ETS price (2024) | ~€90/t CO2e |
| RRF budget | €723.8bn |
What is included in the product
Detailed Word Document
Explores how Political, Economic, Social, Technological, Environmental and Legal forces uniquely impact Grigeo, with data-backed trends, actionable insights, and scenario-focused recommendations tailored for executives, investors and consultants to identify risks, opportunities and strategic responses.
Customizable Excel Spreadsheet
A concise, visually segmented Grigeo PESTLE summary that’s easy to drop into presentations, share across teams, and annotate with region- or business-specific notes to streamline planning, risk discussions, and decision-making.
Economic factors
Energy price volatility
Pulp, paper and board are energy-intensive: CEPI notes energy represents about 20% of production costs in the EU paper sector, making Grigeo margins sensitive to electricity and gas swings. Hedging and on-site renewables (solar/biomass) and long-term contracts have cut price exposure for mills by double-digit percentages in recent years. IEA analysis shows efficiency upgrades often yield paybacks within 2–4 years during price spikes, while flexible pricing clauses enable pass-through of most cost increases to customers.
Timber and pulp supply dynamics
Regional fiber availability and 210 million t/yr global pulp cycles drive input cost swings, with benchmark softwood pulp volatility affecting margins. Certification (FSC/PEFC) across ~500 million ha and traceability restrict low‑cost sources but secure export markets. Long‑term supplier contracts smooth price shocks, while expanding recycling—EU paper recycling ~72% (2022)—cuts virgin fiber dependence.
Packaging demand cycles
Rising e-commerce supports corrugated demand—global online retail sales reached about USD 5.7 trillion in 2023 (eMarketer), boosting box volumes even as industrial slowdowns can soften B2B shipments. Product-mix optimization cushions cyclicality by shifting capacity toward FMCG and e-tail clients. Value-added designs and lightweighting protect pricing while export diversification reduces reliance on any single domestic sector.
Currency fluctuations
Grigeo benefits from euro exposure—Lithuania adopted the euro in 2015 and the currency is legal tender in 20 EU states—stabilizing regional trade, but sales to non-euro markets create FX risk. Prudent hedging protects cash flows; sourcing and sales in the same currency create natural hedges and transparent surcharge mechanisms help maintain margins.
Inflation and wage pressures
Tight Baltic labor markets pushed nominal wages roughly 10% YoY in 2024, raising unit costs for Grigeo; automation and targeted training improved productivity per employee, cutting labor cost per ton by about 6% in 2024. Inflation-indexed contracts (CPI ~4% in 2024) helped preserve margins while lean initiatives contained overhead creep.
- Wage rise: ~10% YoY (2024)
- Productivity gain: ~6% lower labor cost/ton (2024)
- Indexation: CPI ~4% (2024)
- Lean measures: offsetting overhead creep
Align CAPEX to EU Green Deal to access Just Transition/LIFE funds; mitigate €90/t ETS
Energy represents ~20% of paper costs making Grigeo sensitive to electricity/gas swings; on-site renewables and hedges have cut exposure. EU recycling ~72% (2022) and global pulp cycles drive fiber costs, while e‑commerce (USD 5.7T in 2023) supports corrugated demand. Baltic wages rose ~10% (2024) but automation cut labor cost/ton ~6% and CPI ~4% (2024).
Preview the Actual Deliverable
Grigeo PESTLE Analysis
The Grigeo PESTLE Analysis preview shown here is the exact document you’ll receive after purchase—fully formatted and ready to use. This is a real screenshot of the product, delivered exactly as shown with no placeholders or surprises. The layout, content, and structure visible here are exactly what you’ll download immediately after buying.











