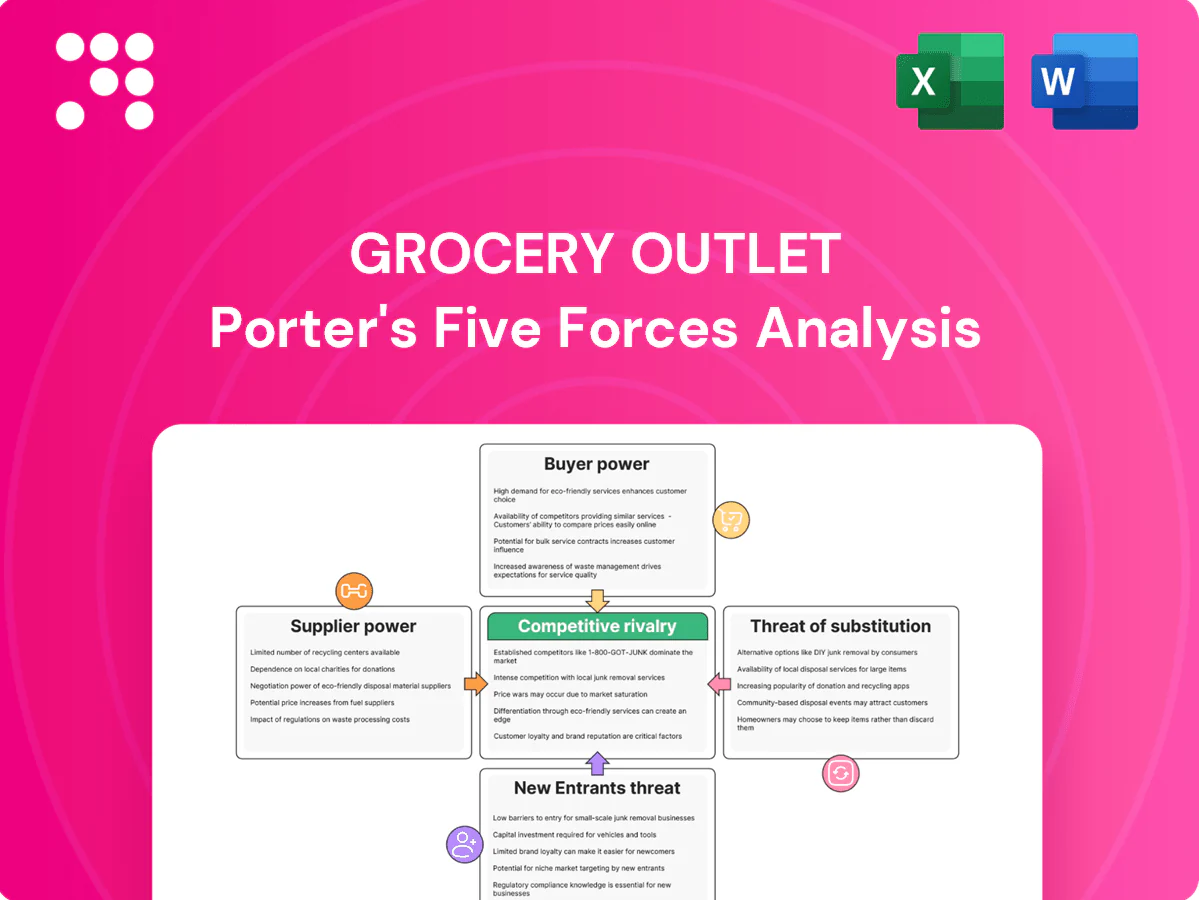
Grocery Outlet Porter's Five Forces Analysis

Elevate Your Analysis with the Complete Porter's Five Forces Analysis
Grocery Outlet faces intense rivalry from national chains, strong buyer sensitivity, and moderate supplier leverage, with private-label and discount positioning as key defenses. This snapshot highlights critical pressures but only scratches the surface. Unlock the full Porter's Five Forces Analysis for force-by-force ratings, visuals, and actionable strategic insights to inform investment or operational decisions.
Suppliers Bargaining Power

Fragmented excess-supply base
National brands, manufacturers, and distributors with overstocks and closeouts form a highly fragmented supplier pool, reducing any single supplier’s leverage over pricing and terms. Grocery Outlet can switch among numerous sources to fill categories, leveraging breadth to negotiate favorable buys. Supplier power weakens further when liquidation is time-sensitive, as sellers accept lower margins to move inventory quickly.
Need for liquidation channels
Suppliers facing carrying costs and obsolescence increasingly use Grocery Outlet's scaled liquidation channel—about 430 stores in 2024—to monetize excess inventory quickly, trimming holding costs that can range into double-digit percentages annually and thereby weakening supplier pricing power. When supply tightens, however, leverage can briefly shift back to suppliers, allowing higher recovery prices.

Brand-protection constraints
Many CPGs impose territory, pack-size and branding restrictions to avoid channel conflict, which for Grocery Outlet — operating roughly 450 stores in 2024 — often limits item availability or dictates terms; these guardrails rarely push prices up materially but constrain assortment and promotional timing. Supplier power shows up through access, delivery timing and product condition rather than just price.

Alternative liquidators exist
Competing off-price grocery chains, wholesalers and online liquidators intensified bidding for surplus lots in 2024, elevating take-in costs and occasionally trimming volumes available to Grocery Outlet; supplier power increases when multiple buyers chase limited lots, though deep supplier relationships and rapid logistics help Grocery Outlet secure preferable lots and margins.
- Competition: chains, wholesalers, online liquidators
- Impact: higher take-in costs, reduced volumes
- Driver: multiple buyers chasing limited lots
- Mitigation: relationship depth and speed
Volatile supply cycles
Seasonality, promotions gone wrong, and macro shocks create irregular waves of surplus that push supplier power down in gluts and up in lean periods; Grocery Outlet’s over 400 stores as of 2024 and diversified categories smooth but do not eliminate volatility, making timing agility a critical counterbalance.
- Seasonal gluts reduce supplier leverage
- Promotion missteps amplify irregular surplus
- Macro shocks spike supplier power in lean times
- Timing agility + 400+ stores (2024) = key mitigation
430-store discounter leverages scale vs fragmented suppliers amid time-sensitive liquidations
Fragmented suppliers and time-sensitive liquidations limit individual supplier leverage, letting Grocery Outlet leverage scale across about 430 stores in 2024 to negotiate buys. Supplier power rises during tight supply or when multiple buyers compete for limited lots, raising take-in costs and reducing volumes. Restrictions from CPGs constrain assortment and timing more than headline prices.
| Metric | 2024 |
|---|---|
| Stores | ~430 |
| Supplier pool | Highly fragmented |
What is included in the product
 Detailed Word Document
Tailored Porter’s Five Forces assessment of Grocery Outlet that highlights competitive rivalry, buyer and supplier power, threat of new entrants and substitutes, and regulatory dynamics, with strategic implications for pricing, margins, and growth.

 Customizable Excel Spreadsheet
A concise one-sheet Porter's Five Forces for Grocery Outlet that visualizes competitive pressures with a radar chart, lets you tweak force levels for scenario planning, and plugs directly into decks—no macros or finance expertise required.
Customers Bargaining Power

High price sensitivity
Value-seeking shoppers routinely compare Grocery Outlet prices to Walmart, Aldi, dollar stores and clubs, heightening price sensitivity and cross-channel switching. Low switching costs give buyers leverage over price perception and limit loyalty. Grocery Outlet offsets with deep-discount merchandising—marketing offers up to 70% off—and visible basket savings that blunt haggling and reduce buyer bargaining power.
Low assortment predictability
Grocery Outlet’s treasure-hunt rotation reduces direct item-by-item comparison, lowering buyer power since exact substitutes often aren’t available; with roughly 460 stores in 2024 this model leverages scale to source one-offs. However, inconsistent assortments can drive shoppers to split baskets to rivals, so clear communication on stock freshness and deal velocity—via signage and weekly app updates—helps preserve trust.

Abundant alternatives
Mass, club, dollar and conventional grocers are ubiquitous, with Walmart holding roughly 25% of US grocery share in 2024, so if Grocery Outlet’s value gaps narrow customers can easily defect. Local rivals and independent grocers intensify buyer bargaining power at the store trade-area level. Strong opening price points and opportunistic finds (Grocery Outlet operated over 430 stores in 2024) help retain trips.

Limited brand loyalty in off-price
Grocery Outlet reported roughly $4.8B net sales in fiscal 2024 across ~460 stores; bargain hunters prioritize price over specific brands, making demand highly elastic and forcing flexible SKU curation. Customers consistently pressure for continuous deals and perceived savings, and management signals that lapses in "wow" items can quickly reduce store traffic.
- Bargain-first shoppers
- High demand elasticity
- Continuous deal pressure
- Traffic tied to "wow" finds
Digital transparency
Apps, social groups, and review platforms amplify deal comparison, enabling shoppers to benchmark Grocery Outlet savings and publicly call out pricing inconsistencies; this transparency increased buyer leverage in 2024. Heightened scrutiny raises expectations for verifiable value, forcing clearer signage and documented MSRP savings to maintain trust and perceived discount integrity.
- Apps/reviews amplify comparisons
- Shoppers publicly flag inconsistencies
- Transparency increases buyer power
- Clear signage + verified MSRP curb skepticism
Off-price grocer leans on ≈460 stores and $4.8B to fuel constant deals
Value-focused shoppers compare Grocery Outlet to Walmart (≈25% US grocery share in 2024), Aldi and dollar stores, raising price sensitivity and switching. Low switching costs and high demand elasticity force continuous deal flow; Grocery Outlet leaned on ~460 stores and $4.8B net sales in fiscal 2024 to source deep discounts. Treasure-hunt assortments blunt item-by-item bargaining but inconsistent SKUs can drive defections.
| Metric | 2024 |
|---|---|
| Stores | ≈460 |
| Net sales | $4.8B |
| Walmart grocery share | ≈25% |
Same Document Delivered
Grocery Outlet Porter's Five Forces Analysis
This Grocery Outlet Porter's Five Forces analysis provides a concise, professional assessment of competitive rivalry, buyer and supplier power, threats of entrants and substitutes, and strategic implications. This preview is the exact document you'll receive immediately after purchase—fully formatted and ready to use. No mockups or samples; what you see is the downloadable deliverable.

Elevate Your Analysis with the Complete Porter's Five Forces Analysis
Grocery Outlet faces intense rivalry from national chains, strong buyer sensitivity, and moderate supplier leverage, with private-label and discount positioning as key defenses. This snapshot highlights critical pressures but only scratches the surface. Unlock the full Porter's Five Forces Analysis for force-by-force ratings, visuals, and actionable strategic insights to inform investment or operational decisions.
Suppliers Bargaining Power
Fragmented excess-supply base
National brands, manufacturers, and distributors with overstocks and closeouts form a highly fragmented supplier pool, reducing any single supplier’s leverage over pricing and terms. Grocery Outlet can switch among numerous sources to fill categories, leveraging breadth to negotiate favorable buys. Supplier power weakens further when liquidation is time-sensitive, as sellers accept lower margins to move inventory quickly.
Need for liquidation channels
Suppliers facing carrying costs and obsolescence increasingly use Grocery Outlet's scaled liquidation channel—about 430 stores in 2024—to monetize excess inventory quickly, trimming holding costs that can range into double-digit percentages annually and thereby weakening supplier pricing power. When supply tightens, however, leverage can briefly shift back to suppliers, allowing higher recovery prices.
Brand-protection constraints
Many CPGs impose territory, pack-size and branding restrictions to avoid channel conflict, which for Grocery Outlet — operating roughly 450 stores in 2024 — often limits item availability or dictates terms; these guardrails rarely push prices up materially but constrain assortment and promotional timing. Supplier power shows up through access, delivery timing and product condition rather than just price.
Alternative liquidators exist
Competing off-price grocery chains, wholesalers and online liquidators intensified bidding for surplus lots in 2024, elevating take-in costs and occasionally trimming volumes available to Grocery Outlet; supplier power increases when multiple buyers chase limited lots, though deep supplier relationships and rapid logistics help Grocery Outlet secure preferable lots and margins.
- Competition: chains, wholesalers, online liquidators
- Impact: higher take-in costs, reduced volumes
- Driver: multiple buyers chasing limited lots
- Mitigation: relationship depth and speed
Volatile supply cycles
Seasonality, promotions gone wrong, and macro shocks create irregular waves of surplus that push supplier power down in gluts and up in lean periods; Grocery Outlet’s over 400 stores as of 2024 and diversified categories smooth but do not eliminate volatility, making timing agility a critical counterbalance.
- Seasonal gluts reduce supplier leverage
- Promotion missteps amplify irregular surplus
- Macro shocks spike supplier power in lean times
- Timing agility + 400+ stores (2024) = key mitigation
430-store discounter leverages scale vs fragmented suppliers amid time-sensitive liquidations
Fragmented suppliers and time-sensitive liquidations limit individual supplier leverage, letting Grocery Outlet leverage scale across about 430 stores in 2024 to negotiate buys. Supplier power rises during tight supply or when multiple buyers compete for limited lots, raising take-in costs and reducing volumes. Restrictions from CPGs constrain assortment and timing more than headline prices.
| Metric | 2024 |
|---|---|
| Stores | ~430 |
| Supplier pool | Highly fragmented |
What is included in the product
Detailed Word Document
Tailored Porter’s Five Forces assessment of Grocery Outlet that highlights competitive rivalry, buyer and supplier power, threat of new entrants and substitutes, and regulatory dynamics, with strategic implications for pricing, margins, and growth.
Customizable Excel Spreadsheet
A concise one-sheet Porter's Five Forces for Grocery Outlet that visualizes competitive pressures with a radar chart, lets you tweak force levels for scenario planning, and plugs directly into decks—no macros or finance expertise required.
Customers Bargaining Power
High price sensitivity
Value-seeking shoppers routinely compare Grocery Outlet prices to Walmart, Aldi, dollar stores and clubs, heightening price sensitivity and cross-channel switching. Low switching costs give buyers leverage over price perception and limit loyalty. Grocery Outlet offsets with deep-discount merchandising—marketing offers up to 70% off—and visible basket savings that blunt haggling and reduce buyer bargaining power.
Low assortment predictability
Grocery Outlet’s treasure-hunt rotation reduces direct item-by-item comparison, lowering buyer power since exact substitutes often aren’t available; with roughly 460 stores in 2024 this model leverages scale to source one-offs. However, inconsistent assortments can drive shoppers to split baskets to rivals, so clear communication on stock freshness and deal velocity—via signage and weekly app updates—helps preserve trust.
Abundant alternatives
Mass, club, dollar and conventional grocers are ubiquitous, with Walmart holding roughly 25% of US grocery share in 2024, so if Grocery Outlet’s value gaps narrow customers can easily defect. Local rivals and independent grocers intensify buyer bargaining power at the store trade-area level. Strong opening price points and opportunistic finds (Grocery Outlet operated over 430 stores in 2024) help retain trips.
Limited brand loyalty in off-price
Grocery Outlet reported roughly $4.8B net sales in fiscal 2024 across ~460 stores; bargain hunters prioritize price over specific brands, making demand highly elastic and forcing flexible SKU curation. Customers consistently pressure for continuous deals and perceived savings, and management signals that lapses in "wow" items can quickly reduce store traffic.
- Bargain-first shoppers
- High demand elasticity
- Continuous deal pressure
- Traffic tied to "wow" finds
Digital transparency
Apps, social groups, and review platforms amplify deal comparison, enabling shoppers to benchmark Grocery Outlet savings and publicly call out pricing inconsistencies; this transparency increased buyer leverage in 2024. Heightened scrutiny raises expectations for verifiable value, forcing clearer signage and documented MSRP savings to maintain trust and perceived discount integrity.
- Apps/reviews amplify comparisons
- Shoppers publicly flag inconsistencies
- Transparency increases buyer power
- Clear signage + verified MSRP curb skepticism
Off-price grocer leans on ≈460 stores and $4.8B to fuel constant deals
Value-focused shoppers compare Grocery Outlet to Walmart (≈25% US grocery share in 2024), Aldi and dollar stores, raising price sensitivity and switching. Low switching costs and high demand elasticity force continuous deal flow; Grocery Outlet leaned on ~460 stores and $4.8B net sales in fiscal 2024 to source deep discounts. Treasure-hunt assortments blunt item-by-item bargaining but inconsistent SKUs can drive defections.
| Metric | 2024 |
|---|---|
| Stores | ≈460 |
| Net sales | $4.8B |
| Walmart grocery share | ≈25% |
Same Document Delivered
Grocery Outlet Porter's Five Forces Analysis
This Grocery Outlet Porter's Five Forces analysis provides a concise, professional assessment of competitive rivalry, buyer and supplier power, threats of entrants and substitutes, and strategic implications. This preview is the exact document you'll receive immediately after purchase—fully formatted and ready to use. No mockups or samples; what you see is the downloadable deliverable.
Original: $10.00
-65%$10.00
$3.50Description
Elevate Your Analysis with the Complete Porter's Five Forces Analysis
Grocery Outlet faces intense rivalry from national chains, strong buyer sensitivity, and moderate supplier leverage, with private-label and discount positioning as key defenses. This snapshot highlights critical pressures but only scratches the surface. Unlock the full Porter's Five Forces Analysis for force-by-force ratings, visuals, and actionable strategic insights to inform investment or operational decisions.
Suppliers Bargaining Power
Fragmented excess-supply base
National brands, manufacturers, and distributors with overstocks and closeouts form a highly fragmented supplier pool, reducing any single supplier’s leverage over pricing and terms. Grocery Outlet can switch among numerous sources to fill categories, leveraging breadth to negotiate favorable buys. Supplier power weakens further when liquidation is time-sensitive, as sellers accept lower margins to move inventory quickly.
Need for liquidation channels
Suppliers facing carrying costs and obsolescence increasingly use Grocery Outlet's scaled liquidation channel—about 430 stores in 2024—to monetize excess inventory quickly, trimming holding costs that can range into double-digit percentages annually and thereby weakening supplier pricing power. When supply tightens, however, leverage can briefly shift back to suppliers, allowing higher recovery prices.
Brand-protection constraints
Many CPGs impose territory, pack-size and branding restrictions to avoid channel conflict, which for Grocery Outlet — operating roughly 450 stores in 2024 — often limits item availability or dictates terms; these guardrails rarely push prices up materially but constrain assortment and promotional timing. Supplier power shows up through access, delivery timing and product condition rather than just price.
Alternative liquidators exist
Competing off-price grocery chains, wholesalers and online liquidators intensified bidding for surplus lots in 2024, elevating take-in costs and occasionally trimming volumes available to Grocery Outlet; supplier power increases when multiple buyers chase limited lots, though deep supplier relationships and rapid logistics help Grocery Outlet secure preferable lots and margins.
- Competition: chains, wholesalers, online liquidators
- Impact: higher take-in costs, reduced volumes
- Driver: multiple buyers chasing limited lots
- Mitigation: relationship depth and speed
Volatile supply cycles
Seasonality, promotions gone wrong, and macro shocks create irregular waves of surplus that push supplier power down in gluts and up in lean periods; Grocery Outlet’s over 400 stores as of 2024 and diversified categories smooth but do not eliminate volatility, making timing agility a critical counterbalance.
- Seasonal gluts reduce supplier leverage
- Promotion missteps amplify irregular surplus
- Macro shocks spike supplier power in lean times
- Timing agility + 400+ stores (2024) = key mitigation
430-store discounter leverages scale vs fragmented suppliers amid time-sensitive liquidations
Fragmented suppliers and time-sensitive liquidations limit individual supplier leverage, letting Grocery Outlet leverage scale across about 430 stores in 2024 to negotiate buys. Supplier power rises during tight supply or when multiple buyers compete for limited lots, raising take-in costs and reducing volumes. Restrictions from CPGs constrain assortment and timing more than headline prices.
| Metric | 2024 |
|---|---|
| Stores | ~430 |
| Supplier pool | Highly fragmented |
What is included in the product
Detailed Word Document
Tailored Porter’s Five Forces assessment of Grocery Outlet that highlights competitive rivalry, buyer and supplier power, threat of new entrants and substitutes, and regulatory dynamics, with strategic implications for pricing, margins, and growth.
Customizable Excel Spreadsheet
A concise one-sheet Porter's Five Forces for Grocery Outlet that visualizes competitive pressures with a radar chart, lets you tweak force levels for scenario planning, and plugs directly into decks—no macros or finance expertise required.
Customers Bargaining Power
High price sensitivity
Value-seeking shoppers routinely compare Grocery Outlet prices to Walmart, Aldi, dollar stores and clubs, heightening price sensitivity and cross-channel switching. Low switching costs give buyers leverage over price perception and limit loyalty. Grocery Outlet offsets with deep-discount merchandising—marketing offers up to 70% off—and visible basket savings that blunt haggling and reduce buyer bargaining power.
Low assortment predictability
Grocery Outlet’s treasure-hunt rotation reduces direct item-by-item comparison, lowering buyer power since exact substitutes often aren’t available; with roughly 460 stores in 2024 this model leverages scale to source one-offs. However, inconsistent assortments can drive shoppers to split baskets to rivals, so clear communication on stock freshness and deal velocity—via signage and weekly app updates—helps preserve trust.
Abundant alternatives
Mass, club, dollar and conventional grocers are ubiquitous, with Walmart holding roughly 25% of US grocery share in 2024, so if Grocery Outlet’s value gaps narrow customers can easily defect. Local rivals and independent grocers intensify buyer bargaining power at the store trade-area level. Strong opening price points and opportunistic finds (Grocery Outlet operated over 430 stores in 2024) help retain trips.
Limited brand loyalty in off-price
Grocery Outlet reported roughly $4.8B net sales in fiscal 2024 across ~460 stores; bargain hunters prioritize price over specific brands, making demand highly elastic and forcing flexible SKU curation. Customers consistently pressure for continuous deals and perceived savings, and management signals that lapses in "wow" items can quickly reduce store traffic.
- Bargain-first shoppers
- High demand elasticity
- Continuous deal pressure
- Traffic tied to "wow" finds
Digital transparency
Apps, social groups, and review platforms amplify deal comparison, enabling shoppers to benchmark Grocery Outlet savings and publicly call out pricing inconsistencies; this transparency increased buyer leverage in 2024. Heightened scrutiny raises expectations for verifiable value, forcing clearer signage and documented MSRP savings to maintain trust and perceived discount integrity.
- Apps/reviews amplify comparisons
- Shoppers publicly flag inconsistencies
- Transparency increases buyer power
- Clear signage + verified MSRP curb skepticism
Off-price grocer leans on ≈460 stores and $4.8B to fuel constant deals
Value-focused shoppers compare Grocery Outlet to Walmart (≈25% US grocery share in 2024), Aldi and dollar stores, raising price sensitivity and switching. Low switching costs and high demand elasticity force continuous deal flow; Grocery Outlet leaned on ~460 stores and $4.8B net sales in fiscal 2024 to source deep discounts. Treasure-hunt assortments blunt item-by-item bargaining but inconsistent SKUs can drive defections.
| Metric | 2024 |
|---|---|
| Stores | ≈460 |
| Net sales | $4.8B |
| Walmart grocery share | ≈25% |
Same Document Delivered
Grocery Outlet Porter's Five Forces Analysis
This Grocery Outlet Porter's Five Forces analysis provides a concise, professional assessment of competitive rivalry, buyer and supplier power, threats of entrants and substitutes, and strategic implications. This preview is the exact document you'll receive immediately after purchase—fully formatted and ready to use. No mockups or samples; what you see is the downloadable deliverable.











