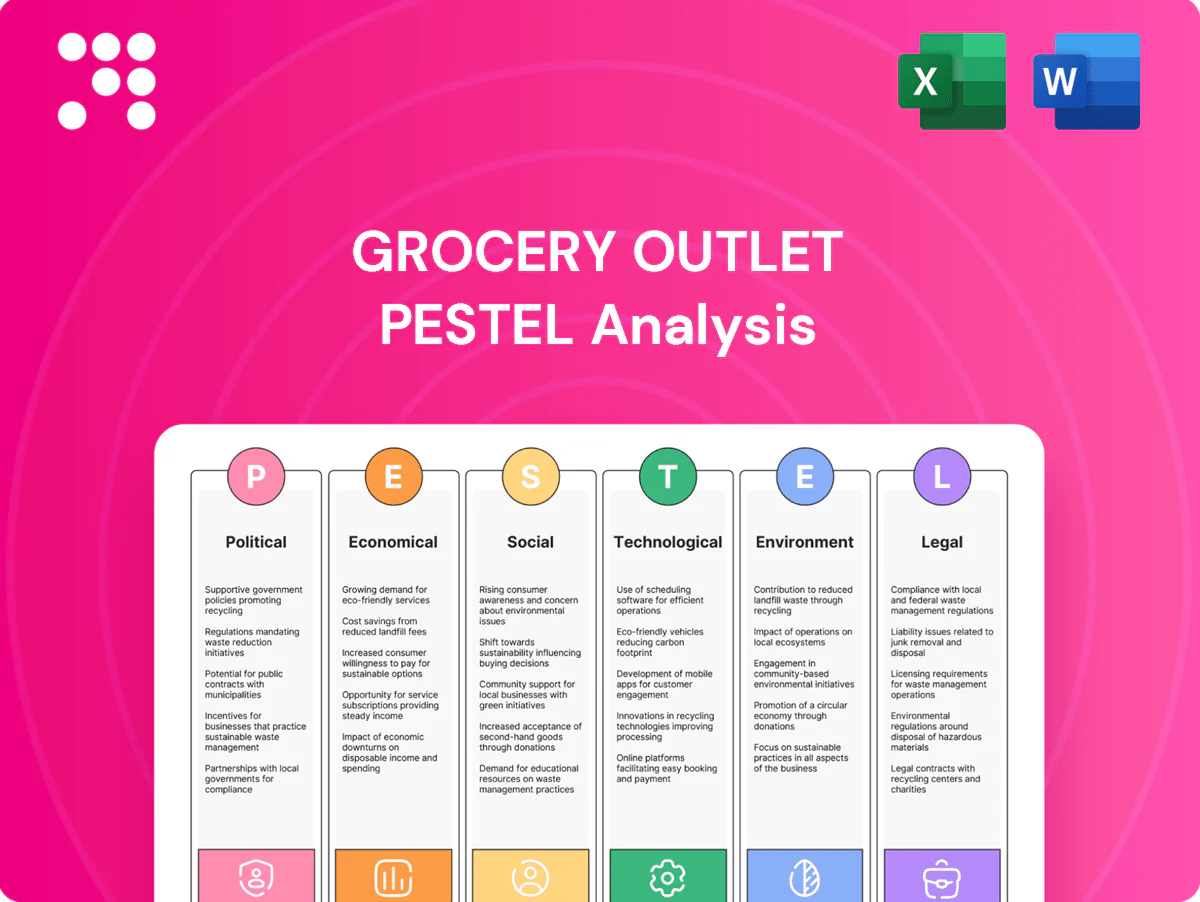
Grocery Outlet PESTLE Analysis

Your Competitive Advantage Starts with This Report
Unlock how political, economic, social, technological, legal, and environmental forces are shaping Grocery Outlet’s trajectory in our concise PESTLE snapshot; perfect for investors and strategists seeking quick, actionable context. Dive deeper with the full, fully editable PESTLE—download now to get detailed risk assessments, opportunity maps, and tactical recommendations you can use immediately.
Political factors

SNAP/EBT policy
Changes to SNAP/EBT funding and eligibility directly alter discount-grocery traffic and basket size; about 41.6 million people participated in SNAP in 2024 and the USDA reported an average monthly benefit near $146 per person (FY2023). Enhanced benefits have historically increased transaction volumes, while cuts or stricter rules reduce demand. EBT tender requirements and audits add operational complexity and compliance costs. Monitoring Farm Bill outcomes remains critical for planning.
Trade tariffs
Tariffs on food, packaging and consumer staples lift upstream costs and can reduce availability of closeout lots, forcing Grocery Outlet to pass costs or absorb margin hits. The US Section 301 tariffs imposed 2018–2020 peaked at 25% on roughly 250 billion dollars of Chinese goods, showing how trade policy can suddenly alter supply flows. Rapid policy swings therefore require agile, diversified sourcing to capture opportunistic surpluses when regimes shift.

Alcohol & local ordinances
State-by-state alcohol rules—including 17 control states—directly affect Grocery Outlet's ability to sell discounted wine and beer, a proven traffic driver. Local zoning, signage and hours-of-operation ordinances shape store productivity and on-premise layouts. Political pushes to curb below-cost alcohol promotions could limit markdown strategies. Licensing approvals often add delays measured in months to over a year, slowing new-store ramp.

Labor policy & wages
Minimum wage hikes and scheduling mandates vary by jurisdiction and are politically driven; federal minimum remains 7.25/hr while California rose to 16.00/hr in 2024, raising labor costs for Grocery Outlet and distribution centers and pressuring its price-leadership model across 400+ stores.
Supply-chain infrastructure
- Public funding: IIJA 17B for ports
- Port queues: peak >40 ships (2021) to single digits (2024)
- Policy risk: trucker/port rules alter lead times
- Opportunity: disruptions = both scarcity and surplus
SNAP changes, tariffs and wage rules squeeze discount grocers: higher compliance, tighter margins
SNAP/EBT changes (41.6M participants in 2024; avg benefit ~$146 FY2023) shift discount-grocery demand and basket size, raising compliance costs. Tariffs and trade policy (Section 301 precedents) squeeze closeout supply and margins. State alcohol rules, licensing delays and varying minimum wages (federal $7.25; CA $16.00 in 2024) affect SKU mix and labor costs.
| Factor | 2024–25 datapoint |
|---|---|
| SNAP participants | 41.6M (2024) |
| Avg SNAP benefit | $146 (FY2023) |
| CA min wage | $16.00 (2024) |
| IIJA ports funding | $17B |
What is included in the product
 Detailed Word Document
Explores how macro-environmental factors uniquely affect Grocery Outlet across Political, Economic, Social, Technological, Environmental, and Legal dimensions, with data-driven trends and forward-looking insights; designed to support executives, consultants, and investors with actionable, report-ready analysis tailored to the grocery discount sector.

 Customizable Excel Spreadsheet
A concise, visually segmented PESTLE summary for Grocery Outlet that distills regulatory, economic, social, technological and supply‑chain risks into a slide‑ready snapshot, easing team alignment and focused risk discussion during planning sessions.
Economic factors

Downtrading tailwinds
In inflationary or recessionary periods consumers trade down to value formats, benefiting Grocery Outlet as heightened price sensitivity drove larger basket sizes and pantry-stocking—US inflation averaged about 3.4% in 2024, sustaining value shopping momentum.
Grocery Outlet captures share from conventional grocers with deep-discount pricing and closeout sourcing, though in strong growth phases some shoppers trade up to premium channels.
Elasticity management—promotions, assortment agility and maintaining low-cost sourcing—is key to preserving traffic and margin across cycles.
Opportunistic supply cycles
Manufacturer overproduction, forecast errors and retailer resets feed Grocery Outlet's closeout pipeline, enabling purchase of excess goods that help sustain over $4 billion in annual sales. Inventory gluts expand deal flow and margin potential by increasing volume of discounted buys. Tight supply periods compress availability and variety, undermining the chain's treasure-hunt customer experience. Business cycles therefore drive significant sourcing volatility.

Fuel & freight costs
U.S. on‑highway diesel averaged about $3.87/gal in 2024 (EIA) and linehaul rates rose roughly 8% YoY in 2024 (DAT), directly lifting Grocery Outlet’s delivered costs and regional price spreads. Persistent volatility can erode bargain positioning unless procurement savings or supplier rebates offset increases. Backhauls and load optimization are critical levers to cut per‑unit transport spend. Fuel surcharges require careful, transparent pass‑through to protect margins.

Interest rates & expansion
Higher interest rates raise buildout and fixture financing costs for Grocery Outlet and increase return hurdles for new stores, slowing expansion in tighter credit cycles. In weaker markets landlords increasingly offer concessions that can materially improve unit economics and offset some financing pressure. When policy rate easing occurs, Grocery Outlet historically accelerates pipeline growth, while maintaining capital discipline to balance expansion with cash returns.
- Higher rates: higher financing costs, tougher return hurdles
- Landlord concessions: improve unit-level economics
- Rate cuts: faster store pipeline
- Capital discipline: prioritize cash returns over rapid growth
Labor market tightness
US unemployment was near 3.7% in mid-2025 (BLS), lifting wages and turnover risk for independent operators and pushing Grocery Outlet to increase training and retention spend that can compress store-level EBITDA. Tight labor markets can pressure service and in-stock levels. Economic cooling typically eases hiring and stabilizes labor costs.
- Labor tightness: higher wages, turnover risk
- EBITDA impact: training/retention costs rise
- Operations: staffing pressures hurt service/in-stock
- Cooling: hiring eases, wage pressure falls
SNAP changes, tariffs and wage rules squeeze discount grocers: higher compliance, tighter margins
Inflationary 2024 (US CPI ~3.4%) and value-seeking shoppers lifted Grocery Outlet traffic and basket sizes; sourcing closeouts supports >$4B sales. Transportation headwinds (diesel $3.87/gal; linehaul +8% YoY 2024) raise delivered costs; tight labor (3.7% unemployment mid‑2025) increases wages and retention spend. Higher rates slow expansion; landlord concessions and capital discipline mitigate unit economics.
| Metric | 2024/25 |
|---|---|
| US CPI 2024 | 3.4% |
| Diesel avg 2024 (EIA) | $3.87/gal |
| Linehaul change 2024 | +8% YoY |
| Unemployment mid‑2025 (BLS) | 3.7% |
| Grocery Outlet sales | >$4B |
Same Document Delivered
Grocery Outlet PESTLE Analysis
The preview shown here is the exact Grocery Outlet PESTLE Analysis you’ll receive after purchase—fully formatted and ready to use. It covers Political, Economic, Social, Technological, Legal, and Environmental factors with clear headings, concise insights, and actionable implications. No placeholders or teasers—this is the final, downloadable file delivered exactly as displayed.

Your Competitive Advantage Starts with This Report
Unlock how political, economic, social, technological, legal, and environmental forces are shaping Grocery Outlet’s trajectory in our concise PESTLE snapshot; perfect for investors and strategists seeking quick, actionable context. Dive deeper with the full, fully editable PESTLE—download now to get detailed risk assessments, opportunity maps, and tactical recommendations you can use immediately.
Political factors
SNAP/EBT policy
Changes to SNAP/EBT funding and eligibility directly alter discount-grocery traffic and basket size; about 41.6 million people participated in SNAP in 2024 and the USDA reported an average monthly benefit near $146 per person (FY2023). Enhanced benefits have historically increased transaction volumes, while cuts or stricter rules reduce demand. EBT tender requirements and audits add operational complexity and compliance costs. Monitoring Farm Bill outcomes remains critical for planning.
Trade tariffs
Tariffs on food, packaging and consumer staples lift upstream costs and can reduce availability of closeout lots, forcing Grocery Outlet to pass costs or absorb margin hits. The US Section 301 tariffs imposed 2018–2020 peaked at 25% on roughly 250 billion dollars of Chinese goods, showing how trade policy can suddenly alter supply flows. Rapid policy swings therefore require agile, diversified sourcing to capture opportunistic surpluses when regimes shift.
Alcohol & local ordinances
State-by-state alcohol rules—including 17 control states—directly affect Grocery Outlet's ability to sell discounted wine and beer, a proven traffic driver. Local zoning, signage and hours-of-operation ordinances shape store productivity and on-premise layouts. Political pushes to curb below-cost alcohol promotions could limit markdown strategies. Licensing approvals often add delays measured in months to over a year, slowing new-store ramp.
Labor policy & wages
Minimum wage hikes and scheduling mandates vary by jurisdiction and are politically driven; federal minimum remains 7.25/hr while California rose to 16.00/hr in 2024, raising labor costs for Grocery Outlet and distribution centers and pressuring its price-leadership model across 400+ stores.
Supply-chain infrastructure
- Public funding: IIJA 17B for ports
- Port queues: peak >40 ships (2021) to single digits (2024)
- Policy risk: trucker/port rules alter lead times
- Opportunity: disruptions = both scarcity and surplus
SNAP changes, tariffs and wage rules squeeze discount grocers: higher compliance, tighter margins
SNAP/EBT changes (41.6M participants in 2024; avg benefit ~$146 FY2023) shift discount-grocery demand and basket size, raising compliance costs. Tariffs and trade policy (Section 301 precedents) squeeze closeout supply and margins. State alcohol rules, licensing delays and varying minimum wages (federal $7.25; CA $16.00 in 2024) affect SKU mix and labor costs.
| Factor | 2024–25 datapoint |
|---|---|
| SNAP participants | 41.6M (2024) |
| Avg SNAP benefit | $146 (FY2023) |
| CA min wage | $16.00 (2024) |
| IIJA ports funding | $17B |
What is included in the product
Detailed Word Document
Explores how macro-environmental factors uniquely affect Grocery Outlet across Political, Economic, Social, Technological, Environmental, and Legal dimensions, with data-driven trends and forward-looking insights; designed to support executives, consultants, and investors with actionable, report-ready analysis tailored to the grocery discount sector.
Customizable Excel Spreadsheet
A concise, visually segmented PESTLE summary for Grocery Outlet that distills regulatory, economic, social, technological and supply‑chain risks into a slide‑ready snapshot, easing team alignment and focused risk discussion during planning sessions.
Economic factors
Downtrading tailwinds
In inflationary or recessionary periods consumers trade down to value formats, benefiting Grocery Outlet as heightened price sensitivity drove larger basket sizes and pantry-stocking—US inflation averaged about 3.4% in 2024, sustaining value shopping momentum.
Grocery Outlet captures share from conventional grocers with deep-discount pricing and closeout sourcing, though in strong growth phases some shoppers trade up to premium channels.
Elasticity management—promotions, assortment agility and maintaining low-cost sourcing—is key to preserving traffic and margin across cycles.
Opportunistic supply cycles
Manufacturer overproduction, forecast errors and retailer resets feed Grocery Outlet's closeout pipeline, enabling purchase of excess goods that help sustain over $4 billion in annual sales. Inventory gluts expand deal flow and margin potential by increasing volume of discounted buys. Tight supply periods compress availability and variety, undermining the chain's treasure-hunt customer experience. Business cycles therefore drive significant sourcing volatility.
Fuel & freight costs
U.S. on‑highway diesel averaged about $3.87/gal in 2024 (EIA) and linehaul rates rose roughly 8% YoY in 2024 (DAT), directly lifting Grocery Outlet’s delivered costs and regional price spreads. Persistent volatility can erode bargain positioning unless procurement savings or supplier rebates offset increases. Backhauls and load optimization are critical levers to cut per‑unit transport spend. Fuel surcharges require careful, transparent pass‑through to protect margins.
Interest rates & expansion
Higher interest rates raise buildout and fixture financing costs for Grocery Outlet and increase return hurdles for new stores, slowing expansion in tighter credit cycles. In weaker markets landlords increasingly offer concessions that can materially improve unit economics and offset some financing pressure. When policy rate easing occurs, Grocery Outlet historically accelerates pipeline growth, while maintaining capital discipline to balance expansion with cash returns.
- Higher rates: higher financing costs, tougher return hurdles
- Landlord concessions: improve unit-level economics
- Rate cuts: faster store pipeline
- Capital discipline: prioritize cash returns over rapid growth
Labor market tightness
US unemployment was near 3.7% in mid-2025 (BLS), lifting wages and turnover risk for independent operators and pushing Grocery Outlet to increase training and retention spend that can compress store-level EBITDA. Tight labor markets can pressure service and in-stock levels. Economic cooling typically eases hiring and stabilizes labor costs.
- Labor tightness: higher wages, turnover risk
- EBITDA impact: training/retention costs rise
- Operations: staffing pressures hurt service/in-stock
- Cooling: hiring eases, wage pressure falls
SNAP changes, tariffs and wage rules squeeze discount grocers: higher compliance, tighter margins
Inflationary 2024 (US CPI ~3.4%) and value-seeking shoppers lifted Grocery Outlet traffic and basket sizes; sourcing closeouts supports >$4B sales. Transportation headwinds (diesel $3.87/gal; linehaul +8% YoY 2024) raise delivered costs; tight labor (3.7% unemployment mid‑2025) increases wages and retention spend. Higher rates slow expansion; landlord concessions and capital discipline mitigate unit economics.
| Metric | 2024/25 |
|---|---|
| US CPI 2024 | 3.4% |
| Diesel avg 2024 (EIA) | $3.87/gal |
| Linehaul change 2024 | +8% YoY |
| Unemployment mid‑2025 (BLS) | 3.7% |
| Grocery Outlet sales | >$4B |
Same Document Delivered
Grocery Outlet PESTLE Analysis
The preview shown here is the exact Grocery Outlet PESTLE Analysis you’ll receive after purchase—fully formatted and ready to use. It covers Political, Economic, Social, Technological, Legal, and Environmental factors with clear headings, concise insights, and actionable implications. No placeholders or teasers—this is the final, downloadable file delivered exactly as displayed.
Original: $10.00
-65%$10.00
$3.50Description
Your Competitive Advantage Starts with This Report
Unlock how political, economic, social, technological, legal, and environmental forces are shaping Grocery Outlet’s trajectory in our concise PESTLE snapshot; perfect for investors and strategists seeking quick, actionable context. Dive deeper with the full, fully editable PESTLE—download now to get detailed risk assessments, opportunity maps, and tactical recommendations you can use immediately.
Political factors
SNAP/EBT policy
Changes to SNAP/EBT funding and eligibility directly alter discount-grocery traffic and basket size; about 41.6 million people participated in SNAP in 2024 and the USDA reported an average monthly benefit near $146 per person (FY2023). Enhanced benefits have historically increased transaction volumes, while cuts or stricter rules reduce demand. EBT tender requirements and audits add operational complexity and compliance costs. Monitoring Farm Bill outcomes remains critical for planning.
Trade tariffs
Tariffs on food, packaging and consumer staples lift upstream costs and can reduce availability of closeout lots, forcing Grocery Outlet to pass costs or absorb margin hits. The US Section 301 tariffs imposed 2018–2020 peaked at 25% on roughly 250 billion dollars of Chinese goods, showing how trade policy can suddenly alter supply flows. Rapid policy swings therefore require agile, diversified sourcing to capture opportunistic surpluses when regimes shift.
Alcohol & local ordinances
State-by-state alcohol rules—including 17 control states—directly affect Grocery Outlet's ability to sell discounted wine and beer, a proven traffic driver. Local zoning, signage and hours-of-operation ordinances shape store productivity and on-premise layouts. Political pushes to curb below-cost alcohol promotions could limit markdown strategies. Licensing approvals often add delays measured in months to over a year, slowing new-store ramp.
Labor policy & wages
Minimum wage hikes and scheduling mandates vary by jurisdiction and are politically driven; federal minimum remains 7.25/hr while California rose to 16.00/hr in 2024, raising labor costs for Grocery Outlet and distribution centers and pressuring its price-leadership model across 400+ stores.
Supply-chain infrastructure
- Public funding: IIJA 17B for ports
- Port queues: peak >40 ships (2021) to single digits (2024)
- Policy risk: trucker/port rules alter lead times
- Opportunity: disruptions = both scarcity and surplus
SNAP changes, tariffs and wage rules squeeze discount grocers: higher compliance, tighter margins
SNAP/EBT changes (41.6M participants in 2024; avg benefit ~$146 FY2023) shift discount-grocery demand and basket size, raising compliance costs. Tariffs and trade policy (Section 301 precedents) squeeze closeout supply and margins. State alcohol rules, licensing delays and varying minimum wages (federal $7.25; CA $16.00 in 2024) affect SKU mix and labor costs.
| Factor | 2024–25 datapoint |
|---|---|
| SNAP participants | 41.6M (2024) |
| Avg SNAP benefit | $146 (FY2023) |
| CA min wage | $16.00 (2024) |
| IIJA ports funding | $17B |
What is included in the product
Detailed Word Document
Explores how macro-environmental factors uniquely affect Grocery Outlet across Political, Economic, Social, Technological, Environmental, and Legal dimensions, with data-driven trends and forward-looking insights; designed to support executives, consultants, and investors with actionable, report-ready analysis tailored to the grocery discount sector.
Customizable Excel Spreadsheet
A concise, visually segmented PESTLE summary for Grocery Outlet that distills regulatory, economic, social, technological and supply‑chain risks into a slide‑ready snapshot, easing team alignment and focused risk discussion during planning sessions.
Economic factors
Downtrading tailwinds
In inflationary or recessionary periods consumers trade down to value formats, benefiting Grocery Outlet as heightened price sensitivity drove larger basket sizes and pantry-stocking—US inflation averaged about 3.4% in 2024, sustaining value shopping momentum.
Grocery Outlet captures share from conventional grocers with deep-discount pricing and closeout sourcing, though in strong growth phases some shoppers trade up to premium channels.
Elasticity management—promotions, assortment agility and maintaining low-cost sourcing—is key to preserving traffic and margin across cycles.
Opportunistic supply cycles
Manufacturer overproduction, forecast errors and retailer resets feed Grocery Outlet's closeout pipeline, enabling purchase of excess goods that help sustain over $4 billion in annual sales. Inventory gluts expand deal flow and margin potential by increasing volume of discounted buys. Tight supply periods compress availability and variety, undermining the chain's treasure-hunt customer experience. Business cycles therefore drive significant sourcing volatility.
Fuel & freight costs
U.S. on‑highway diesel averaged about $3.87/gal in 2024 (EIA) and linehaul rates rose roughly 8% YoY in 2024 (DAT), directly lifting Grocery Outlet’s delivered costs and regional price spreads. Persistent volatility can erode bargain positioning unless procurement savings or supplier rebates offset increases. Backhauls and load optimization are critical levers to cut per‑unit transport spend. Fuel surcharges require careful, transparent pass‑through to protect margins.
Interest rates & expansion
Higher interest rates raise buildout and fixture financing costs for Grocery Outlet and increase return hurdles for new stores, slowing expansion in tighter credit cycles. In weaker markets landlords increasingly offer concessions that can materially improve unit economics and offset some financing pressure. When policy rate easing occurs, Grocery Outlet historically accelerates pipeline growth, while maintaining capital discipline to balance expansion with cash returns.
- Higher rates: higher financing costs, tougher return hurdles
- Landlord concessions: improve unit-level economics
- Rate cuts: faster store pipeline
- Capital discipline: prioritize cash returns over rapid growth
Labor market tightness
US unemployment was near 3.7% in mid-2025 (BLS), lifting wages and turnover risk for independent operators and pushing Grocery Outlet to increase training and retention spend that can compress store-level EBITDA. Tight labor markets can pressure service and in-stock levels. Economic cooling typically eases hiring and stabilizes labor costs.
- Labor tightness: higher wages, turnover risk
- EBITDA impact: training/retention costs rise
- Operations: staffing pressures hurt service/in-stock
- Cooling: hiring eases, wage pressure falls
SNAP changes, tariffs and wage rules squeeze discount grocers: higher compliance, tighter margins
Inflationary 2024 (US CPI ~3.4%) and value-seeking shoppers lifted Grocery Outlet traffic and basket sizes; sourcing closeouts supports >$4B sales. Transportation headwinds (diesel $3.87/gal; linehaul +8% YoY 2024) raise delivered costs; tight labor (3.7% unemployment mid‑2025) increases wages and retention spend. Higher rates slow expansion; landlord concessions and capital discipline mitigate unit economics.
| Metric | 2024/25 |
|---|---|
| US CPI 2024 | 3.4% |
| Diesel avg 2024 (EIA) | $3.87/gal |
| Linehaul change 2024 | +8% YoY |
| Unemployment mid‑2025 (BLS) | 3.7% |
| Grocery Outlet sales | >$4B |
Same Document Delivered
Grocery Outlet PESTLE Analysis
The preview shown here is the exact Grocery Outlet PESTLE Analysis you’ll receive after purchase—fully formatted and ready to use. It covers Political, Economic, Social, Technological, Legal, and Environmental factors with clear headings, concise insights, and actionable implications. No placeholders or teasers—this is the final, downloadable file delivered exactly as displayed.











