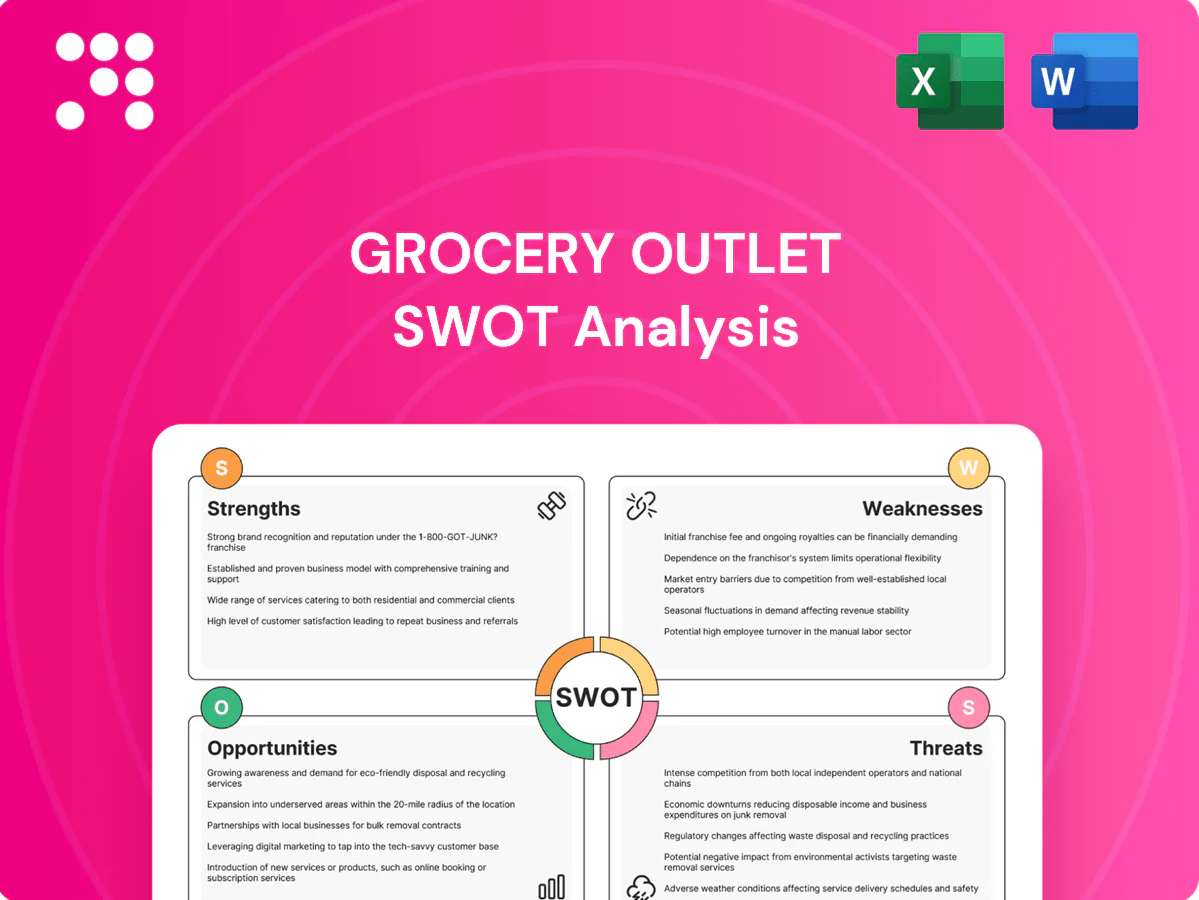
Grocery Outlet SWOT Analysis

Make Insightful Decisions Backed by Expert Research
Grocery Outlet’s discount model drives strong customer loyalty and margin upside, but supply volatility and competitive pressure pose clear risks. Our full SWOT dives into financial metrics, market positioning, and strategic moves to scale profitably. Purchase the complete, editable report to power smarter investment or strategic decisions.
Strengths

Deep discount value
Grocery Outlet leverages opportunistic buying to secure branded goods at steep discounts—often quoted as 40–70% below conventional supermarket prices—enabling everyday low pricing that shoppers perceive as strong savings versus traditional grocers. That value leadership boosts traffic and repeat visits, and during inflationary periods the effective price gap versus big-box chains typically widens further.
Treasure-hunt appeal
Grocery Outlet's treasure-hunt format—constantly changing assortments—drives discovery and impulse buys, lifting basket size without heavy promotions. Scarcity and novelty create urgency that differentiates the shopping experience from routine grocers and fuels social word-of-mouth. The model supported Grocery Outlet's $3.16 billion net sales in fiscal 2023, underscoring commercial impact.

Flexible sourcing engine
Grocery Outlet monetizes vendor overstock, closeouts and seasonal excess to maintain a steady pipeline of off-price goods across food and nonfood categories. Its flexible sourcing from hundreds of suppliers and over 400 stores limits reliance on any single brand. This model helps support gross-margin resilience, with gross margins generally in the high-20s in recent quarters.

Lean store economics
Smaller boxes (~10,000 sq ft) and efficient operations reduce fixed costs, allowing Grocery Outlet to sustain lower everyday prices while preserving margins. The independent operator model aligns local incentives, improving inventory turns and community pricing. Lean overhead enables profitable entry into value-focused trade areas.
- Average store ~10,000 sq ft
- Independent operator model
- Lower overhead → price leadership
- Profitable in value trade areas
Everyday plus specialty mix
Everyday staples plus organic and specialty SKUs broaden Grocery Outlet's appeal, supporting both quick fills and treasure-hunt trips; the format helped drive FY2024 net sales of about $4.5 billion and a store base near 430 locations. This mix attracts budget shoppers and foodies, boosting basket size and reachable wallet share.
- Appeal: staples + specialty
- Behavior: quick fills + discovery
- Segments: budget and foodie
- Scale: ~430 stores; ~$4.5B FY2024 sales
Closeout grocer: 40–70% discounts, high-20s% gross margin, ~430 stores, $4.5B sales
Grocery Outlet captures branded closeouts at roughly 40–70% below typical supermarket prices, enforcing everyday low pricing that boosts traffic and repeat visits. The treasure-hunt assortment increases basket size and impulse buys, while a ~10,000 sq ft independent-operator model keeps overhead low and margins resilient. FY2024 net sales about $4.5B with gross margins in the high-20s support profitable expansion to ~430 stores.
| Metric | Value |
|---|---|
| FY2024 Net Sales | $4.5B |
| Store Count | ~430 |
| Avg Store Size | ~10,000 sq ft |
| Gross Margin | High-20s% |
| Typical Discount | 40–70% |
What is included in the product
 Detailed Word Document
Provides a concise strategic overview of Grocery Outlet’s internal strengths and weaknesses and external opportunities and threats, highlighting its off-price grocery model, supply-chain advantages, expansion potential, and key risks from competition, pricing pressure, and changing consumer behavior.

 Customizable Excel Spreadsheet
Provides a focused Grocery Outlet SWOT that clarifies competitive risks and local-market opportunities, enabling quick stakeholder alignment and faster, actionable planning.
Weaknesses

Assortment inconsistency
Opportunistic sourcing at Grocery Outlet, which stocks roughly 3,000–5,000 SKUs per store, inherently limits SKU continuity and means shoppers often cannot find the same item on repeat trips. This inconsistency undermines full-basket missions and loyalty—especially as the chain expanded to about 430 stores by mid-2025—while complicating planogram consistency and inventory forecasting for both corporate and independent franchise operations.
Brand perception risk
Closeouts can signal dated or short-dated goods to some customers, risking brand trust despite Grocery Outlet reporting approximately $2.7 billion in net sales in 2024. Perceived quality variability may deter premium shoppers and limit basket size growth. Marketing must educate on curated value propositions without eroding credibility, while returns and QC processes require rigor to maintain repeat purchase rates and protect margins.

Limited private label scale
Grocery Outlet's private-label penetration is materially lower than hard discounters—Aldi carries roughly 90% private-label assortments and Trader Joe's about 80%—which limits GO's margin control, product consistency and repeatable differentiation on core SKUs; moving toward higher owned-brand mix would require new sourcing, quality-control capabilities and likely increased supply-chain investment.

Operator variability
Independent owner-operators, present in over 420 Grocery Outlet locations nationwide, can drive uneven execution across the chain; service levels, merchandising and shrink control often vary by operator and region. This variability undermines customer experience and brand integrity, requiring continuous investment in oversight, training and centralized support that pressures SG&A.
- Operator variability: independent owner-operators
- Impact areas: service, merchandising, shrink
- Brand risk: inconsistent customer experience
- Mitigation: ongoing oversight & training costs
Dependence on vendor excess
The Grocery Outlet model depends on predictable vendor excess, so if CPGs tighten supply chains deal flow could shrink. Less excess would compress assortment depth and gross margins, increasing inventory risk. The chain must scale alternative sourcing and private-label fill to backfill gaps and protect sales.
- Risk: vendor overstock reliance
- Impact: narrower assortment, margin pressure
- Mitigation: diversify sourcing, expand private label
Opportunistic sourcing with 3,000–5,000 SKUs per store across ~430 stores limits repeat purchases
Opportunistic sourcing (3,000–5,000 SKUs/store) reduces SKU continuity and repeat purchases across ~430 stores (mid‑2025). Closeout-heavy assortments risk perceived quality despite ~$2.7B net sales (2024). Low private‑label penetration vs Aldi/Trader Joe's limits margin control. Independent operators cause execution variance, raising oversight SG&A.
| Metric | Value |
|---|---|
| Stores | ~430 (mid‑2025) |
| Net sales | $2.7B (2024) |
| SKUs/store | 3,000–5,000 |
Preview the Actual Deliverable
Grocery Outlet SWOT Analysis
This is a real excerpt from the complete Grocery Outlet SWOT analysis document you’ll receive upon purchase—no surprises, just professional quality. The preview below is taken directly from the full report, and the complete, editable version becomes available after checkout. Buy now to unlock the entire, structured analysis ready for use.

Make Insightful Decisions Backed by Expert Research
Grocery Outlet’s discount model drives strong customer loyalty and margin upside, but supply volatility and competitive pressure pose clear risks. Our full SWOT dives into financial metrics, market positioning, and strategic moves to scale profitably. Purchase the complete, editable report to power smarter investment or strategic decisions.
Strengths
Deep discount value
Grocery Outlet leverages opportunistic buying to secure branded goods at steep discounts—often quoted as 40–70% below conventional supermarket prices—enabling everyday low pricing that shoppers perceive as strong savings versus traditional grocers. That value leadership boosts traffic and repeat visits, and during inflationary periods the effective price gap versus big-box chains typically widens further.
Treasure-hunt appeal
Grocery Outlet's treasure-hunt format—constantly changing assortments—drives discovery and impulse buys, lifting basket size without heavy promotions. Scarcity and novelty create urgency that differentiates the shopping experience from routine grocers and fuels social word-of-mouth. The model supported Grocery Outlet's $3.16 billion net sales in fiscal 2023, underscoring commercial impact.
Flexible sourcing engine
Grocery Outlet monetizes vendor overstock, closeouts and seasonal excess to maintain a steady pipeline of off-price goods across food and nonfood categories. Its flexible sourcing from hundreds of suppliers and over 400 stores limits reliance on any single brand. This model helps support gross-margin resilience, with gross margins generally in the high-20s in recent quarters.
Lean store economics
Smaller boxes (~10,000 sq ft) and efficient operations reduce fixed costs, allowing Grocery Outlet to sustain lower everyday prices while preserving margins. The independent operator model aligns local incentives, improving inventory turns and community pricing. Lean overhead enables profitable entry into value-focused trade areas.
- Average store ~10,000 sq ft
- Independent operator model
- Lower overhead → price leadership
- Profitable in value trade areas
Everyday plus specialty mix
Everyday staples plus organic and specialty SKUs broaden Grocery Outlet's appeal, supporting both quick fills and treasure-hunt trips; the format helped drive FY2024 net sales of about $4.5 billion and a store base near 430 locations. This mix attracts budget shoppers and foodies, boosting basket size and reachable wallet share.
- Appeal: staples + specialty
- Behavior: quick fills + discovery
- Segments: budget and foodie
- Scale: ~430 stores; ~$4.5B FY2024 sales
Closeout grocer: 40–70% discounts, high-20s% gross margin, ~430 stores, $4.5B sales
Grocery Outlet captures branded closeouts at roughly 40–70% below typical supermarket prices, enforcing everyday low pricing that boosts traffic and repeat visits. The treasure-hunt assortment increases basket size and impulse buys, while a ~10,000 sq ft independent-operator model keeps overhead low and margins resilient. FY2024 net sales about $4.5B with gross margins in the high-20s support profitable expansion to ~430 stores.
| Metric | Value |
|---|---|
| FY2024 Net Sales | $4.5B |
| Store Count | ~430 |
| Avg Store Size | ~10,000 sq ft |
| Gross Margin | High-20s% |
| Typical Discount | 40–70% |
What is included in the product
Detailed Word Document
Provides a concise strategic overview of Grocery Outlet’s internal strengths and weaknesses and external opportunities and threats, highlighting its off-price grocery model, supply-chain advantages, expansion potential, and key risks from competition, pricing pressure, and changing consumer behavior.
Customizable Excel Spreadsheet
Provides a focused Grocery Outlet SWOT that clarifies competitive risks and local-market opportunities, enabling quick stakeholder alignment and faster, actionable planning.
Weaknesses
Assortment inconsistency
Opportunistic sourcing at Grocery Outlet, which stocks roughly 3,000–5,000 SKUs per store, inherently limits SKU continuity and means shoppers often cannot find the same item on repeat trips. This inconsistency undermines full-basket missions and loyalty—especially as the chain expanded to about 430 stores by mid-2025—while complicating planogram consistency and inventory forecasting for both corporate and independent franchise operations.
Brand perception risk
Closeouts can signal dated or short-dated goods to some customers, risking brand trust despite Grocery Outlet reporting approximately $2.7 billion in net sales in 2024. Perceived quality variability may deter premium shoppers and limit basket size growth. Marketing must educate on curated value propositions without eroding credibility, while returns and QC processes require rigor to maintain repeat purchase rates and protect margins.
Limited private label scale
Grocery Outlet's private-label penetration is materially lower than hard discounters—Aldi carries roughly 90% private-label assortments and Trader Joe's about 80%—which limits GO's margin control, product consistency and repeatable differentiation on core SKUs; moving toward higher owned-brand mix would require new sourcing, quality-control capabilities and likely increased supply-chain investment.
Operator variability
Independent owner-operators, present in over 420 Grocery Outlet locations nationwide, can drive uneven execution across the chain; service levels, merchandising and shrink control often vary by operator and region. This variability undermines customer experience and brand integrity, requiring continuous investment in oversight, training and centralized support that pressures SG&A.
- Operator variability: independent owner-operators
- Impact areas: service, merchandising, shrink
- Brand risk: inconsistent customer experience
- Mitigation: ongoing oversight & training costs
Dependence on vendor excess
The Grocery Outlet model depends on predictable vendor excess, so if CPGs tighten supply chains deal flow could shrink. Less excess would compress assortment depth and gross margins, increasing inventory risk. The chain must scale alternative sourcing and private-label fill to backfill gaps and protect sales.
- Risk: vendor overstock reliance
- Impact: narrower assortment, margin pressure
- Mitigation: diversify sourcing, expand private label
Opportunistic sourcing with 3,000–5,000 SKUs per store across ~430 stores limits repeat purchases
Opportunistic sourcing (3,000–5,000 SKUs/store) reduces SKU continuity and repeat purchases across ~430 stores (mid‑2025). Closeout-heavy assortments risk perceived quality despite ~$2.7B net sales (2024). Low private‑label penetration vs Aldi/Trader Joe's limits margin control. Independent operators cause execution variance, raising oversight SG&A.
| Metric | Value |
|---|---|
| Stores | ~430 (mid‑2025) |
| Net sales | $2.7B (2024) |
| SKUs/store | 3,000–5,000 |
Preview the Actual Deliverable
Grocery Outlet SWOT Analysis
This is a real excerpt from the complete Grocery Outlet SWOT analysis document you’ll receive upon purchase—no surprises, just professional quality. The preview below is taken directly from the full report, and the complete, editable version becomes available after checkout. Buy now to unlock the entire, structured analysis ready for use.
Description
Make Insightful Decisions Backed by Expert Research
Grocery Outlet’s discount model drives strong customer loyalty and margin upside, but supply volatility and competitive pressure pose clear risks. Our full SWOT dives into financial metrics, market positioning, and strategic moves to scale profitably. Purchase the complete, editable report to power smarter investment or strategic decisions.
Strengths
Deep discount value
Grocery Outlet leverages opportunistic buying to secure branded goods at steep discounts—often quoted as 40–70% below conventional supermarket prices—enabling everyday low pricing that shoppers perceive as strong savings versus traditional grocers. That value leadership boosts traffic and repeat visits, and during inflationary periods the effective price gap versus big-box chains typically widens further.
Treasure-hunt appeal
Grocery Outlet's treasure-hunt format—constantly changing assortments—drives discovery and impulse buys, lifting basket size without heavy promotions. Scarcity and novelty create urgency that differentiates the shopping experience from routine grocers and fuels social word-of-mouth. The model supported Grocery Outlet's $3.16 billion net sales in fiscal 2023, underscoring commercial impact.
Flexible sourcing engine
Grocery Outlet monetizes vendor overstock, closeouts and seasonal excess to maintain a steady pipeline of off-price goods across food and nonfood categories. Its flexible sourcing from hundreds of suppliers and over 400 stores limits reliance on any single brand. This model helps support gross-margin resilience, with gross margins generally in the high-20s in recent quarters.
Lean store economics
Smaller boxes (~10,000 sq ft) and efficient operations reduce fixed costs, allowing Grocery Outlet to sustain lower everyday prices while preserving margins. The independent operator model aligns local incentives, improving inventory turns and community pricing. Lean overhead enables profitable entry into value-focused trade areas.
- Average store ~10,000 sq ft
- Independent operator model
- Lower overhead → price leadership
- Profitable in value trade areas
Everyday plus specialty mix
Everyday staples plus organic and specialty SKUs broaden Grocery Outlet's appeal, supporting both quick fills and treasure-hunt trips; the format helped drive FY2024 net sales of about $4.5 billion and a store base near 430 locations. This mix attracts budget shoppers and foodies, boosting basket size and reachable wallet share.
- Appeal: staples + specialty
- Behavior: quick fills + discovery
- Segments: budget and foodie
- Scale: ~430 stores; ~$4.5B FY2024 sales
Closeout grocer: 40–70% discounts, high-20s% gross margin, ~430 stores, $4.5B sales
Grocery Outlet captures branded closeouts at roughly 40–70% below typical supermarket prices, enforcing everyday low pricing that boosts traffic and repeat visits. The treasure-hunt assortment increases basket size and impulse buys, while a ~10,000 sq ft independent-operator model keeps overhead low and margins resilient. FY2024 net sales about $4.5B with gross margins in the high-20s support profitable expansion to ~430 stores.
| Metric | Value |
|---|---|
| FY2024 Net Sales | $4.5B |
| Store Count | ~430 |
| Avg Store Size | ~10,000 sq ft |
| Gross Margin | High-20s% |
| Typical Discount | 40–70% |
What is included in the product
Detailed Word Document
Provides a concise strategic overview of Grocery Outlet’s internal strengths and weaknesses and external opportunities and threats, highlighting its off-price grocery model, supply-chain advantages, expansion potential, and key risks from competition, pricing pressure, and changing consumer behavior.
Customizable Excel Spreadsheet
Provides a focused Grocery Outlet SWOT that clarifies competitive risks and local-market opportunities, enabling quick stakeholder alignment and faster, actionable planning.
Weaknesses
Assortment inconsistency
Opportunistic sourcing at Grocery Outlet, which stocks roughly 3,000–5,000 SKUs per store, inherently limits SKU continuity and means shoppers often cannot find the same item on repeat trips. This inconsistency undermines full-basket missions and loyalty—especially as the chain expanded to about 430 stores by mid-2025—while complicating planogram consistency and inventory forecasting for both corporate and independent franchise operations.
Brand perception risk
Closeouts can signal dated or short-dated goods to some customers, risking brand trust despite Grocery Outlet reporting approximately $2.7 billion in net sales in 2024. Perceived quality variability may deter premium shoppers and limit basket size growth. Marketing must educate on curated value propositions without eroding credibility, while returns and QC processes require rigor to maintain repeat purchase rates and protect margins.
Limited private label scale
Grocery Outlet's private-label penetration is materially lower than hard discounters—Aldi carries roughly 90% private-label assortments and Trader Joe's about 80%—which limits GO's margin control, product consistency and repeatable differentiation on core SKUs; moving toward higher owned-brand mix would require new sourcing, quality-control capabilities and likely increased supply-chain investment.
Operator variability
Independent owner-operators, present in over 420 Grocery Outlet locations nationwide, can drive uneven execution across the chain; service levels, merchandising and shrink control often vary by operator and region. This variability undermines customer experience and brand integrity, requiring continuous investment in oversight, training and centralized support that pressures SG&A.
- Operator variability: independent owner-operators
- Impact areas: service, merchandising, shrink
- Brand risk: inconsistent customer experience
- Mitigation: ongoing oversight & training costs
Dependence on vendor excess
The Grocery Outlet model depends on predictable vendor excess, so if CPGs tighten supply chains deal flow could shrink. Less excess would compress assortment depth and gross margins, increasing inventory risk. The chain must scale alternative sourcing and private-label fill to backfill gaps and protect sales.
- Risk: vendor overstock reliance
- Impact: narrower assortment, margin pressure
- Mitigation: diversify sourcing, expand private label
Opportunistic sourcing with 3,000–5,000 SKUs per store across ~430 stores limits repeat purchases
Opportunistic sourcing (3,000–5,000 SKUs/store) reduces SKU continuity and repeat purchases across ~430 stores (mid‑2025). Closeout-heavy assortments risk perceived quality despite ~$2.7B net sales (2024). Low private‑label penetration vs Aldi/Trader Joe's limits margin control. Independent operators cause execution variance, raising oversight SG&A.
| Metric | Value |
|---|---|
| Stores | ~430 (mid‑2025) |
| Net sales | $2.7B (2024) |
| SKUs/store | 3,000–5,000 |
Preview the Actual Deliverable
Grocery Outlet SWOT Analysis
This is a real excerpt from the complete Grocery Outlet SWOT analysis document you’ll receive upon purchase—no surprises, just professional quality. The preview below is taken directly from the full report, and the complete, editable version becomes available after checkout. Buy now to unlock the entire, structured analysis ready for use.











