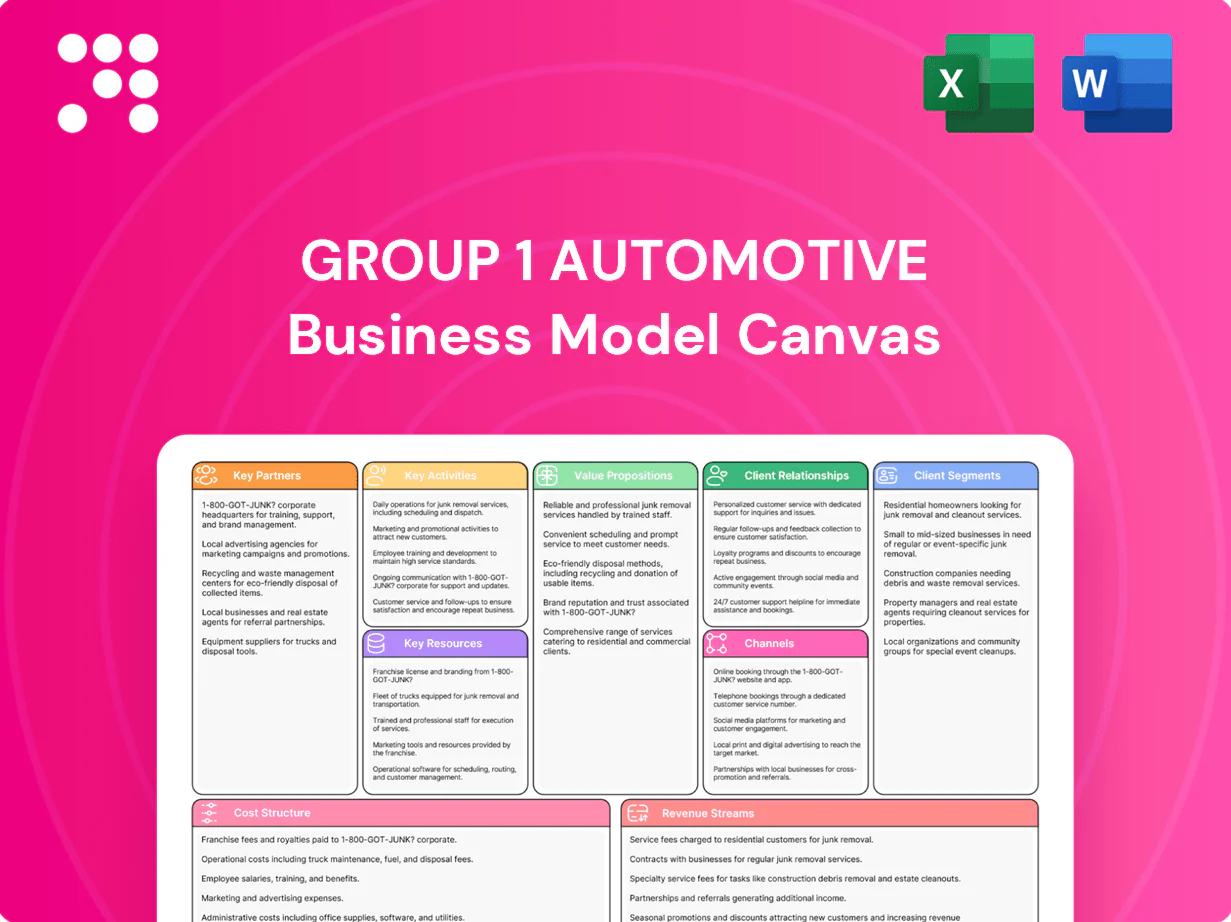
Group 1 Automotive Business Model Canvas

Automotive Retail Business Model Canvas: Investor-ready strategic snapshot
Unlock the strategic blueprint behind Group 1 Automotive with our concise Business Model Canvas. See how value propositions, customer segments, and revenue streams connect to drive growth and scale. Ideal for investors, consultants, and founders seeking actionable insight. Purchase the full, editable canvas to deep-dive and apply these strategies to your analysis.
Partnerships

OEM manufacturer alliances
Group 1 relies on franchise agreements with major OEMs to sell and service branded vehicles, leveraging over 200 franchised dealerships to secure model allocations, dealer incentives, training, and warranty reimbursement. Strong OEM relations ensure steady inventory flow and co-op marketing support, while granting access to certified parts and manufacturer software for certified service programs. These alliances underpin retail and fixed‑ops margins.
Finance and insurance providers
Group 1 partners with banks, captives, and insurers to underwrite loans, leases and F&I products, and in 2024 these partnerships supported an approval rate near 85%, widening customer access at point of sale.
These relationships increased per-vehicle F&I profitability, with F&I income averaging about $1,050 per retail unit in 2024, and co-developed products broadened customer choice while ensuring regulatory compliance.
Integrated systems and lender portals accelerated credit decisions, cutting average approval times at dealerships and boosting conversion at the point of sale in 2024.

Parts and aftermarket suppliers
Relationships with OEM and aftermarket distributors secure parts availability and competitive pricing, critical as the US aftermarket parts market reached an estimated $315 billion in 2024. Reliable supply chains support Group 1 Automotive collision centers and service bays, reducing cycle times and warranty delays. Preferred supplier programs boost gross margins and rebates through negotiated terms. Logistics partners optimize parts fill rates and same-/next-day delivery, improving technician productivity and customer retention.

Technology and digital platforms
- DMS/CRM: inventory, pricing, leads
- Online marketplaces: wider reach, 2024 buyer shift
- Marketing tech: targeted demand generation
- Digital retail: full online sales funnel
- Cybersecurity: data protection, compliance
Real estate and facility partners
Developers, landlords and contractors enable Group 1 Automotive's acquisitions and $1–3M dealership remodels while ensuring facility compliance with OEM image programs, vital for brand approvals; strategic locations across over 200 stores drive customer traffic and market presence, and facilities management partners reduce maintenance and utilities costs—often lowering utilities expense by up to 15%.
- Developers/contractors: acquisition & renovation
- OEM image compliance: mandatory for brand programs
- Locations: >200 stores, traffic & presence
- Facilities mgmt: maintenance + ~15% utilities savings
200+ dealerships, ~85% finance approval, $1,050 F&I per unit
Group 1's OEM, finance, parts, tech and facility partners sustain inventory, financing and service across 200+ franchised dealerships, enabling co-op marketing, certified service and ~85% finance approval in 2024. F&I income averaged ~$1,050 per retail unit and aftermarket supply alignment taps into a $315B US market. Digital and cybersecurity partners supported 86% online research-driven buyers and improved conversion; facilities partners trimmed utilities ~15%.
| Metric | 2024 Value |
|---|---|
| Dealerships | 200+ |
| Finance approval rate | ~85% |
| F&I income per unit | $1,050 |
| Aftermarket market size | $315B |
| Online research buyers | 86% |
| Utilities savings | ~15% |
What is included in the product
 Detailed Word Document
A comprehensive Business Model Canvas for Group 1 Automotive detailing customer segments, channels, value propositions, revenue streams and cost structure across the nine BMC blocks. Designed for investors and analysts, it links competitive advantages and SWOT insights to real-world dealership operations and growth strategy.

 Customizable Excel Spreadsheet
High-level view of Group 1 Automotive’s business model with editable cells, relieving the pain of fragmented dealership operations and complex revenue streams. Shareable one-page snapshot streamlines strategy alignment and saves hours preparing board-ready summaries.
Activities

Vehicle retailing operations
Sourcing, merchandising and selling new and used vehicles are core, supported by Group 1 Automotive’s network of about 200 dealerships across the US, UK and Brazil in 2024. Disciplined pricing, appraisals and trade-in processes drive margins and inventory turns. Sales execution combines robust online platforms with in-store operations to capture omnichannel demand. Compliance, lender documentation and titling are integral to closing every retail transaction.
Aftersales service delivery
Service, maintenance, and repairs drive recurring revenue across Group 1 Automotive’s network of more than 200 retail locations, contributing a stable aftermarket margin even when new-vehicle sales fluctuate. Efficient technician scheduling, bay utilization, and parts availability optimize throughput and labor productivity metrics. Timely warranty processing and rigorous quality control sustain OEM relationships and minimize chargebacks. Customer convenience offerings like pickup/drop and express lanes increase retention and service frequency.

F&I origination and products
F&I origination and protection products boost per-unit economics, with Cox Automotive reporting U.S. F&I gross of about $1,988 per retail unit in 2024. Lender matching, menu presentation, and e-contracting reduce cycle times and increase attach rates. Rigorous risk and regulatory adherence preserves margins and compliance. Robust post-sale cancellation and claims support maintains customer trust and retention.

Digital marketing and lead management
SEO, paid media and inventory syndication drive roughly 65% of digital lead volume for dealers in 2024, generating targeted demand for Group 1 Automotive showrooms. CRM platforms nurture leads across email, SMS and phone with tailored follow-ups, lifting conversion rates and lifetime value. Real-time analytics inform pricing and campaign optimization, while reputation management preserves brand equity and referral flow.
- SEO/paid: ~65% digital lead share
- CRM: multichannel nurturing
- Analytics: price & campaign optimization
- Reputation: protects brand & referrals
M&A and portfolio optimization
Acquiring, integrating, and occasional divestiture shape Group 1 Automotive’s footprint, which operates approximately 200 retail franchises across the US, UK and Brazil.
Diligence emphasizes brand mix, local market demographics and store-level profitability (same-store metrics and inventory turns) to target add-on ROI.
Integration standardizes DMS, processes and reporting for scale while real estate and capex plans align showrooms and service facilities with OEM image and warranty standards.
- dealerships: ~200
- focus: brand mix, demographics, profitability
- integration: DMS, processes, reporting
- capex: real estate aligned to OEM standards
Omnichannel dealer network: 200 dealerships, digital-led leads, F&I and service margin growth
Sourcing/retail of new and used vehicles across ~200 dealerships (US/UK/Brazil) drives core revenue; service/parts and F&I (US F&I gross ~$1,988/retail unit in 2024) boost margins. Digital (SEO/paid ~65% lead share) plus CRM/analytics optimize conversion and inventory turns; acquisitions and integration scale DMS, capex and OEM compliance.
| Metric | 2024 |
|---|---|
| Dealerships | ~200 |
| F&I gross/unit (US) | $1,988 |
| Digital lead share (SEO/paid) | ~65% |
Full Version Awaits
Business Model Canvas
The document you're previewing is the actual Group 1 Automotive Business Model Canvas, not a mockup. When you purchase, you’ll receive this exact file—fully formatted and complete—ready to edit, present, or share in Word and Excel. No surprises, just the real deliverable.

Automotive Retail Business Model Canvas: Investor-ready strategic snapshot
Unlock the strategic blueprint behind Group 1 Automotive with our concise Business Model Canvas. See how value propositions, customer segments, and revenue streams connect to drive growth and scale. Ideal for investors, consultants, and founders seeking actionable insight. Purchase the full, editable canvas to deep-dive and apply these strategies to your analysis.
Partnerships
OEM manufacturer alliances
Group 1 relies on franchise agreements with major OEMs to sell and service branded vehicles, leveraging over 200 franchised dealerships to secure model allocations, dealer incentives, training, and warranty reimbursement. Strong OEM relations ensure steady inventory flow and co-op marketing support, while granting access to certified parts and manufacturer software for certified service programs. These alliances underpin retail and fixed‑ops margins.
Finance and insurance providers
Group 1 partners with banks, captives, and insurers to underwrite loans, leases and F&I products, and in 2024 these partnerships supported an approval rate near 85%, widening customer access at point of sale.
These relationships increased per-vehicle F&I profitability, with F&I income averaging about $1,050 per retail unit in 2024, and co-developed products broadened customer choice while ensuring regulatory compliance.
Integrated systems and lender portals accelerated credit decisions, cutting average approval times at dealerships and boosting conversion at the point of sale in 2024.
Parts and aftermarket suppliers
Relationships with OEM and aftermarket distributors secure parts availability and competitive pricing, critical as the US aftermarket parts market reached an estimated $315 billion in 2024. Reliable supply chains support Group 1 Automotive collision centers and service bays, reducing cycle times and warranty delays. Preferred supplier programs boost gross margins and rebates through negotiated terms. Logistics partners optimize parts fill rates and same-/next-day delivery, improving technician productivity and customer retention.
Technology and digital platforms
- DMS/CRM: inventory, pricing, leads
- Online marketplaces: wider reach, 2024 buyer shift
- Marketing tech: targeted demand generation
- Digital retail: full online sales funnel
- Cybersecurity: data protection, compliance
Real estate and facility partners
Developers, landlords and contractors enable Group 1 Automotive's acquisitions and $1–3M dealership remodels while ensuring facility compliance with OEM image programs, vital for brand approvals; strategic locations across over 200 stores drive customer traffic and market presence, and facilities management partners reduce maintenance and utilities costs—often lowering utilities expense by up to 15%.
- Developers/contractors: acquisition & renovation
- OEM image compliance: mandatory for brand programs
- Locations: >200 stores, traffic & presence
- Facilities mgmt: maintenance + ~15% utilities savings
200+ dealerships, ~85% finance approval, $1,050 F&I per unit
Group 1's OEM, finance, parts, tech and facility partners sustain inventory, financing and service across 200+ franchised dealerships, enabling co-op marketing, certified service and ~85% finance approval in 2024. F&I income averaged ~$1,050 per retail unit and aftermarket supply alignment taps into a $315B US market. Digital and cybersecurity partners supported 86% online research-driven buyers and improved conversion; facilities partners trimmed utilities ~15%.
| Metric | 2024 Value |
|---|---|
| Dealerships | 200+ |
| Finance approval rate | ~85% |
| F&I income per unit | $1,050 |
| Aftermarket market size | $315B |
| Online research buyers | 86% |
| Utilities savings | ~15% |
What is included in the product
Detailed Word Document
A comprehensive Business Model Canvas for Group 1 Automotive detailing customer segments, channels, value propositions, revenue streams and cost structure across the nine BMC blocks. Designed for investors and analysts, it links competitive advantages and SWOT insights to real-world dealership operations and growth strategy.
Customizable Excel Spreadsheet
High-level view of Group 1 Automotive’s business model with editable cells, relieving the pain of fragmented dealership operations and complex revenue streams. Shareable one-page snapshot streamlines strategy alignment and saves hours preparing board-ready summaries.
Activities
Vehicle retailing operations
Sourcing, merchandising and selling new and used vehicles are core, supported by Group 1 Automotive’s network of about 200 dealerships across the US, UK and Brazil in 2024. Disciplined pricing, appraisals and trade-in processes drive margins and inventory turns. Sales execution combines robust online platforms with in-store operations to capture omnichannel demand. Compliance, lender documentation and titling are integral to closing every retail transaction.
Aftersales service delivery
Service, maintenance, and repairs drive recurring revenue across Group 1 Automotive’s network of more than 200 retail locations, contributing a stable aftermarket margin even when new-vehicle sales fluctuate. Efficient technician scheduling, bay utilization, and parts availability optimize throughput and labor productivity metrics. Timely warranty processing and rigorous quality control sustain OEM relationships and minimize chargebacks. Customer convenience offerings like pickup/drop and express lanes increase retention and service frequency.
F&I origination and products
F&I origination and protection products boost per-unit economics, with Cox Automotive reporting U.S. F&I gross of about $1,988 per retail unit in 2024. Lender matching, menu presentation, and e-contracting reduce cycle times and increase attach rates. Rigorous risk and regulatory adherence preserves margins and compliance. Robust post-sale cancellation and claims support maintains customer trust and retention.
Digital marketing and lead management
SEO, paid media and inventory syndication drive roughly 65% of digital lead volume for dealers in 2024, generating targeted demand for Group 1 Automotive showrooms. CRM platforms nurture leads across email, SMS and phone with tailored follow-ups, lifting conversion rates and lifetime value. Real-time analytics inform pricing and campaign optimization, while reputation management preserves brand equity and referral flow.
- SEO/paid: ~65% digital lead share
- CRM: multichannel nurturing
- Analytics: price & campaign optimization
- Reputation: protects brand & referrals
M&A and portfolio optimization
Acquiring, integrating, and occasional divestiture shape Group 1 Automotive’s footprint, which operates approximately 200 retail franchises across the US, UK and Brazil.
Diligence emphasizes brand mix, local market demographics and store-level profitability (same-store metrics and inventory turns) to target add-on ROI.
Integration standardizes DMS, processes and reporting for scale while real estate and capex plans align showrooms and service facilities with OEM image and warranty standards.
- dealerships: ~200
- focus: brand mix, demographics, profitability
- integration: DMS, processes, reporting
- capex: real estate aligned to OEM standards
Omnichannel dealer network: 200 dealerships, digital-led leads, F&I and service margin growth
Sourcing/retail of new and used vehicles across ~200 dealerships (US/UK/Brazil) drives core revenue; service/parts and F&I (US F&I gross ~$1,988/retail unit in 2024) boost margins. Digital (SEO/paid ~65% lead share) plus CRM/analytics optimize conversion and inventory turns; acquisitions and integration scale DMS, capex and OEM compliance.
| Metric | 2024 |
|---|---|
| Dealerships | ~200 |
| F&I gross/unit (US) | $1,988 |
| Digital lead share (SEO/paid) | ~65% |
Full Version Awaits
Business Model Canvas
The document you're previewing is the actual Group 1 Automotive Business Model Canvas, not a mockup. When you purchase, you’ll receive this exact file—fully formatted and complete—ready to edit, present, or share in Word and Excel. No surprises, just the real deliverable.
Description
Automotive Retail Business Model Canvas: Investor-ready strategic snapshot
Unlock the strategic blueprint behind Group 1 Automotive with our concise Business Model Canvas. See how value propositions, customer segments, and revenue streams connect to drive growth and scale. Ideal for investors, consultants, and founders seeking actionable insight. Purchase the full, editable canvas to deep-dive and apply these strategies to your analysis.
Partnerships
OEM manufacturer alliances
Group 1 relies on franchise agreements with major OEMs to sell and service branded vehicles, leveraging over 200 franchised dealerships to secure model allocations, dealer incentives, training, and warranty reimbursement. Strong OEM relations ensure steady inventory flow and co-op marketing support, while granting access to certified parts and manufacturer software for certified service programs. These alliances underpin retail and fixed‑ops margins.
Finance and insurance providers
Group 1 partners with banks, captives, and insurers to underwrite loans, leases and F&I products, and in 2024 these partnerships supported an approval rate near 85%, widening customer access at point of sale.
These relationships increased per-vehicle F&I profitability, with F&I income averaging about $1,050 per retail unit in 2024, and co-developed products broadened customer choice while ensuring regulatory compliance.
Integrated systems and lender portals accelerated credit decisions, cutting average approval times at dealerships and boosting conversion at the point of sale in 2024.
Parts and aftermarket suppliers
Relationships with OEM and aftermarket distributors secure parts availability and competitive pricing, critical as the US aftermarket parts market reached an estimated $315 billion in 2024. Reliable supply chains support Group 1 Automotive collision centers and service bays, reducing cycle times and warranty delays. Preferred supplier programs boost gross margins and rebates through negotiated terms. Logistics partners optimize parts fill rates and same-/next-day delivery, improving technician productivity and customer retention.
Technology and digital platforms
- DMS/CRM: inventory, pricing, leads
- Online marketplaces: wider reach, 2024 buyer shift
- Marketing tech: targeted demand generation
- Digital retail: full online sales funnel
- Cybersecurity: data protection, compliance
Real estate and facility partners
Developers, landlords and contractors enable Group 1 Automotive's acquisitions and $1–3M dealership remodels while ensuring facility compliance with OEM image programs, vital for brand approvals; strategic locations across over 200 stores drive customer traffic and market presence, and facilities management partners reduce maintenance and utilities costs—often lowering utilities expense by up to 15%.
- Developers/contractors: acquisition & renovation
- OEM image compliance: mandatory for brand programs
- Locations: >200 stores, traffic & presence
- Facilities mgmt: maintenance + ~15% utilities savings
200+ dealerships, ~85% finance approval, $1,050 F&I per unit
Group 1's OEM, finance, parts, tech and facility partners sustain inventory, financing and service across 200+ franchised dealerships, enabling co-op marketing, certified service and ~85% finance approval in 2024. F&I income averaged ~$1,050 per retail unit and aftermarket supply alignment taps into a $315B US market. Digital and cybersecurity partners supported 86% online research-driven buyers and improved conversion; facilities partners trimmed utilities ~15%.
| Metric | 2024 Value |
|---|---|
| Dealerships | 200+ |
| Finance approval rate | ~85% |
| F&I income per unit | $1,050 |
| Aftermarket market size | $315B |
| Online research buyers | 86% |
| Utilities savings | ~15% |
What is included in the product
Detailed Word Document
A comprehensive Business Model Canvas for Group 1 Automotive detailing customer segments, channels, value propositions, revenue streams and cost structure across the nine BMC blocks. Designed for investors and analysts, it links competitive advantages and SWOT insights to real-world dealership operations and growth strategy.
Customizable Excel Spreadsheet
High-level view of Group 1 Automotive’s business model with editable cells, relieving the pain of fragmented dealership operations and complex revenue streams. Shareable one-page snapshot streamlines strategy alignment and saves hours preparing board-ready summaries.
Activities
Vehicle retailing operations
Sourcing, merchandising and selling new and used vehicles are core, supported by Group 1 Automotive’s network of about 200 dealerships across the US, UK and Brazil in 2024. Disciplined pricing, appraisals and trade-in processes drive margins and inventory turns. Sales execution combines robust online platforms with in-store operations to capture omnichannel demand. Compliance, lender documentation and titling are integral to closing every retail transaction.
Aftersales service delivery
Service, maintenance, and repairs drive recurring revenue across Group 1 Automotive’s network of more than 200 retail locations, contributing a stable aftermarket margin even when new-vehicle sales fluctuate. Efficient technician scheduling, bay utilization, and parts availability optimize throughput and labor productivity metrics. Timely warranty processing and rigorous quality control sustain OEM relationships and minimize chargebacks. Customer convenience offerings like pickup/drop and express lanes increase retention and service frequency.
F&I origination and products
F&I origination and protection products boost per-unit economics, with Cox Automotive reporting U.S. F&I gross of about $1,988 per retail unit in 2024. Lender matching, menu presentation, and e-contracting reduce cycle times and increase attach rates. Rigorous risk and regulatory adherence preserves margins and compliance. Robust post-sale cancellation and claims support maintains customer trust and retention.
Digital marketing and lead management
SEO, paid media and inventory syndication drive roughly 65% of digital lead volume for dealers in 2024, generating targeted demand for Group 1 Automotive showrooms. CRM platforms nurture leads across email, SMS and phone with tailored follow-ups, lifting conversion rates and lifetime value. Real-time analytics inform pricing and campaign optimization, while reputation management preserves brand equity and referral flow.
- SEO/paid: ~65% digital lead share
- CRM: multichannel nurturing
- Analytics: price & campaign optimization
- Reputation: protects brand & referrals
M&A and portfolio optimization
Acquiring, integrating, and occasional divestiture shape Group 1 Automotive’s footprint, which operates approximately 200 retail franchises across the US, UK and Brazil.
Diligence emphasizes brand mix, local market demographics and store-level profitability (same-store metrics and inventory turns) to target add-on ROI.
Integration standardizes DMS, processes and reporting for scale while real estate and capex plans align showrooms and service facilities with OEM image and warranty standards.
- dealerships: ~200
- focus: brand mix, demographics, profitability
- integration: DMS, processes, reporting
- capex: real estate aligned to OEM standards
Omnichannel dealer network: 200 dealerships, digital-led leads, F&I and service margin growth
Sourcing/retail of new and used vehicles across ~200 dealerships (US/UK/Brazil) drives core revenue; service/parts and F&I (US F&I gross ~$1,988/retail unit in 2024) boost margins. Digital (SEO/paid ~65% lead share) plus CRM/analytics optimize conversion and inventory turns; acquisitions and integration scale DMS, capex and OEM compliance.
| Metric | 2024 |
|---|---|
| Dealerships | ~200 |
| F&I gross/unit (US) | $1,988 |
| Digital lead share (SEO/paid) | ~65% |
Full Version Awaits
Business Model Canvas
The document you're previewing is the actual Group 1 Automotive Business Model Canvas, not a mockup. When you purchase, you’ll receive this exact file—fully formatted and complete—ready to edit, present, or share in Word and Excel. No surprises, just the real deliverable.











