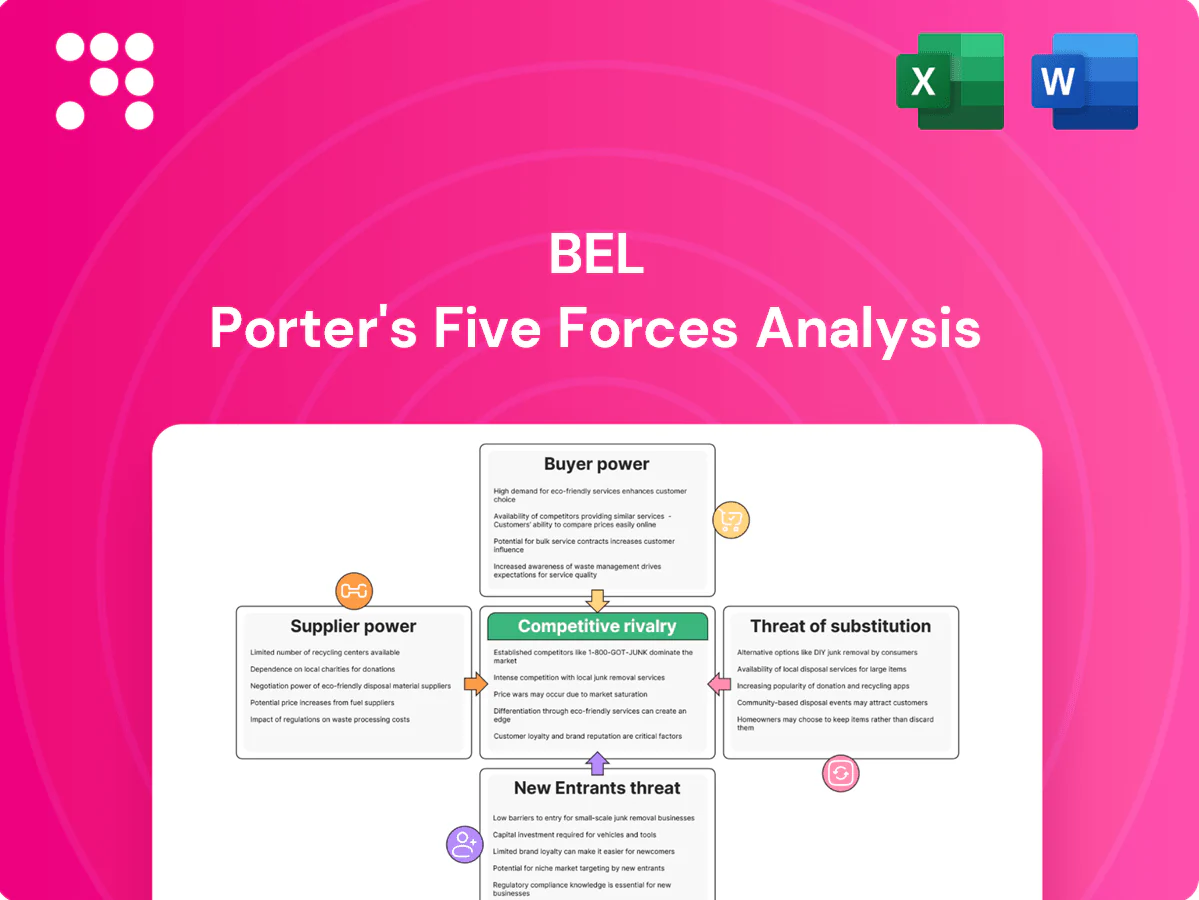
Bel Porter's Five Forces Analysis

Go Beyond the Preview—Access the Full Strategic Report
Bel's Porter's Five Forces snapshot highlights supplier influence, buyer pressure, rivalry intensity, threat of entrants and substitutes, and strategic leverage points. This brief reveals key competitive dynamics and risks. Unlock the full Porter's Five Forces Analysis for force-by-force ratings, visuals and actionable recommendations tailored to Bel.
Suppliers Bargaining Power

Dairy inputs concentration
Raw milk and specialist cheese cultures for Bel are sourced from regional dairy basins where supplier concentration is material; in 2024 cooperatives accounted for roughly 60% of milk collections in core European basins, giving them negotiating leverage through volume aggregation.
Bel mitigates risk via multi-sourcing and long-term farmer partnerships covering a significant share of supply, but localized shortages or cooperative consolidation have pushed input prices up, with European farm-gate milk prices rising about 15% year-on-year in 2023–24.
Price volatility exposure
Milk, cream and energy costs swing with seasonality, feed prices and regulation, and in 2024 the USDA reported an all-milk price near $24.40 per cwt, transmitting quickly to cheese production costs; hedging and long-term contracts dampen but do not eliminate volatility, and suppliers gain leverage during tight supply cycles when demand for higher-grade milk spikes.

Quality and compliance requirements
Cheese production demands stringent quality, traceability and safety regimes, with ISO 22000, BRC, SQF and PDO/PGI certifications widely required by buyers in 2024. Suppliers holding these credentials face fewer direct substitutes and command premium positions. Switching costs rise because qualification involves annual third‑party audits, multi‑month validation and product consistency programs. This elevates supplier bargaining power for compliant inputs.

Specialized packaging dependence
Portioned/snacking formats depend on proprietary films, waxes and portioning equipment, and in 2024 the global flexible packaging market was estimated at USD 136 billion, concentrating specialized suppliers and increasing their leverage. A smaller pool of qualified packaging vendors raises bargaining power as lead times, tooling costs and material compatibility create switching frictions. Any supplier disruption can bottleneck output and push up input prices.
- Few suppliers = higher leverage
- Long lead times, costly tooling
- Compatibility locks increase switching cost
- Disruptions can halt production
Logistics and locality
Milk is highly perishable and must be chilled below 4°C, tying processing plants to nearby suppliers and often limiting collection radii to under 100 km; local cooling and haulage constraints thus boost bargaining power of proximate farms and co‑ops. Supply-side leverage increased in 2024 as freight and energy volatility elevated logistics costs, and supplier power rises when alternative farms are distant or capacity‑constrained.
- Perishability: chilled <4°C
- Typical collection radius: <100 km
- 2024: freight/energy volatility raised logistics costs
- Supplier power up when alternatives distant or capacity‑constrained
High supplier power: EU co-ops ~60%, milk +15% y/y, packaging market USD136bn
Supplier power is high: regional co‑ops account for ~60% of milk collections in core European basins (2024), raising negotiating leverage. European farm‑gate milk rose ~15% y/y in 2023–24 and USDA all‑milk averaged $24.40/cwt (2024), boosting input costs. Packaging suppliers (global market ~USD 136bn in 2024) and certification holders command premiums and slow switching.
| Metric | Value (2024) |
|---|---|
| Co-op share (EU basins) | ~60% |
| Farm‑gate milk change | +15% y/y (2023–24) |
| US all‑milk price | $24.40/cwt |
| Flexible packaging market | USD 136bn |
| Typical collection radius | <100 km |
What is included in the product
 Detailed Word Document
Comprehensive Five Forces analysis for Bel, uncovering competitive drivers, buyer/supplier power, entry barriers, substitutes, and emerging disruptive threats to its market position.

 Customizable Excel Spreadsheet
A concise, one-sheet Five Forces snapshot that quantifies competitive pressure and feeds directly into decks—swap in your data, toggle scenarios, and export radar charts without macros for fast, board-ready insights.
Customers Bargaining Power

Retailer consolidation
Large grocers and discounters—Walmart (roughly 25% of US grocery sales in 2024), Kroger (~10%) and club stores like Costco—dominate shelf space and run aggressive tenders, using scale to extract listing fees and push private-label growth (US private-label penetration ~18% in 2024). Bel’s strong brands improve leverage but do not fully neutralize buyer power; negotiations hinge on velocity, category leadership and trade terms.
Private label alternatives
Supermarkets increasingly offer store-brand cheeses priced 15–30% below national brands, creating credible substitutes in commodity segments and raising buyer leverage. Brand equity and differentiated snack/portion SKUs preserve pricing power and margins in those niches. Large chains can threaten delisting or shift volumes to private label, and retailers with private-label penetration above 20% can extract meaningful concessions.

Price sensitivity and promotion
Cheese is heavily promoted and shoppers are promotion-driven—NielsenIQ 2024 reports promotions influence roughly 70% of FMCG purchase decisions—so retailers demand trade spend and promotional support to drive footfall. High promo dependence gives buyers bargaining chips and can force Bel into trade spend equal to 10–20% of category sales, risking margin erosion. Bel must balance brand equity with promo ROI to protect profitability.

Switching ease for consumers
Consumers can switch among brands and formats with minimal effort, aided by broad retail assortment and online channels; taste, convenience and perceived health benefits drive choices across snacking niches, while iconic SKUs maintain strong loyalty that lowers buyer power.
- Private-label share ~15% (2024)
- Price-sensitive segment ~40% (2024)
- High-repeat SKUs reduce buyer leverage
Foodservice and B2B dynamics
QSRs, caterers and manufacturers buy in bulk and in 2024 commonly account for 20–40% of a supplier’s volume, allowing tight specs and price pressure; volume concentration amplifies buyer leverage. Multi-year contracts (often 1–3 years) provide revenue stability but limit pricing flexibility. High service levels and consistency are decisive to retain accounts and protect margins.
- Leverage: bulk buyers drive lower prices
- Concentration: 20–40% of supplier volume
- Contracts: 1–3 years stabilize revenue
- Retention: service/consistency critical
Retail concentration, promotions and private label pressure margins and force trade spend
Large grocers (Walmart ~25% of US grocery sales, Kroger ~10%) and private-label penetration (~18% in 2024) give buyers strong leverage; Bel’s brands help but do not eliminate buyer power. Promotions drive ~70% of FMCG purchases, forcing trade spend (~10–20% of category sales). Bulk buyers (20–40% of supplier volume) extract lower prices despite multi-year contracts.
| Metric | 2024 |
|---|---|
| Walmart share | ~25% |
| Kroger share | ~10% |
| Private-label | ~18% |
| Promo influence | ~70% |
| Trade spend | 10–20% |
| Bulk buyers | 20–40% |
Full Version Awaits
Bel Porter's Five Forces Analysis
This preview shows the exact Bel Porter’s Five Forces Analysis you’ll receive—no mockups, no placeholders. It’s the final, fully formatted document covering competitive rivalry, buyer power, supplier power, threat of new entrants and substitutes. Purchase grants immediate access to this identical file, ready for download and use.

Go Beyond the Preview—Access the Full Strategic Report
Bel's Porter's Five Forces snapshot highlights supplier influence, buyer pressure, rivalry intensity, threat of entrants and substitutes, and strategic leverage points. This brief reveals key competitive dynamics and risks. Unlock the full Porter's Five Forces Analysis for force-by-force ratings, visuals and actionable recommendations tailored to Bel.
Suppliers Bargaining Power
Dairy inputs concentration
Raw milk and specialist cheese cultures for Bel are sourced from regional dairy basins where supplier concentration is material; in 2024 cooperatives accounted for roughly 60% of milk collections in core European basins, giving them negotiating leverage through volume aggregation.
Bel mitigates risk via multi-sourcing and long-term farmer partnerships covering a significant share of supply, but localized shortages or cooperative consolidation have pushed input prices up, with European farm-gate milk prices rising about 15% year-on-year in 2023–24.
Price volatility exposure
Milk, cream and energy costs swing with seasonality, feed prices and regulation, and in 2024 the USDA reported an all-milk price near $24.40 per cwt, transmitting quickly to cheese production costs; hedging and long-term contracts dampen but do not eliminate volatility, and suppliers gain leverage during tight supply cycles when demand for higher-grade milk spikes.
Quality and compliance requirements
Cheese production demands stringent quality, traceability and safety regimes, with ISO 22000, BRC, SQF and PDO/PGI certifications widely required by buyers in 2024. Suppliers holding these credentials face fewer direct substitutes and command premium positions. Switching costs rise because qualification involves annual third‑party audits, multi‑month validation and product consistency programs. This elevates supplier bargaining power for compliant inputs.
Specialized packaging dependence
Portioned/snacking formats depend on proprietary films, waxes and portioning equipment, and in 2024 the global flexible packaging market was estimated at USD 136 billion, concentrating specialized suppliers and increasing their leverage. A smaller pool of qualified packaging vendors raises bargaining power as lead times, tooling costs and material compatibility create switching frictions. Any supplier disruption can bottleneck output and push up input prices.
- Few suppliers = higher leverage
- Long lead times, costly tooling
- Compatibility locks increase switching cost
- Disruptions can halt production
Logistics and locality
Milk is highly perishable and must be chilled below 4°C, tying processing plants to nearby suppliers and often limiting collection radii to under 100 km; local cooling and haulage constraints thus boost bargaining power of proximate farms and co‑ops. Supply-side leverage increased in 2024 as freight and energy volatility elevated logistics costs, and supplier power rises when alternative farms are distant or capacity‑constrained.
- Perishability: chilled <4°C
- Typical collection radius: <100 km
- 2024: freight/energy volatility raised logistics costs
- Supplier power up when alternatives distant or capacity‑constrained
High supplier power: EU co-ops ~60%, milk +15% y/y, packaging market USD136bn
Supplier power is high: regional co‑ops account for ~60% of milk collections in core European basins (2024), raising negotiating leverage. European farm‑gate milk rose ~15% y/y in 2023–24 and USDA all‑milk averaged $24.40/cwt (2024), boosting input costs. Packaging suppliers (global market ~USD 136bn in 2024) and certification holders command premiums and slow switching.
| Metric | Value (2024) |
|---|---|
| Co-op share (EU basins) | ~60% |
| Farm‑gate milk change | +15% y/y (2023–24) |
| US all‑milk price | $24.40/cwt |
| Flexible packaging market | USD 136bn |
| Typical collection radius | <100 km |
What is included in the product
Detailed Word Document
Comprehensive Five Forces analysis for Bel, uncovering competitive drivers, buyer/supplier power, entry barriers, substitutes, and emerging disruptive threats to its market position.
Customizable Excel Spreadsheet
A concise, one-sheet Five Forces snapshot that quantifies competitive pressure and feeds directly into decks—swap in your data, toggle scenarios, and export radar charts without macros for fast, board-ready insights.
Customers Bargaining Power
Retailer consolidation
Large grocers and discounters—Walmart (roughly 25% of US grocery sales in 2024), Kroger (~10%) and club stores like Costco—dominate shelf space and run aggressive tenders, using scale to extract listing fees and push private-label growth (US private-label penetration ~18% in 2024). Bel’s strong brands improve leverage but do not fully neutralize buyer power; negotiations hinge on velocity, category leadership and trade terms.
Private label alternatives
Supermarkets increasingly offer store-brand cheeses priced 15–30% below national brands, creating credible substitutes in commodity segments and raising buyer leverage. Brand equity and differentiated snack/portion SKUs preserve pricing power and margins in those niches. Large chains can threaten delisting or shift volumes to private label, and retailers with private-label penetration above 20% can extract meaningful concessions.
Price sensitivity and promotion
Cheese is heavily promoted and shoppers are promotion-driven—NielsenIQ 2024 reports promotions influence roughly 70% of FMCG purchase decisions—so retailers demand trade spend and promotional support to drive footfall. High promo dependence gives buyers bargaining chips and can force Bel into trade spend equal to 10–20% of category sales, risking margin erosion. Bel must balance brand equity with promo ROI to protect profitability.
Switching ease for consumers
Consumers can switch among brands and formats with minimal effort, aided by broad retail assortment and online channels; taste, convenience and perceived health benefits drive choices across snacking niches, while iconic SKUs maintain strong loyalty that lowers buyer power.
- Private-label share ~15% (2024)
- Price-sensitive segment ~40% (2024)
- High-repeat SKUs reduce buyer leverage
Foodservice and B2B dynamics
QSRs, caterers and manufacturers buy in bulk and in 2024 commonly account for 20–40% of a supplier’s volume, allowing tight specs and price pressure; volume concentration amplifies buyer leverage. Multi-year contracts (often 1–3 years) provide revenue stability but limit pricing flexibility. High service levels and consistency are decisive to retain accounts and protect margins.
- Leverage: bulk buyers drive lower prices
- Concentration: 20–40% of supplier volume
- Contracts: 1–3 years stabilize revenue
- Retention: service/consistency critical
Retail concentration, promotions and private label pressure margins and force trade spend
Large grocers (Walmart ~25% of US grocery sales, Kroger ~10%) and private-label penetration (~18% in 2024) give buyers strong leverage; Bel’s brands help but do not eliminate buyer power. Promotions drive ~70% of FMCG purchases, forcing trade spend (~10–20% of category sales). Bulk buyers (20–40% of supplier volume) extract lower prices despite multi-year contracts.
| Metric | 2024 |
|---|---|
| Walmart share | ~25% |
| Kroger share | ~10% |
| Private-label | ~18% |
| Promo influence | ~70% |
| Trade spend | 10–20% |
| Bulk buyers | 20–40% |
Full Version Awaits
Bel Porter's Five Forces Analysis
This preview shows the exact Bel Porter’s Five Forces Analysis you’ll receive—no mockups, no placeholders. It’s the final, fully formatted document covering competitive rivalry, buyer power, supplier power, threat of new entrants and substitutes. Purchase grants immediate access to this identical file, ready for download and use.
Description
Go Beyond the Preview—Access the Full Strategic Report
Bel's Porter's Five Forces snapshot highlights supplier influence, buyer pressure, rivalry intensity, threat of entrants and substitutes, and strategic leverage points. This brief reveals key competitive dynamics and risks. Unlock the full Porter's Five Forces Analysis for force-by-force ratings, visuals and actionable recommendations tailored to Bel.
Suppliers Bargaining Power
Dairy inputs concentration
Raw milk and specialist cheese cultures for Bel are sourced from regional dairy basins where supplier concentration is material; in 2024 cooperatives accounted for roughly 60% of milk collections in core European basins, giving them negotiating leverage through volume aggregation.
Bel mitigates risk via multi-sourcing and long-term farmer partnerships covering a significant share of supply, but localized shortages or cooperative consolidation have pushed input prices up, with European farm-gate milk prices rising about 15% year-on-year in 2023–24.
Price volatility exposure
Milk, cream and energy costs swing with seasonality, feed prices and regulation, and in 2024 the USDA reported an all-milk price near $24.40 per cwt, transmitting quickly to cheese production costs; hedging and long-term contracts dampen but do not eliminate volatility, and suppliers gain leverage during tight supply cycles when demand for higher-grade milk spikes.
Quality and compliance requirements
Cheese production demands stringent quality, traceability and safety regimes, with ISO 22000, BRC, SQF and PDO/PGI certifications widely required by buyers in 2024. Suppliers holding these credentials face fewer direct substitutes and command premium positions. Switching costs rise because qualification involves annual third‑party audits, multi‑month validation and product consistency programs. This elevates supplier bargaining power for compliant inputs.
Specialized packaging dependence
Portioned/snacking formats depend on proprietary films, waxes and portioning equipment, and in 2024 the global flexible packaging market was estimated at USD 136 billion, concentrating specialized suppliers and increasing their leverage. A smaller pool of qualified packaging vendors raises bargaining power as lead times, tooling costs and material compatibility create switching frictions. Any supplier disruption can bottleneck output and push up input prices.
- Few suppliers = higher leverage
- Long lead times, costly tooling
- Compatibility locks increase switching cost
- Disruptions can halt production
Logistics and locality
Milk is highly perishable and must be chilled below 4°C, tying processing plants to nearby suppliers and often limiting collection radii to under 100 km; local cooling and haulage constraints thus boost bargaining power of proximate farms and co‑ops. Supply-side leverage increased in 2024 as freight and energy volatility elevated logistics costs, and supplier power rises when alternative farms are distant or capacity‑constrained.
- Perishability: chilled <4°C
- Typical collection radius: <100 km
- 2024: freight/energy volatility raised logistics costs
- Supplier power up when alternatives distant or capacity‑constrained
High supplier power: EU co-ops ~60%, milk +15% y/y, packaging market USD136bn
Supplier power is high: regional co‑ops account for ~60% of milk collections in core European basins (2024), raising negotiating leverage. European farm‑gate milk rose ~15% y/y in 2023–24 and USDA all‑milk averaged $24.40/cwt (2024), boosting input costs. Packaging suppliers (global market ~USD 136bn in 2024) and certification holders command premiums and slow switching.
| Metric | Value (2024) |
|---|---|
| Co-op share (EU basins) | ~60% |
| Farm‑gate milk change | +15% y/y (2023–24) |
| US all‑milk price | $24.40/cwt |
| Flexible packaging market | USD 136bn |
| Typical collection radius | <100 km |
What is included in the product
Detailed Word Document
Comprehensive Five Forces analysis for Bel, uncovering competitive drivers, buyer/supplier power, entry barriers, substitutes, and emerging disruptive threats to its market position.
Customizable Excel Spreadsheet
A concise, one-sheet Five Forces snapshot that quantifies competitive pressure and feeds directly into decks—swap in your data, toggle scenarios, and export radar charts without macros for fast, board-ready insights.
Customers Bargaining Power
Retailer consolidation
Large grocers and discounters—Walmart (roughly 25% of US grocery sales in 2024), Kroger (~10%) and club stores like Costco—dominate shelf space and run aggressive tenders, using scale to extract listing fees and push private-label growth (US private-label penetration ~18% in 2024). Bel’s strong brands improve leverage but do not fully neutralize buyer power; negotiations hinge on velocity, category leadership and trade terms.
Private label alternatives
Supermarkets increasingly offer store-brand cheeses priced 15–30% below national brands, creating credible substitutes in commodity segments and raising buyer leverage. Brand equity and differentiated snack/portion SKUs preserve pricing power and margins in those niches. Large chains can threaten delisting or shift volumes to private label, and retailers with private-label penetration above 20% can extract meaningful concessions.
Price sensitivity and promotion
Cheese is heavily promoted and shoppers are promotion-driven—NielsenIQ 2024 reports promotions influence roughly 70% of FMCG purchase decisions—so retailers demand trade spend and promotional support to drive footfall. High promo dependence gives buyers bargaining chips and can force Bel into trade spend equal to 10–20% of category sales, risking margin erosion. Bel must balance brand equity with promo ROI to protect profitability.
Switching ease for consumers
Consumers can switch among brands and formats with minimal effort, aided by broad retail assortment and online channels; taste, convenience and perceived health benefits drive choices across snacking niches, while iconic SKUs maintain strong loyalty that lowers buyer power.
- Private-label share ~15% (2024)
- Price-sensitive segment ~40% (2024)
- High-repeat SKUs reduce buyer leverage
Foodservice and B2B dynamics
QSRs, caterers and manufacturers buy in bulk and in 2024 commonly account for 20–40% of a supplier’s volume, allowing tight specs and price pressure; volume concentration amplifies buyer leverage. Multi-year contracts (often 1–3 years) provide revenue stability but limit pricing flexibility. High service levels and consistency are decisive to retain accounts and protect margins.
- Leverage: bulk buyers drive lower prices
- Concentration: 20–40% of supplier volume
- Contracts: 1–3 years stabilize revenue
- Retention: service/consistency critical
Retail concentration, promotions and private label pressure margins and force trade spend
Large grocers (Walmart ~25% of US grocery sales, Kroger ~10%) and private-label penetration (~18% in 2024) give buyers strong leverage; Bel’s brands help but do not eliminate buyer power. Promotions drive ~70% of FMCG purchases, forcing trade spend (~10–20% of category sales). Bulk buyers (20–40% of supplier volume) extract lower prices despite multi-year contracts.
| Metric | 2024 |
|---|---|
| Walmart share | ~25% |
| Kroger share | ~10% |
| Private-label | ~18% |
| Promo influence | ~70% |
| Trade spend | 10–20% |
| Bulk buyers | 20–40% |
Full Version Awaits
Bel Porter's Five Forces Analysis
This preview shows the exact Bel Porter’s Five Forces Analysis you’ll receive—no mockups, no placeholders. It’s the final, fully formatted document covering competitive rivalry, buyer power, supplier power, threat of new entrants and substitutes. Purchase grants immediate access to this identical file, ready for download and use.











