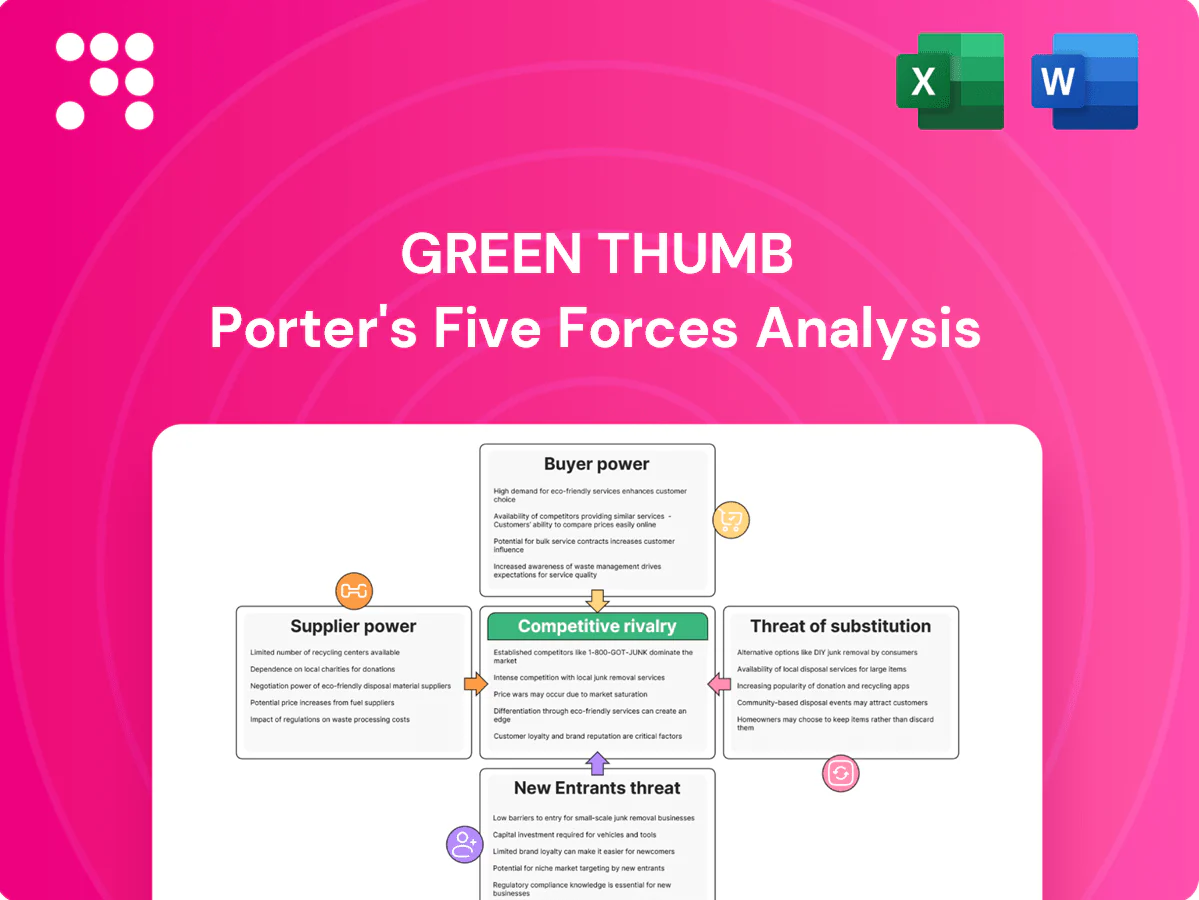
Green Thumb Porter's Five Forces Analysis

A Must-Have Tool for Decision-Makers
Green Thumb's Porter's Five Forces snapshot highlights supplier leverage, buyer power, competitive rivalry, substitute threats, and barriers to entry shaping its market position. This brief overview surfaces key strategic pressures but omits force-by-force ratings and visuals. Unlock the full report for a consultant-grade, data-driven breakdown to inform investment or strategy decisions.
Suppliers Bargaining Power

Specialized inputs and genetics
Specialized genetics, advanced lighting, HVAC, and compliant packaging come from a limited vendor pool, raising switching costs and giving suppliers leverage on lead times and pricing; this concentration is meaningful as US legal cannabis sales approached $29 billion in 2024. GTI’s scale lets it multi-source where possible and dilute single-vendor risk. Long-term relationships and volume commitments allow GTI to negotiate improved delivery and pricing terms.
Vertical integration dampens leverage
As of 2024 GTI owns cultivation and manufacturing facilities, reducing dependence on third-party biomass suppliers. Internalizing these steps limits exposure to upstream price spikes and improves planning around yields and strain availability, a point GTI emphasized in 2024 investor materials. Supplier power diminishes when GTI can backfill demand with in-house capacity and expanded cultivation footprint in 2024.

Regulatory-approved bottlenecks
State rules narrow options for testing labs, child-resistant packaging and track-and-trace vendors, often leaving fewer than five approved suppliers per state, giving vendors price and service leverage; in 2024 compliance windows of 30–90 days forced buyers into less favorable terms. GTI mitigates risk by prequalifying vendors and keeping redundancy with 3+ approved suppliers.

Biomass oversupply in mature markets
In mature US markets with cultivation overbuild, wholesale flower has become commoditized, shifting bargaining power toward buyers like GTI; spot deals and discounting — reported up to 40% in oversupplied regions in 2024 — compress input costs and margin pressure on growers, while slowed inventory turns (often exceeding 90–120 days in 2024) further weaken supplier leverage.
- commoditization
- buyer leverage
- discounting up to 40% (2024)
- inventory days 90–120+ (2024)
Process lock-in and lead times
Process lock-in means changing substrates, nutrients, or equipment risks yield variability; grow cycles and validation extend switching times, often 6–12 weeks per cycle in cannabis cultivation (2024). Suppliers can extract value via price premiums and restrictive contract terms during transitions. GTI counters with strict SOPs and pilot testing before full shifts.
- Risk: yield variability
- Lead time: 6–12 weeks/cycle
- Supplier leverage: price/contract rents
- GTI mitigation: SOPs + pilots
Supplier leverage vs verticals as 40% discounts hit US cannabis
Limited vendor pools for genetics, lighting, HVAC and compliant packaging give suppliers pricing and lead-time leverage, but GTI’s vertical integration and multi-sourcing reduce dependence. Regulatory-approved vendor lists and process lock-in (6–12 week grow cycles) sustain some supplier rents, while commoditization in mature markets shifts power to buyers. Price pressures and oversupply drove discounts up to 40% in 2024.
| Metric | 2024 |
|---|---|
| US legal cannabis sales | $29B |
| Max reported discount | 40% |
| Inventory days | 90–120+ |
| Grow cycle switching | 6–12 weeks |
What is included in the product
 Detailed Word Document
Uncovers key drivers of competition, buyer and supplier power, substitutes, and entry barriers specific to Green Thumb, with strategic commentary on threats and opportunities; fully editable for use in investor materials, strategy decks, or academic projects.

 Customizable Excel Spreadsheet
A concise one-sheet Five Forces kit for Green Thumb highlights competitive pressures and relief options at a glance; editable pressure levels and an instant radar chart make scenario testing for product, channel, or regulatory shifts fast and actionable.
Customers Bargaining Power

Own retail offsets wholesale leverage
Operating over 140 retail stores across 12+ states gives Green Thumb a captive channel and guaranteed internal shelf space, cutting reliance on third-party retailers that demand margin and promotions. Proprietary POS and loyalty data from dispensaries enable tailored assortments and price strategies that raise basket size and reduce SKU markdowns. Wholesale accounts remain important, but steady internal throughput materially blunts buyer leverage.
Price sensitivity and compression
Consumers compare strains, formats and potencies across retailers, making price a primary decision driver; in mature US markets legal retail sales (~$32B in 2024) compete with an illicit market that still accounts for over 50% of consumption (2024 estimates), anchoring expectations lower. Retailers, including Green Thumb, push promotions and bundle deals to win foot traffic, intensifying buyer leverage and compressing prices and margins.

Brand equity tempers switching
Recognized brands in edibles, vapes and flower drive repeat purchases, with consistent quality and effects creating perceived differentiation that lowers price elasticity and cuts retailer pressure for deep discounts. GTI’s broad portfolio and national brands helped defend shelf space across 170+ retail locations, supporting reported 2024 revenue of about $1.1 billion and higher-margin branded SKUs.

Segment differences in sensitivity
Medical patients prioritize reliability and therapeutic outcomes, reducing price sensitivity and increasing loyalty; in 2024 US legal cannabis sales totaled about $30 billion (BDSA), with medical channels showing higher average order values. Adult-use tourists favor convenience and brand recognition, driving sales spikes in destination markets. Daily users are price- and promo-sensitive, amplifying buyer power where they dominate; overall buyer leverage shifts with state segment mix.
- Medical: low price sensitivity, higher AOV
- Tourists: convenience/brand-driven, seasonal spikes
- Daily users: value-seeking, promo-responsive
Low switching costs at retail
Shoppers can easily move across brands and SKUs in-store, with budtender recommendations frequently steering final basket choices and trial purchases. Retailers reallocate facings quickly based on velocity, enabling rapid promotion shifts and shelf displacement. This dynamic keeps upward pressure on vendor concessions and slotting terms as suppliers compete for premium shelf space.
- Low switching costs
- High budtender influence
- Rapid facing reallocation
- Upward vendor concessions
Retail footprint and loyalty data blunt wholesale leverage amid >50% illicit share
Customers wield moderate-to-high bargaining power: price-sensitive daily buyers and illicit-market competition (over 50% of consumption in 2024) compress margins, while brand-loyal and medical patients reduce elasticity. Green Thumb’s proprietary POS/loyalty data and 170+ retail locations help blunt wholesale buyer leverage and drove reported 2024 revenue of about $1.1 billion. Promotions and easy SKU switching keep upward pressure on vendor concessions.
| Metric | 2024 |
|---|---|
| GTI revenue | $1.1B |
| US legal retail sales | $32B |
| Illicit share of consumption | >50% |
| Retail locations | 170+ |
Preview the Actual Deliverable
Green Thumb Porter's Five Forces Analysis
The Green Thumb Porter's Five Forces Analysis you see here is the exact, fully formatted document you'll receive immediately after purchase. It contains the full competitive assessment and actionable insights—no mockups or placeholders. Ready for instant download and use upon payment.

A Must-Have Tool for Decision-Makers
Green Thumb's Porter's Five Forces snapshot highlights supplier leverage, buyer power, competitive rivalry, substitute threats, and barriers to entry shaping its market position. This brief overview surfaces key strategic pressures but omits force-by-force ratings and visuals. Unlock the full report for a consultant-grade, data-driven breakdown to inform investment or strategy decisions.
Suppliers Bargaining Power
Specialized inputs and genetics
Specialized genetics, advanced lighting, HVAC, and compliant packaging come from a limited vendor pool, raising switching costs and giving suppliers leverage on lead times and pricing; this concentration is meaningful as US legal cannabis sales approached $29 billion in 2024. GTI’s scale lets it multi-source where possible and dilute single-vendor risk. Long-term relationships and volume commitments allow GTI to negotiate improved delivery and pricing terms.
Vertical integration dampens leverage
As of 2024 GTI owns cultivation and manufacturing facilities, reducing dependence on third-party biomass suppliers. Internalizing these steps limits exposure to upstream price spikes and improves planning around yields and strain availability, a point GTI emphasized in 2024 investor materials. Supplier power diminishes when GTI can backfill demand with in-house capacity and expanded cultivation footprint in 2024.
Regulatory-approved bottlenecks
State rules narrow options for testing labs, child-resistant packaging and track-and-trace vendors, often leaving fewer than five approved suppliers per state, giving vendors price and service leverage; in 2024 compliance windows of 30–90 days forced buyers into less favorable terms. GTI mitigates risk by prequalifying vendors and keeping redundancy with 3+ approved suppliers.
Biomass oversupply in mature markets
In mature US markets with cultivation overbuild, wholesale flower has become commoditized, shifting bargaining power toward buyers like GTI; spot deals and discounting — reported up to 40% in oversupplied regions in 2024 — compress input costs and margin pressure on growers, while slowed inventory turns (often exceeding 90–120 days in 2024) further weaken supplier leverage.
- commoditization
- buyer leverage
- discounting up to 40% (2024)
- inventory days 90–120+ (2024)
Process lock-in and lead times
Process lock-in means changing substrates, nutrients, or equipment risks yield variability; grow cycles and validation extend switching times, often 6–12 weeks per cycle in cannabis cultivation (2024). Suppliers can extract value via price premiums and restrictive contract terms during transitions. GTI counters with strict SOPs and pilot testing before full shifts.
- Risk: yield variability
- Lead time: 6–12 weeks/cycle
- Supplier leverage: price/contract rents
- GTI mitigation: SOPs + pilots
Supplier leverage vs verticals as 40% discounts hit US cannabis
Limited vendor pools for genetics, lighting, HVAC and compliant packaging give suppliers pricing and lead-time leverage, but GTI’s vertical integration and multi-sourcing reduce dependence. Regulatory-approved vendor lists and process lock-in (6–12 week grow cycles) sustain some supplier rents, while commoditization in mature markets shifts power to buyers. Price pressures and oversupply drove discounts up to 40% in 2024.
| Metric | 2024 |
|---|---|
| US legal cannabis sales | $29B |
| Max reported discount | 40% |
| Inventory days | 90–120+ |
| Grow cycle switching | 6–12 weeks |
What is included in the product
Detailed Word Document
Uncovers key drivers of competition, buyer and supplier power, substitutes, and entry barriers specific to Green Thumb, with strategic commentary on threats and opportunities; fully editable for use in investor materials, strategy decks, or academic projects.
Customizable Excel Spreadsheet
A concise one-sheet Five Forces kit for Green Thumb highlights competitive pressures and relief options at a glance; editable pressure levels and an instant radar chart make scenario testing for product, channel, or regulatory shifts fast and actionable.
Customers Bargaining Power
Own retail offsets wholesale leverage
Operating over 140 retail stores across 12+ states gives Green Thumb a captive channel and guaranteed internal shelf space, cutting reliance on third-party retailers that demand margin and promotions. Proprietary POS and loyalty data from dispensaries enable tailored assortments and price strategies that raise basket size and reduce SKU markdowns. Wholesale accounts remain important, but steady internal throughput materially blunts buyer leverage.
Price sensitivity and compression
Consumers compare strains, formats and potencies across retailers, making price a primary decision driver; in mature US markets legal retail sales (~$32B in 2024) compete with an illicit market that still accounts for over 50% of consumption (2024 estimates), anchoring expectations lower. Retailers, including Green Thumb, push promotions and bundle deals to win foot traffic, intensifying buyer leverage and compressing prices and margins.
Brand equity tempers switching
Recognized brands in edibles, vapes and flower drive repeat purchases, with consistent quality and effects creating perceived differentiation that lowers price elasticity and cuts retailer pressure for deep discounts. GTI’s broad portfolio and national brands helped defend shelf space across 170+ retail locations, supporting reported 2024 revenue of about $1.1 billion and higher-margin branded SKUs.
Segment differences in sensitivity
Medical patients prioritize reliability and therapeutic outcomes, reducing price sensitivity and increasing loyalty; in 2024 US legal cannabis sales totaled about $30 billion (BDSA), with medical channels showing higher average order values. Adult-use tourists favor convenience and brand recognition, driving sales spikes in destination markets. Daily users are price- and promo-sensitive, amplifying buyer power where they dominate; overall buyer leverage shifts with state segment mix.
- Medical: low price sensitivity, higher AOV
- Tourists: convenience/brand-driven, seasonal spikes
- Daily users: value-seeking, promo-responsive
Low switching costs at retail
Shoppers can easily move across brands and SKUs in-store, with budtender recommendations frequently steering final basket choices and trial purchases. Retailers reallocate facings quickly based on velocity, enabling rapid promotion shifts and shelf displacement. This dynamic keeps upward pressure on vendor concessions and slotting terms as suppliers compete for premium shelf space.
- Low switching costs
- High budtender influence
- Rapid facing reallocation
- Upward vendor concessions
Retail footprint and loyalty data blunt wholesale leverage amid >50% illicit share
Customers wield moderate-to-high bargaining power: price-sensitive daily buyers and illicit-market competition (over 50% of consumption in 2024) compress margins, while brand-loyal and medical patients reduce elasticity. Green Thumb’s proprietary POS/loyalty data and 170+ retail locations help blunt wholesale buyer leverage and drove reported 2024 revenue of about $1.1 billion. Promotions and easy SKU switching keep upward pressure on vendor concessions.
| Metric | 2024 |
|---|---|
| GTI revenue | $1.1B |
| US legal retail sales | $32B |
| Illicit share of consumption | >50% |
| Retail locations | 170+ |
Preview the Actual Deliverable
Green Thumb Porter's Five Forces Analysis
The Green Thumb Porter's Five Forces Analysis you see here is the exact, fully formatted document you'll receive immediately after purchase. It contains the full competitive assessment and actionable insights—no mockups or placeholders. Ready for instant download and use upon payment.
Original: $10.00
-65%$10.00
$3.50Description
A Must-Have Tool for Decision-Makers
Green Thumb's Porter's Five Forces snapshot highlights supplier leverage, buyer power, competitive rivalry, substitute threats, and barriers to entry shaping its market position. This brief overview surfaces key strategic pressures but omits force-by-force ratings and visuals. Unlock the full report for a consultant-grade, data-driven breakdown to inform investment or strategy decisions.
Suppliers Bargaining Power
Specialized inputs and genetics
Specialized genetics, advanced lighting, HVAC, and compliant packaging come from a limited vendor pool, raising switching costs and giving suppliers leverage on lead times and pricing; this concentration is meaningful as US legal cannabis sales approached $29 billion in 2024. GTI’s scale lets it multi-source where possible and dilute single-vendor risk. Long-term relationships and volume commitments allow GTI to negotiate improved delivery and pricing terms.
Vertical integration dampens leverage
As of 2024 GTI owns cultivation and manufacturing facilities, reducing dependence on third-party biomass suppliers. Internalizing these steps limits exposure to upstream price spikes and improves planning around yields and strain availability, a point GTI emphasized in 2024 investor materials. Supplier power diminishes when GTI can backfill demand with in-house capacity and expanded cultivation footprint in 2024.
Regulatory-approved bottlenecks
State rules narrow options for testing labs, child-resistant packaging and track-and-trace vendors, often leaving fewer than five approved suppliers per state, giving vendors price and service leverage; in 2024 compliance windows of 30–90 days forced buyers into less favorable terms. GTI mitigates risk by prequalifying vendors and keeping redundancy with 3+ approved suppliers.
Biomass oversupply in mature markets
In mature US markets with cultivation overbuild, wholesale flower has become commoditized, shifting bargaining power toward buyers like GTI; spot deals and discounting — reported up to 40% in oversupplied regions in 2024 — compress input costs and margin pressure on growers, while slowed inventory turns (often exceeding 90–120 days in 2024) further weaken supplier leverage.
- commoditization
- buyer leverage
- discounting up to 40% (2024)
- inventory days 90–120+ (2024)
Process lock-in and lead times
Process lock-in means changing substrates, nutrients, or equipment risks yield variability; grow cycles and validation extend switching times, often 6–12 weeks per cycle in cannabis cultivation (2024). Suppliers can extract value via price premiums and restrictive contract terms during transitions. GTI counters with strict SOPs and pilot testing before full shifts.
- Risk: yield variability
- Lead time: 6–12 weeks/cycle
- Supplier leverage: price/contract rents
- GTI mitigation: SOPs + pilots
Supplier leverage vs verticals as 40% discounts hit US cannabis
Limited vendor pools for genetics, lighting, HVAC and compliant packaging give suppliers pricing and lead-time leverage, but GTI’s vertical integration and multi-sourcing reduce dependence. Regulatory-approved vendor lists and process lock-in (6–12 week grow cycles) sustain some supplier rents, while commoditization in mature markets shifts power to buyers. Price pressures and oversupply drove discounts up to 40% in 2024.
| Metric | 2024 |
|---|---|
| US legal cannabis sales | $29B |
| Max reported discount | 40% |
| Inventory days | 90–120+ |
| Grow cycle switching | 6–12 weeks |
What is included in the product
Detailed Word Document
Uncovers key drivers of competition, buyer and supplier power, substitutes, and entry barriers specific to Green Thumb, with strategic commentary on threats and opportunities; fully editable for use in investor materials, strategy decks, or academic projects.
Customizable Excel Spreadsheet
A concise one-sheet Five Forces kit for Green Thumb highlights competitive pressures and relief options at a glance; editable pressure levels and an instant radar chart make scenario testing for product, channel, or regulatory shifts fast and actionable.
Customers Bargaining Power
Own retail offsets wholesale leverage
Operating over 140 retail stores across 12+ states gives Green Thumb a captive channel and guaranteed internal shelf space, cutting reliance on third-party retailers that demand margin and promotions. Proprietary POS and loyalty data from dispensaries enable tailored assortments and price strategies that raise basket size and reduce SKU markdowns. Wholesale accounts remain important, but steady internal throughput materially blunts buyer leverage.
Price sensitivity and compression
Consumers compare strains, formats and potencies across retailers, making price a primary decision driver; in mature US markets legal retail sales (~$32B in 2024) compete with an illicit market that still accounts for over 50% of consumption (2024 estimates), anchoring expectations lower. Retailers, including Green Thumb, push promotions and bundle deals to win foot traffic, intensifying buyer leverage and compressing prices and margins.
Brand equity tempers switching
Recognized brands in edibles, vapes and flower drive repeat purchases, with consistent quality and effects creating perceived differentiation that lowers price elasticity and cuts retailer pressure for deep discounts. GTI’s broad portfolio and national brands helped defend shelf space across 170+ retail locations, supporting reported 2024 revenue of about $1.1 billion and higher-margin branded SKUs.
Segment differences in sensitivity
Medical patients prioritize reliability and therapeutic outcomes, reducing price sensitivity and increasing loyalty; in 2024 US legal cannabis sales totaled about $30 billion (BDSA), with medical channels showing higher average order values. Adult-use tourists favor convenience and brand recognition, driving sales spikes in destination markets. Daily users are price- and promo-sensitive, amplifying buyer power where they dominate; overall buyer leverage shifts with state segment mix.
- Medical: low price sensitivity, higher AOV
- Tourists: convenience/brand-driven, seasonal spikes
- Daily users: value-seeking, promo-responsive
Low switching costs at retail
Shoppers can easily move across brands and SKUs in-store, with budtender recommendations frequently steering final basket choices and trial purchases. Retailers reallocate facings quickly based on velocity, enabling rapid promotion shifts and shelf displacement. This dynamic keeps upward pressure on vendor concessions and slotting terms as suppliers compete for premium shelf space.
- Low switching costs
- High budtender influence
- Rapid facing reallocation
- Upward vendor concessions
Retail footprint and loyalty data blunt wholesale leverage amid >50% illicit share
Customers wield moderate-to-high bargaining power: price-sensitive daily buyers and illicit-market competition (over 50% of consumption in 2024) compress margins, while brand-loyal and medical patients reduce elasticity. Green Thumb’s proprietary POS/loyalty data and 170+ retail locations help blunt wholesale buyer leverage and drove reported 2024 revenue of about $1.1 billion. Promotions and easy SKU switching keep upward pressure on vendor concessions.
| Metric | 2024 |
|---|---|
| GTI revenue | $1.1B |
| US legal retail sales | $32B |
| Illicit share of consumption | >50% |
| Retail locations | 170+ |
Preview the Actual Deliverable
Green Thumb Porter's Five Forces Analysis
The Green Thumb Porter's Five Forces Analysis you see here is the exact, fully formatted document you'll receive immediately after purchase. It contains the full competitive assessment and actionable insights—no mockups or placeholders. Ready for instant download and use upon payment.











