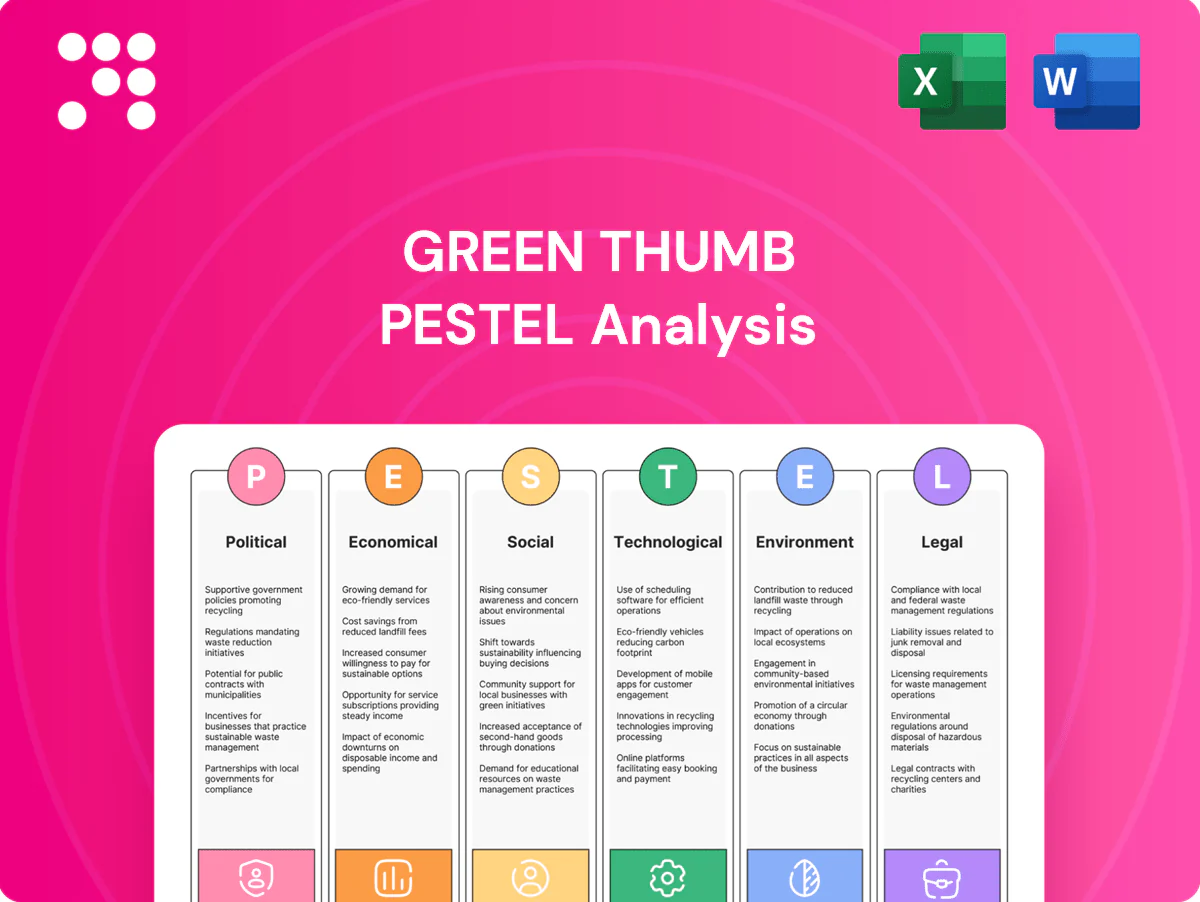
Green Thumb PESTLE Analysis

Your Shortcut to Market Insight Starts Here
Our Green Thumb PESTLE Analysis reveals how political, economic, social, technological, legal, and environmental forces shape the company’s prospects and risks; it’s tailored for investors, strategists, and consultants. Download the full report for the complete, actionable breakdown and ready-to-use insights to inform smart decisions.
Political factors

Federal rescheduling momentum
Progress toward U.S. federal rescheduling could ease tax burdens and expand research pathways. A shift to Schedule III would likely remove 280E, improving profitability and cash flow. Many operators report effective federal tax rates above 50%; moving to the 21% federal corporate rate could materially boost margins. Execution risk remains until rulemaking is finalized and implemented.
State-by-state policy patchwork
Non-uniform state laws force Green Thumb into complex, state-specific operating models, raising compliance costs and fragmenting branding across markets; US legal cannabis retail sales exceeded 30 billion dollars in 2024. Market access hinges on winning limited state licenses and tailoring operations to local rules. Cross-border synergies are constrained by federal prohibition on interstate commerce (cannabis remains Schedule I). Strategic store placement and targeted lobbying are therefore critical.

Banking and capital access politics
Movement on SAFE/SAFER Banking (House passage in 2023) would cut cash handling and fees that cost the US cannabis sector an estimated several billion dollars annually, lower financing frictions (current credit spreads often 300–1,000 bps above peers), and unlock M&A and capex at better terms; Senate stalls keep cost of capital elevated, so continued advocacy ties to public safety and regulatory normalization.

Municipal licensing and zoning
Municipal control sets dispensary density, store hours and community agreement terms; approval often requires fees and community benefits packages ranging roughly $50,000–$250,000 annually to win political goodwill.
Caps create scarcity value but limit expansion; site selection is driven by zoning buffers commonly set between 300 and 1,000 feet from schools and residences.
- Density limits
- Hours & agreements
- Community benefits $50k–$250k
- Caps = scarcity vs growth
- Zoning buffers 300–1,000 ft
Public health policy stance
- Harm reduction framing
- Potency/marketing/packaging limits
- Evidence-based education mitigates restrictions
- Partnerships build legitimacy
Rescheduling could cut federal tax >50% to 21%, boosting margins
Federal rescheduling could remove 280E and cut effective federal tax from >50% to 21%, materially boosting margins but timing/rulemaking is uncertain. State/municipal fragmentation (licenses, zoning 300–1,000 ft, community fees $50k–$250k) raises compliance costs and limits scale. SAFE banking and public-health framing (66% adult support) would lower cash handling costs and credit spreads (≈+300–1,000 bps), enabling M&A.
| Metric | Current | Potential Impact |
|---|---|---|
| Federal tax (effective) | >50% | 21% |
| US retail sales (2024) | $30B | Market scale |
| Credit spreads | +300–1,000 bps | Lower w/SAFE |
| Zoning buffers | 300–1,000 ft | Limits sites |
| Community fees | $50k–$250k | Capex/Opex |
What is included in the product
 Detailed Word Document
Explores how external macro-environmental factors uniquely affect Green Thumb across Political, Economic, Social, Technological, Environmental and Legal dimensions, with data-backed trends, industry-specific subpoints and forward-looking insights to help executives, investors and entrepreneurs identify risks, opportunities and funding-ready strategies.

 Customizable Excel Spreadsheet
A compact, visually segmented Green Thumb PESTLE summary that can be dropped into presentations, annotated for local context, and easily shared across teams to streamline external risk discussions and strategic planning.
Economic factors

Price compression and margin pressure
Industry oversupply has pushed U.S. wholesale flower prices down to roughly $1,000 per pound (Cannabis Benchmarks, 2023) and retail pricing has fallen ~10–15% year-over-year (BDSA), compressing margins. Green Thumb leans on vertical integration and brand differentiation to defend pricing power while strict cultivation and SG&A discipline and a premium/value tier mix preserve volume and margin balance.
Tax burden and 280E exposure
Until federal change, 280E removes ordinary business deductions so GTI and peers face GAAP effective tax rates commonly reported in the 45–70% range versus the 21% statutory corporate rate, materially reducing free cash flow. Rescheduling to permit normal deductions and a 21% federal rate could significantly expand after-tax earnings. State excise/sales levies—often adding double-digit percentage points and in some states exceeding 30%—compound out-the-door pricing pressure. Tax planning and footprint optimization are pivotal to mitigate these burdens.

Consumer demand elasticity
Macroeconomic softness—US inflation ~3.4% in 2024 and pressure on real incomes—pushes consumers toward lower-priced formats and larger value packs; legal cannabis sales exceeded $30 billion in 2024, intensifying value competition. Edibles and vapes enable trade-up for convenience and discretion, supporting SKU premiumization. Basket sizes and purchase frequency track disposable income, so promotions must avoid brand erosion.

Capital markets and M&A cycle
Constrained equity valuations (US cannabis sector market cap down ~60% from 2021 peaks) limit accretive share-financed deals; higher funding costs (US 10‑yr Treasury ~4.3% mid‑2025, high‑yield spreads ~450bps) and lender covenants slow expansion. Policy catalysts such as federal banking reform or rescheduling could re-open institutional flows; selective tuck‑ins add licenses, brands or capacity.
- Market cap decline ~60%
- 10‑yr Treasury ~4.3%
- HY spreads ~450bps
- 2024 US cannabis M&A <$2bn
Input costs and supply chain
Energy, labor and packaging drive COGS volatility—US industrial power averaged about $0.12–0.14/kWh in 2024 and wage growth ran near 4% y/y that year, squeezing margins. Long-lead equipment and regulatory vendors reported 6–12 month lead times in 2024, creating recurring bottlenecks. Supplier diversification and automation have reduced variable costs ~10–15% in peer operations, while local sourcing improved resilience and community ties.
- Energy: $0.12–0.14/kWh (US, 2024)
- Labor: ~4% y/y wage growth (2024)
- Lead times: 6–12 months for equipment/vendors (2024)
- Cost reduction: ~10–15% via automation/diversification
Rescheduling could cut federal tax >50% to 21%, boosting margins
Oversupply cut wholesale to ~$1,000/lb and retail prices down ~10–15% (2023–24), pressuring margins; GTI uses vertical integration and brand mix to defend pricing. 280E drives GAAP tax rates ~45–70% vs 21% statutory, constraining FCF; rescheduling would materially boost after‑tax earnings. Macroeconomic/inflation (US CPI ~3.4% 2024) shifts consumers to value SKUs while legal sales topped $30B (2024), intensifying competition.
| Metric | Value (2024/25) |
|---|---|
| Wholesale price | $1,000/lb |
| Retail price change | -10–15% YoY |
| GAAP tax rate | 45–70% |
| US CPI | ~3.4% |
| Legal sales | $30B+ |
Full Version Awaits
Green Thumb PESTLE Analysis
The preview shown here is the exact Green Thumb PESTLE Analysis you’ll receive after purchase—fully formatted and ready to use. It includes political, economic, social, technological, legal, and environmental insights tailored to Green Thumb. No placeholders or teasers: this is the finished file available immediately after checkout.

Your Shortcut to Market Insight Starts Here
Our Green Thumb PESTLE Analysis reveals how political, economic, social, technological, legal, and environmental forces shape the company’s prospects and risks; it’s tailored for investors, strategists, and consultants. Download the full report for the complete, actionable breakdown and ready-to-use insights to inform smart decisions.
Political factors
Federal rescheduling momentum
Progress toward U.S. federal rescheduling could ease tax burdens and expand research pathways. A shift to Schedule III would likely remove 280E, improving profitability and cash flow. Many operators report effective federal tax rates above 50%; moving to the 21% federal corporate rate could materially boost margins. Execution risk remains until rulemaking is finalized and implemented.
State-by-state policy patchwork
Non-uniform state laws force Green Thumb into complex, state-specific operating models, raising compliance costs and fragmenting branding across markets; US legal cannabis retail sales exceeded 30 billion dollars in 2024. Market access hinges on winning limited state licenses and tailoring operations to local rules. Cross-border synergies are constrained by federal prohibition on interstate commerce (cannabis remains Schedule I). Strategic store placement and targeted lobbying are therefore critical.
Banking and capital access politics
Movement on SAFE/SAFER Banking (House passage in 2023) would cut cash handling and fees that cost the US cannabis sector an estimated several billion dollars annually, lower financing frictions (current credit spreads often 300–1,000 bps above peers), and unlock M&A and capex at better terms; Senate stalls keep cost of capital elevated, so continued advocacy ties to public safety and regulatory normalization.
Municipal licensing and zoning
Municipal control sets dispensary density, store hours and community agreement terms; approval often requires fees and community benefits packages ranging roughly $50,000–$250,000 annually to win political goodwill.
Caps create scarcity value but limit expansion; site selection is driven by zoning buffers commonly set between 300 and 1,000 feet from schools and residences.
- Density limits
- Hours & agreements
- Community benefits $50k–$250k
- Caps = scarcity vs growth
- Zoning buffers 300–1,000 ft
Public health policy stance
- Harm reduction framing
- Potency/marketing/packaging limits
- Evidence-based education mitigates restrictions
- Partnerships build legitimacy
Rescheduling could cut federal tax >50% to 21%, boosting margins
Federal rescheduling could remove 280E and cut effective federal tax from >50% to 21%, materially boosting margins but timing/rulemaking is uncertain. State/municipal fragmentation (licenses, zoning 300–1,000 ft, community fees $50k–$250k) raises compliance costs and limits scale. SAFE banking and public-health framing (66% adult support) would lower cash handling costs and credit spreads (≈+300–1,000 bps), enabling M&A.
| Metric | Current | Potential Impact |
|---|---|---|
| Federal tax (effective) | >50% | 21% |
| US retail sales (2024) | $30B | Market scale |
| Credit spreads | +300–1,000 bps | Lower w/SAFE |
| Zoning buffers | 300–1,000 ft | Limits sites |
| Community fees | $50k–$250k | Capex/Opex |
What is included in the product
Detailed Word Document
Explores how external macro-environmental factors uniquely affect Green Thumb across Political, Economic, Social, Technological, Environmental and Legal dimensions, with data-backed trends, industry-specific subpoints and forward-looking insights to help executives, investors and entrepreneurs identify risks, opportunities and funding-ready strategies.
Customizable Excel Spreadsheet
A compact, visually segmented Green Thumb PESTLE summary that can be dropped into presentations, annotated for local context, and easily shared across teams to streamline external risk discussions and strategic planning.
Economic factors
Price compression and margin pressure
Industry oversupply has pushed U.S. wholesale flower prices down to roughly $1,000 per pound (Cannabis Benchmarks, 2023) and retail pricing has fallen ~10–15% year-over-year (BDSA), compressing margins. Green Thumb leans on vertical integration and brand differentiation to defend pricing power while strict cultivation and SG&A discipline and a premium/value tier mix preserve volume and margin balance.
Tax burden and 280E exposure
Until federal change, 280E removes ordinary business deductions so GTI and peers face GAAP effective tax rates commonly reported in the 45–70% range versus the 21% statutory corporate rate, materially reducing free cash flow. Rescheduling to permit normal deductions and a 21% federal rate could significantly expand after-tax earnings. State excise/sales levies—often adding double-digit percentage points and in some states exceeding 30%—compound out-the-door pricing pressure. Tax planning and footprint optimization are pivotal to mitigate these burdens.
Consumer demand elasticity
Macroeconomic softness—US inflation ~3.4% in 2024 and pressure on real incomes—pushes consumers toward lower-priced formats and larger value packs; legal cannabis sales exceeded $30 billion in 2024, intensifying value competition. Edibles and vapes enable trade-up for convenience and discretion, supporting SKU premiumization. Basket sizes and purchase frequency track disposable income, so promotions must avoid brand erosion.
Capital markets and M&A cycle
Constrained equity valuations (US cannabis sector market cap down ~60% from 2021 peaks) limit accretive share-financed deals; higher funding costs (US 10‑yr Treasury ~4.3% mid‑2025, high‑yield spreads ~450bps) and lender covenants slow expansion. Policy catalysts such as federal banking reform or rescheduling could re-open institutional flows; selective tuck‑ins add licenses, brands or capacity.
- Market cap decline ~60%
- 10‑yr Treasury ~4.3%
- HY spreads ~450bps
- 2024 US cannabis M&A <$2bn
Input costs and supply chain
Energy, labor and packaging drive COGS volatility—US industrial power averaged about $0.12–0.14/kWh in 2024 and wage growth ran near 4% y/y that year, squeezing margins. Long-lead equipment and regulatory vendors reported 6–12 month lead times in 2024, creating recurring bottlenecks. Supplier diversification and automation have reduced variable costs ~10–15% in peer operations, while local sourcing improved resilience and community ties.
- Energy: $0.12–0.14/kWh (US, 2024)
- Labor: ~4% y/y wage growth (2024)
- Lead times: 6–12 months for equipment/vendors (2024)
- Cost reduction: ~10–15% via automation/diversification
Rescheduling could cut federal tax >50% to 21%, boosting margins
Oversupply cut wholesale to ~$1,000/lb and retail prices down ~10–15% (2023–24), pressuring margins; GTI uses vertical integration and brand mix to defend pricing. 280E drives GAAP tax rates ~45–70% vs 21% statutory, constraining FCF; rescheduling would materially boost after‑tax earnings. Macroeconomic/inflation (US CPI ~3.4% 2024) shifts consumers to value SKUs while legal sales topped $30B (2024), intensifying competition.
| Metric | Value (2024/25) |
|---|---|
| Wholesale price | $1,000/lb |
| Retail price change | -10–15% YoY |
| GAAP tax rate | 45–70% |
| US CPI | ~3.4% |
| Legal sales | $30B+ |
Full Version Awaits
Green Thumb PESTLE Analysis
The preview shown here is the exact Green Thumb PESTLE Analysis you’ll receive after purchase—fully formatted and ready to use. It includes political, economic, social, technological, legal, and environmental insights tailored to Green Thumb. No placeholders or teasers: this is the finished file available immediately after checkout.
Description
Your Shortcut to Market Insight Starts Here
Our Green Thumb PESTLE Analysis reveals how political, economic, social, technological, legal, and environmental forces shape the company’s prospects and risks; it’s tailored for investors, strategists, and consultants. Download the full report for the complete, actionable breakdown and ready-to-use insights to inform smart decisions.
Political factors
Federal rescheduling momentum
Progress toward U.S. federal rescheduling could ease tax burdens and expand research pathways. A shift to Schedule III would likely remove 280E, improving profitability and cash flow. Many operators report effective federal tax rates above 50%; moving to the 21% federal corporate rate could materially boost margins. Execution risk remains until rulemaking is finalized and implemented.
State-by-state policy patchwork
Non-uniform state laws force Green Thumb into complex, state-specific operating models, raising compliance costs and fragmenting branding across markets; US legal cannabis retail sales exceeded 30 billion dollars in 2024. Market access hinges on winning limited state licenses and tailoring operations to local rules. Cross-border synergies are constrained by federal prohibition on interstate commerce (cannabis remains Schedule I). Strategic store placement and targeted lobbying are therefore critical.
Banking and capital access politics
Movement on SAFE/SAFER Banking (House passage in 2023) would cut cash handling and fees that cost the US cannabis sector an estimated several billion dollars annually, lower financing frictions (current credit spreads often 300–1,000 bps above peers), and unlock M&A and capex at better terms; Senate stalls keep cost of capital elevated, so continued advocacy ties to public safety and regulatory normalization.
Municipal licensing and zoning
Municipal control sets dispensary density, store hours and community agreement terms; approval often requires fees and community benefits packages ranging roughly $50,000–$250,000 annually to win political goodwill.
Caps create scarcity value but limit expansion; site selection is driven by zoning buffers commonly set between 300 and 1,000 feet from schools and residences.
- Density limits
- Hours & agreements
- Community benefits $50k–$250k
- Caps = scarcity vs growth
- Zoning buffers 300–1,000 ft
Public health policy stance
- Harm reduction framing
- Potency/marketing/packaging limits
- Evidence-based education mitigates restrictions
- Partnerships build legitimacy
Rescheduling could cut federal tax >50% to 21%, boosting margins
Federal rescheduling could remove 280E and cut effective federal tax from >50% to 21%, materially boosting margins but timing/rulemaking is uncertain. State/municipal fragmentation (licenses, zoning 300–1,000 ft, community fees $50k–$250k) raises compliance costs and limits scale. SAFE banking and public-health framing (66% adult support) would lower cash handling costs and credit spreads (≈+300–1,000 bps), enabling M&A.
| Metric | Current | Potential Impact |
|---|---|---|
| Federal tax (effective) | >50% | 21% |
| US retail sales (2024) | $30B | Market scale |
| Credit spreads | +300–1,000 bps | Lower w/SAFE |
| Zoning buffers | 300–1,000 ft | Limits sites |
| Community fees | $50k–$250k | Capex/Opex |
What is included in the product
Detailed Word Document
Explores how external macro-environmental factors uniquely affect Green Thumb across Political, Economic, Social, Technological, Environmental and Legal dimensions, with data-backed trends, industry-specific subpoints and forward-looking insights to help executives, investors and entrepreneurs identify risks, opportunities and funding-ready strategies.
Customizable Excel Spreadsheet
A compact, visually segmented Green Thumb PESTLE summary that can be dropped into presentations, annotated for local context, and easily shared across teams to streamline external risk discussions and strategic planning.
Economic factors
Price compression and margin pressure
Industry oversupply has pushed U.S. wholesale flower prices down to roughly $1,000 per pound (Cannabis Benchmarks, 2023) and retail pricing has fallen ~10–15% year-over-year (BDSA), compressing margins. Green Thumb leans on vertical integration and brand differentiation to defend pricing power while strict cultivation and SG&A discipline and a premium/value tier mix preserve volume and margin balance.
Tax burden and 280E exposure
Until federal change, 280E removes ordinary business deductions so GTI and peers face GAAP effective tax rates commonly reported in the 45–70% range versus the 21% statutory corporate rate, materially reducing free cash flow. Rescheduling to permit normal deductions and a 21% federal rate could significantly expand after-tax earnings. State excise/sales levies—often adding double-digit percentage points and in some states exceeding 30%—compound out-the-door pricing pressure. Tax planning and footprint optimization are pivotal to mitigate these burdens.
Consumer demand elasticity
Macroeconomic softness—US inflation ~3.4% in 2024 and pressure on real incomes—pushes consumers toward lower-priced formats and larger value packs; legal cannabis sales exceeded $30 billion in 2024, intensifying value competition. Edibles and vapes enable trade-up for convenience and discretion, supporting SKU premiumization. Basket sizes and purchase frequency track disposable income, so promotions must avoid brand erosion.
Capital markets and M&A cycle
Constrained equity valuations (US cannabis sector market cap down ~60% from 2021 peaks) limit accretive share-financed deals; higher funding costs (US 10‑yr Treasury ~4.3% mid‑2025, high‑yield spreads ~450bps) and lender covenants slow expansion. Policy catalysts such as federal banking reform or rescheduling could re-open institutional flows; selective tuck‑ins add licenses, brands or capacity.
- Market cap decline ~60%
- 10‑yr Treasury ~4.3%
- HY spreads ~450bps
- 2024 US cannabis M&A <$2bn
Input costs and supply chain
Energy, labor and packaging drive COGS volatility—US industrial power averaged about $0.12–0.14/kWh in 2024 and wage growth ran near 4% y/y that year, squeezing margins. Long-lead equipment and regulatory vendors reported 6–12 month lead times in 2024, creating recurring bottlenecks. Supplier diversification and automation have reduced variable costs ~10–15% in peer operations, while local sourcing improved resilience and community ties.
- Energy: $0.12–0.14/kWh (US, 2024)
- Labor: ~4% y/y wage growth (2024)
- Lead times: 6–12 months for equipment/vendors (2024)
- Cost reduction: ~10–15% via automation/diversification
Rescheduling could cut federal tax >50% to 21%, boosting margins
Oversupply cut wholesale to ~$1,000/lb and retail prices down ~10–15% (2023–24), pressuring margins; GTI uses vertical integration and brand mix to defend pricing. 280E drives GAAP tax rates ~45–70% vs 21% statutory, constraining FCF; rescheduling would materially boost after‑tax earnings. Macroeconomic/inflation (US CPI ~3.4% 2024) shifts consumers to value SKUs while legal sales topped $30B (2024), intensifying competition.
| Metric | Value (2024/25) |
|---|---|
| Wholesale price | $1,000/lb |
| Retail price change | -10–15% YoY |
| GAAP tax rate | 45–70% |
| US CPI | ~3.4% |
| Legal sales | $30B+ |
Full Version Awaits
Green Thumb PESTLE Analysis
The preview shown here is the exact Green Thumb PESTLE Analysis you’ll receive after purchase—fully formatted and ready to use. It includes political, economic, social, technological, legal, and environmental insights tailored to Green Thumb. No placeholders or teasers: this is the finished file available immediately after checkout.











