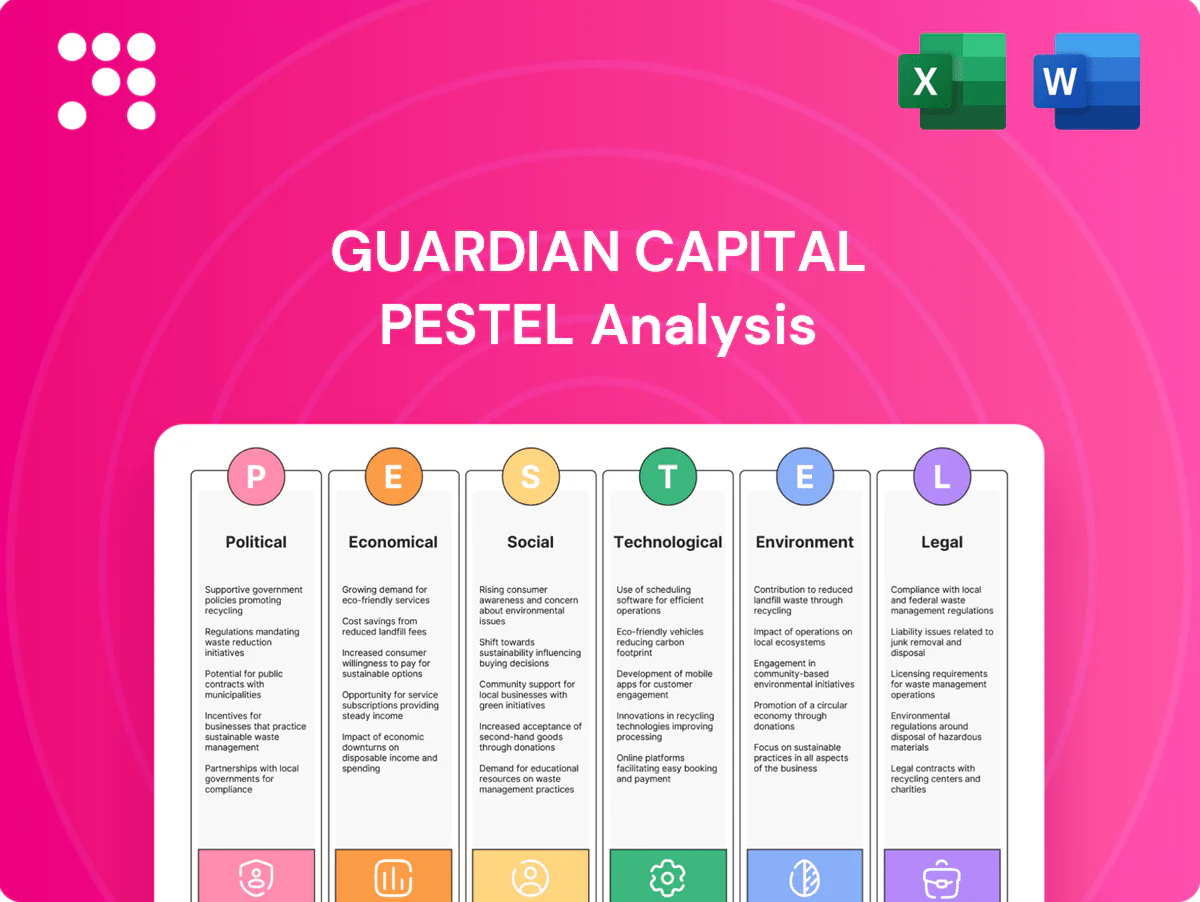
Guardian Capital PESTLE Analysis

Skip the Research. Get the Strategy.
Gain strategic clarity with our PESTLE Analysis of Guardian Capital—three to five concise sections unpacking political, economic, social, technological, legal, and environmental forces shaping its outlook. Ideal for investors and strategists, this report turns external trends into actionable insights. Purchase the full analysis to access detailed data, forecasts, and ready-to-use recommendations.
Political factors

Regulatory stability in home markets
Guardian Capital operates under Canadian and US frameworks where stable governments support predictable supervision, licensing and prudential norms; US retirement assets exceeded roughly USD 35 trillion in 2024, underscoring scale of regulated flows. Tax or pension policy shifts (federal or provincial) can quickly redirect retail and institutional inflows into managed products, so monitoring priorities helps anticipate changes to savings incentives and investment rules.
Geopolitical tensions and sanctions regimes
Cross-border portfolios face rising risk from sanctions, trade disputes and geopolitical shocks; OFAC's SDN list topped 8,000 entries by mid-2024, constraining exposures, counterparties and settlement in affected jurisdictions. Asset allocation may need rapid rebalancing to comply with evolving lists. Heightened uncertainty has driven increased client demand for capital-preservation mandates.

Public pension and sovereign wealth policy
Institutional mandates for Guardian Capital hinge on public pension and sovereign wealth investment policies, with global sovereign wealth funds holding about USD 11 trillion as of mid-2024 and passive ownership of US equity exceeding 50% by 2023. Shifts toward active, passive or alternatives change mandate sizes and fee mixes, affecting fee revenue and AUM. Governance reforms often trigger manager reviews and RFP cycles, increasing churn. Building policy-aligned solutions supports mandate retention and growth.

Government stimulus and infrastructure agendas
Fiscal programs shape sector performance and private capital flows: US Bipartisan Infrastructure Law mobilised about 1.2 trillion USD and the Inflation Reduction Act adds ~369 billion USD, while Canada’s Investing in Canada Plan totals 180 billion CAD, expanding deal pipelines for infrastructure and alternatives; austerity or deficit constraints can reduce institutional risk appetite; clearer multi-year policy boosts fundraising for long-duration strategies.
- US BIL: 1.2 trillion USD
- IRA: ~369 billion USD
- Canada plan: 180 billion CAD
- Policy clarity = easier long-duration fundraising
Political pressure on fees and market structure
- Policy debate: stricter best-execution & fee disclosure
- Scale: ETFs 12.3 trillion USD (end-2024, ETFGI)
- Impact: fee compression vs larger addressable market
- Action: proactive engagement with regulators
Regulatory shifts and sanctions redirect capital; US retirement assets 35T
Guardian Capital faces stable Canadian/US regulation but pension and tax reforms can redirect flows; US retirement assets ~35 trillion USD (2024). Sanctions/geo risk (OFAC SDN >8,000 mid-2024) force rapid rebalancing and boost capital‑preservation demand. Fee and market‑structure reforms may compress margins while ETFs (12.3 trillion USD end‑2024) expand AUM; proactive regulatory engagement is essential.
| Metric | 2024 value |
|---|---|
| US retirement assets | ~35 trillion USD |
| OFAC SDN entries | >8,000 (mid‑2024) |
| Global ETF AUM | 12.3 trillion USD (end‑2024) |
What is included in the product
 Detailed Word Document
Explores how external macro-environmental factors uniquely affect Guardian Capital across Political, Economic, Social, Technological, Environmental and Legal dimensions, with each section backed by relevant data and current trends. Designed for executives, consultants and entrepreneurs, the analysis links regional and industry dynamics to actionable threats, opportunities and forward-looking scenarios ready for business plans or investor materials.

 Customizable Excel Spreadsheet
A concise, visually segmented PESTLE summary of Guardian Capital that’s easy to drop into presentations, share across teams, and customize with notes to support external risk discussions and strategic planning.
Economic factors

Interest rate cycles and yield curves
Rate paths drive fixed income returns, equity valuations and asset allocation: US 10-year yields near 4.2% in July 2025 and policy rates around 5.25–5.50% continue to reprice risk premia. Curve inversions or steepening shift demand for duration versus credit, altering portfolio hedge needs. Wealth clients rotate between income, growth and capital preservation, while dynamic multi-asset strategies reduce cycle risk.
Market volatility and risk sentiment
Large drawdowns such as the 19.4% S&P 500 decline in 2022 push flows into defensive and alternative solutions, while higher realized and implied volatility raises hedging costs and creates alpha opportunities from dispersion trades.
Institutional clients increasingly reassess tracking error targets (commonly 1–3%) and demand explicit downside protection; robust risk management and stress-tested mandates underpin resilience amid elevated market risk.

Global growth and currency movements
Guardian Capital’s multi-region exposure creates FX translation risk but also diversification benefits as the IMF April 2025 WEO projects global growth of 3.1% in 2024 and 3.0% in 2025, shifting sector leadership across regions. Growth differentials drive country allocations and sector tilts, while currency-hedging policies materially alter reported performance and can affect fee structures. Proprietary macro research underpins tactical tilts and client guidance.

Fee compression and competition
Passive adoption and scale players have driven fee compression: global ETF AUM topped $12 trillion in 2024, pushing median ETF fees to about 0.09% versus active equity averages near 0.44%, pressuring Guardian Capital’s active fee rates. Differentiated alpha, alternatives and outcome-oriented mandates defend pricing by delivering net-of-fee returns. Operating leverage and technology reduce unit costs, enabling margin expansion. Transparent value propositions sustain net new asset growth.
- Passive scale: $12T ETF AUM (2024)
- Fee gap: 0.09% ETF vs 0.44% active (2024)
- Defense: alternatives & outcome mandates
- Efficiency: tech-driven cost reduction
Demographics and wealth creation
Aging populations are rising: 65+ numbered 727 million in 2020 and are projected to reach 1.5 billion by 2050 (UN DESA), driving retirement-income and decumulation demand that benefits Guardian Capital’s income solutions.
Emerging affluent cohorts favor hybrid digital-advice; an estimated US$84 trillion in intergenerational wealth transfers (2020–2045) reshapes product packaging and education, so tailored life-stage solutions boost retention.
- 65+ growth: 727M→1.5B (2020–2050)
- OECD 65+ ~18.5%
- Wealth transfer: US$84T (2020–2045)
- Hybrid digital demand ↑ retention
Regulatory shifts and sanctions redirect capital; US retirement assets 35T
Rate paths (US 10y ~4.2% Jul 2025) and curve moves shape fixed income returns, equity valuations and demand for hedges; volatility spikes raise hedging costs but create dispersion alpha. Fee compression from $12T ETF scale (median 0.09% vs active 0.44% in 2024) forces product differentiation and tech-led cost efficiency. Demographics (65+ 727M→1.5B by 2050) and US$84T wealth transfer drive income, decumulation and digital-hybrid demand.
| Metric | Value |
|---|---|
| US 10‑yr (Jul 2025) | ~4.2% |
| Global growth (IMF WEO 2025) | 3.0% (2025) |
| ETF AUM (2024) | $12T |
| Median fees (2024) | ETF 0.09% / Active 0.44% |
| 65+ population | 727M (2020) → 1.5B (2050) |
| Wealth transfer (2020–2045) | US$84T |
Full Version Awaits
Guardian Capital PESTLE Analysis
The preview shown here is the exact Guardian Capital PESTLE Analysis you’ll receive after purchase—fully formatted and ready to use. This file is the final version with no placeholders or teasers. The layout, content, and structure visible here are exactly what you’ll download immediately after payment.

Skip the Research. Get the Strategy.
Gain strategic clarity with our PESTLE Analysis of Guardian Capital—three to five concise sections unpacking political, economic, social, technological, legal, and environmental forces shaping its outlook. Ideal for investors and strategists, this report turns external trends into actionable insights. Purchase the full analysis to access detailed data, forecasts, and ready-to-use recommendations.
Political factors
Regulatory stability in home markets
Guardian Capital operates under Canadian and US frameworks where stable governments support predictable supervision, licensing and prudential norms; US retirement assets exceeded roughly USD 35 trillion in 2024, underscoring scale of regulated flows. Tax or pension policy shifts (federal or provincial) can quickly redirect retail and institutional inflows into managed products, so monitoring priorities helps anticipate changes to savings incentives and investment rules.
Geopolitical tensions and sanctions regimes
Cross-border portfolios face rising risk from sanctions, trade disputes and geopolitical shocks; OFAC's SDN list topped 8,000 entries by mid-2024, constraining exposures, counterparties and settlement in affected jurisdictions. Asset allocation may need rapid rebalancing to comply with evolving lists. Heightened uncertainty has driven increased client demand for capital-preservation mandates.
Public pension and sovereign wealth policy
Institutional mandates for Guardian Capital hinge on public pension and sovereign wealth investment policies, with global sovereign wealth funds holding about USD 11 trillion as of mid-2024 and passive ownership of US equity exceeding 50% by 2023. Shifts toward active, passive or alternatives change mandate sizes and fee mixes, affecting fee revenue and AUM. Governance reforms often trigger manager reviews and RFP cycles, increasing churn. Building policy-aligned solutions supports mandate retention and growth.
Government stimulus and infrastructure agendas
Fiscal programs shape sector performance and private capital flows: US Bipartisan Infrastructure Law mobilised about 1.2 trillion USD and the Inflation Reduction Act adds ~369 billion USD, while Canada’s Investing in Canada Plan totals 180 billion CAD, expanding deal pipelines for infrastructure and alternatives; austerity or deficit constraints can reduce institutional risk appetite; clearer multi-year policy boosts fundraising for long-duration strategies.
- US BIL: 1.2 trillion USD
- IRA: ~369 billion USD
- Canada plan: 180 billion CAD
- Policy clarity = easier long-duration fundraising
Political pressure on fees and market structure
- Policy debate: stricter best-execution & fee disclosure
- Scale: ETFs 12.3 trillion USD (end-2024, ETFGI)
- Impact: fee compression vs larger addressable market
- Action: proactive engagement with regulators
Regulatory shifts and sanctions redirect capital; US retirement assets 35T
Guardian Capital faces stable Canadian/US regulation but pension and tax reforms can redirect flows; US retirement assets ~35 trillion USD (2024). Sanctions/geo risk (OFAC SDN >8,000 mid-2024) force rapid rebalancing and boost capital‑preservation demand. Fee and market‑structure reforms may compress margins while ETFs (12.3 trillion USD end‑2024) expand AUM; proactive regulatory engagement is essential.
| Metric | 2024 value |
|---|---|
| US retirement assets | ~35 trillion USD |
| OFAC SDN entries | >8,000 (mid‑2024) |
| Global ETF AUM | 12.3 trillion USD (end‑2024) |
What is included in the product
Detailed Word Document
Explores how external macro-environmental factors uniquely affect Guardian Capital across Political, Economic, Social, Technological, Environmental and Legal dimensions, with each section backed by relevant data and current trends. Designed for executives, consultants and entrepreneurs, the analysis links regional and industry dynamics to actionable threats, opportunities and forward-looking scenarios ready for business plans or investor materials.
Customizable Excel Spreadsheet
A concise, visually segmented PESTLE summary of Guardian Capital that’s easy to drop into presentations, share across teams, and customize with notes to support external risk discussions and strategic planning.
Economic factors
Interest rate cycles and yield curves
Rate paths drive fixed income returns, equity valuations and asset allocation: US 10-year yields near 4.2% in July 2025 and policy rates around 5.25–5.50% continue to reprice risk premia. Curve inversions or steepening shift demand for duration versus credit, altering portfolio hedge needs. Wealth clients rotate between income, growth and capital preservation, while dynamic multi-asset strategies reduce cycle risk.
Market volatility and risk sentiment
Large drawdowns such as the 19.4% S&P 500 decline in 2022 push flows into defensive and alternative solutions, while higher realized and implied volatility raises hedging costs and creates alpha opportunities from dispersion trades.
Institutional clients increasingly reassess tracking error targets (commonly 1–3%) and demand explicit downside protection; robust risk management and stress-tested mandates underpin resilience amid elevated market risk.
Global growth and currency movements
Guardian Capital’s multi-region exposure creates FX translation risk but also diversification benefits as the IMF April 2025 WEO projects global growth of 3.1% in 2024 and 3.0% in 2025, shifting sector leadership across regions. Growth differentials drive country allocations and sector tilts, while currency-hedging policies materially alter reported performance and can affect fee structures. Proprietary macro research underpins tactical tilts and client guidance.
Fee compression and competition
Passive adoption and scale players have driven fee compression: global ETF AUM topped $12 trillion in 2024, pushing median ETF fees to about 0.09% versus active equity averages near 0.44%, pressuring Guardian Capital’s active fee rates. Differentiated alpha, alternatives and outcome-oriented mandates defend pricing by delivering net-of-fee returns. Operating leverage and technology reduce unit costs, enabling margin expansion. Transparent value propositions sustain net new asset growth.
- Passive scale: $12T ETF AUM (2024)
- Fee gap: 0.09% ETF vs 0.44% active (2024)
- Defense: alternatives & outcome mandates
- Efficiency: tech-driven cost reduction
Demographics and wealth creation
Aging populations are rising: 65+ numbered 727 million in 2020 and are projected to reach 1.5 billion by 2050 (UN DESA), driving retirement-income and decumulation demand that benefits Guardian Capital’s income solutions.
Emerging affluent cohorts favor hybrid digital-advice; an estimated US$84 trillion in intergenerational wealth transfers (2020–2045) reshapes product packaging and education, so tailored life-stage solutions boost retention.
- 65+ growth: 727M→1.5B (2020–2050)
- OECD 65+ ~18.5%
- Wealth transfer: US$84T (2020–2045)
- Hybrid digital demand ↑ retention
Regulatory shifts and sanctions redirect capital; US retirement assets 35T
Rate paths (US 10y ~4.2% Jul 2025) and curve moves shape fixed income returns, equity valuations and demand for hedges; volatility spikes raise hedging costs but create dispersion alpha. Fee compression from $12T ETF scale (median 0.09% vs active 0.44% in 2024) forces product differentiation and tech-led cost efficiency. Demographics (65+ 727M→1.5B by 2050) and US$84T wealth transfer drive income, decumulation and digital-hybrid demand.
| Metric | Value |
|---|---|
| US 10‑yr (Jul 2025) | ~4.2% |
| Global growth (IMF WEO 2025) | 3.0% (2025) |
| ETF AUM (2024) | $12T |
| Median fees (2024) | ETF 0.09% / Active 0.44% |
| 65+ population | 727M (2020) → 1.5B (2050) |
| Wealth transfer (2020–2045) | US$84T |
Full Version Awaits
Guardian Capital PESTLE Analysis
The preview shown here is the exact Guardian Capital PESTLE Analysis you’ll receive after purchase—fully formatted and ready to use. This file is the final version with no placeholders or teasers. The layout, content, and structure visible here are exactly what you’ll download immediately after payment.
Description
Skip the Research. Get the Strategy.
Gain strategic clarity with our PESTLE Analysis of Guardian Capital—three to five concise sections unpacking political, economic, social, technological, legal, and environmental forces shaping its outlook. Ideal for investors and strategists, this report turns external trends into actionable insights. Purchase the full analysis to access detailed data, forecasts, and ready-to-use recommendations.
Political factors
Regulatory stability in home markets
Guardian Capital operates under Canadian and US frameworks where stable governments support predictable supervision, licensing and prudential norms; US retirement assets exceeded roughly USD 35 trillion in 2024, underscoring scale of regulated flows. Tax or pension policy shifts (federal or provincial) can quickly redirect retail and institutional inflows into managed products, so monitoring priorities helps anticipate changes to savings incentives and investment rules.
Geopolitical tensions and sanctions regimes
Cross-border portfolios face rising risk from sanctions, trade disputes and geopolitical shocks; OFAC's SDN list topped 8,000 entries by mid-2024, constraining exposures, counterparties and settlement in affected jurisdictions. Asset allocation may need rapid rebalancing to comply with evolving lists. Heightened uncertainty has driven increased client demand for capital-preservation mandates.
Public pension and sovereign wealth policy
Institutional mandates for Guardian Capital hinge on public pension and sovereign wealth investment policies, with global sovereign wealth funds holding about USD 11 trillion as of mid-2024 and passive ownership of US equity exceeding 50% by 2023. Shifts toward active, passive or alternatives change mandate sizes and fee mixes, affecting fee revenue and AUM. Governance reforms often trigger manager reviews and RFP cycles, increasing churn. Building policy-aligned solutions supports mandate retention and growth.
Government stimulus and infrastructure agendas
Fiscal programs shape sector performance and private capital flows: US Bipartisan Infrastructure Law mobilised about 1.2 trillion USD and the Inflation Reduction Act adds ~369 billion USD, while Canada’s Investing in Canada Plan totals 180 billion CAD, expanding deal pipelines for infrastructure and alternatives; austerity or deficit constraints can reduce institutional risk appetite; clearer multi-year policy boosts fundraising for long-duration strategies.
- US BIL: 1.2 trillion USD
- IRA: ~369 billion USD
- Canada plan: 180 billion CAD
- Policy clarity = easier long-duration fundraising
Political pressure on fees and market structure
- Policy debate: stricter best-execution & fee disclosure
- Scale: ETFs 12.3 trillion USD (end-2024, ETFGI)
- Impact: fee compression vs larger addressable market
- Action: proactive engagement with regulators
Regulatory shifts and sanctions redirect capital; US retirement assets 35T
Guardian Capital faces stable Canadian/US regulation but pension and tax reforms can redirect flows; US retirement assets ~35 trillion USD (2024). Sanctions/geo risk (OFAC SDN >8,000 mid-2024) force rapid rebalancing and boost capital‑preservation demand. Fee and market‑structure reforms may compress margins while ETFs (12.3 trillion USD end‑2024) expand AUM; proactive regulatory engagement is essential.
| Metric | 2024 value |
|---|---|
| US retirement assets | ~35 trillion USD |
| OFAC SDN entries | >8,000 (mid‑2024) |
| Global ETF AUM | 12.3 trillion USD (end‑2024) |
What is included in the product
Detailed Word Document
Explores how external macro-environmental factors uniquely affect Guardian Capital across Political, Economic, Social, Technological, Environmental and Legal dimensions, with each section backed by relevant data and current trends. Designed for executives, consultants and entrepreneurs, the analysis links regional and industry dynamics to actionable threats, opportunities and forward-looking scenarios ready for business plans or investor materials.
Customizable Excel Spreadsheet
A concise, visually segmented PESTLE summary of Guardian Capital that’s easy to drop into presentations, share across teams, and customize with notes to support external risk discussions and strategic planning.
Economic factors
Interest rate cycles and yield curves
Rate paths drive fixed income returns, equity valuations and asset allocation: US 10-year yields near 4.2% in July 2025 and policy rates around 5.25–5.50% continue to reprice risk premia. Curve inversions or steepening shift demand for duration versus credit, altering portfolio hedge needs. Wealth clients rotate between income, growth and capital preservation, while dynamic multi-asset strategies reduce cycle risk.
Market volatility and risk sentiment
Large drawdowns such as the 19.4% S&P 500 decline in 2022 push flows into defensive and alternative solutions, while higher realized and implied volatility raises hedging costs and creates alpha opportunities from dispersion trades.
Institutional clients increasingly reassess tracking error targets (commonly 1–3%) and demand explicit downside protection; robust risk management and stress-tested mandates underpin resilience amid elevated market risk.
Global growth and currency movements
Guardian Capital’s multi-region exposure creates FX translation risk but also diversification benefits as the IMF April 2025 WEO projects global growth of 3.1% in 2024 and 3.0% in 2025, shifting sector leadership across regions. Growth differentials drive country allocations and sector tilts, while currency-hedging policies materially alter reported performance and can affect fee structures. Proprietary macro research underpins tactical tilts and client guidance.
Fee compression and competition
Passive adoption and scale players have driven fee compression: global ETF AUM topped $12 trillion in 2024, pushing median ETF fees to about 0.09% versus active equity averages near 0.44%, pressuring Guardian Capital’s active fee rates. Differentiated alpha, alternatives and outcome-oriented mandates defend pricing by delivering net-of-fee returns. Operating leverage and technology reduce unit costs, enabling margin expansion. Transparent value propositions sustain net new asset growth.
- Passive scale: $12T ETF AUM (2024)
- Fee gap: 0.09% ETF vs 0.44% active (2024)
- Defense: alternatives & outcome mandates
- Efficiency: tech-driven cost reduction
Demographics and wealth creation
Aging populations are rising: 65+ numbered 727 million in 2020 and are projected to reach 1.5 billion by 2050 (UN DESA), driving retirement-income and decumulation demand that benefits Guardian Capital’s income solutions.
Emerging affluent cohorts favor hybrid digital-advice; an estimated US$84 trillion in intergenerational wealth transfers (2020–2045) reshapes product packaging and education, so tailored life-stage solutions boost retention.
- 65+ growth: 727M→1.5B (2020–2050)
- OECD 65+ ~18.5%
- Wealth transfer: US$84T (2020–2045)
- Hybrid digital demand ↑ retention
Regulatory shifts and sanctions redirect capital; US retirement assets 35T
Rate paths (US 10y ~4.2% Jul 2025) and curve moves shape fixed income returns, equity valuations and demand for hedges; volatility spikes raise hedging costs but create dispersion alpha. Fee compression from $12T ETF scale (median 0.09% vs active 0.44% in 2024) forces product differentiation and tech-led cost efficiency. Demographics (65+ 727M→1.5B by 2050) and US$84T wealth transfer drive income, decumulation and digital-hybrid demand.
| Metric | Value |
|---|---|
| US 10‑yr (Jul 2025) | ~4.2% |
| Global growth (IMF WEO 2025) | 3.0% (2025) |
| ETF AUM (2024) | $12T |
| Median fees (2024) | ETF 0.09% / Active 0.44% |
| 65+ population | 727M (2020) → 1.5B (2050) |
| Wealth transfer (2020–2045) | US$84T |
Full Version Awaits
Guardian Capital PESTLE Analysis
The preview shown here is the exact Guardian Capital PESTLE Analysis you’ll receive after purchase—fully formatted and ready to use. This file is the final version with no placeholders or teasers. The layout, content, and structure visible here are exactly what you’ll download immediately after payment.











